. 2022 Jul 25:16:895637.
doi: 10.3389/fnins.2022.895637. eCollection 2022.

Two-step clustering-based pipeline for big dynamic functional network connectivity data

Affiliations

Two-step clustering-based pipeline for big dynamic functional network connectivity data

Mohammad S E Sendi et al. Front Neurosci. .

Abstract

Background: Dynamic functional network connectivity (dFNC) estimated from resting-state functional magnetic imaging (rs-fMRI) studies the temporally varying functional integration between brain networks. In a conventional dFNC pipeline, a clustering stage to summarize the connectivity patterns that are transiently but reliably realized over the course of a scanning session. However, identifying the right number of clusters (or states) through a conventional clustering criterion computed by running the algorithm repeatedly over a large range of cluster numbers is time-consuming and requires substantial computational power even for typical dFNC datasets, and the computational demands become prohibitive as datasets become larger and scans longer. Here we developed a new dFNC pipeline based on a two-step clustering approach to analyze large dFNC data without having access to huge computational power.

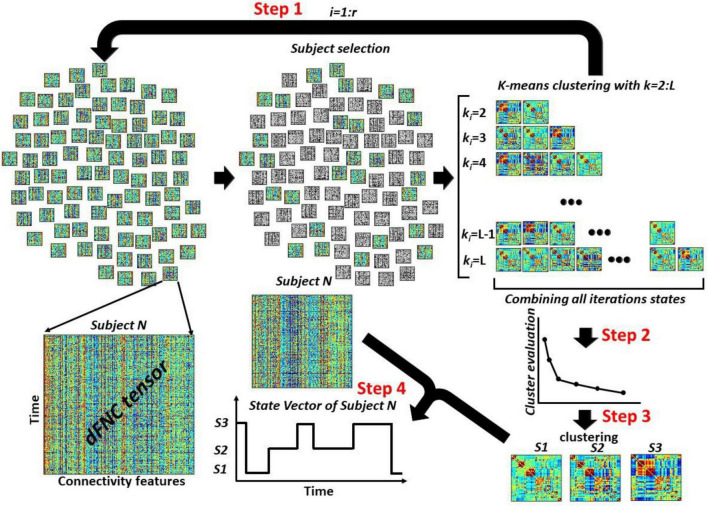
Methods: In the proposed dFNC pipeline, we implement two-step clustering. In the first step, we randomly use a sub-sample dFNC data and identify several sets of states at different model orders. In the second step, we aggregate all dFNC states estimated from all iterations in the first step and use this to identify the optimum number of clusters using the elbow criteria. Additionally, we use this new reduced dataset and estimate a final set of states by performing a second kmeans clustering on the aggregated dFNC states from the first k-means clustering. To validate the reproducibility of results in the new pipeline, we analyzed four dFNC datasets from the human connectome project (HCP).

Results: We found that both conventional and proposed dFNC pipelines generate similar brain dFNC states across all four sessions with more than 99% similarity. We found that the conventional dFNC pipeline evaluates the clustering order and finds the final dFNC state in 275 min, while this process takes only 11 min for the proposed dFNC pipeline. In other words, the new pipeline is 25 times faster than the traditional method in finding the optimum number of clusters and finding the final dFNC states. We also found that the new method results in better clustering quality than the conventional approach (p < 0.001). We show that the results are replicated across four different datasets from HCP.

Conclusion: We developed a new analytic pipeline that facilitates the analysis of large dFNC datasets without having access to a huge computational power source. We validated the reproducibility of the result across multiple datasets.

Keywords: big data; dynamic functional network connectivity; human connectome project; kmeans clustering; reproducibility.


Conflict of interest statement

The authors declare that the research was conducted in the absence of any commercial or financial relationships that could be construed as a potential conflict of interest.

Figures

FIGURE 1
FIGURE 1
The conventional dFNC pipeline. In Step 1, we estimate the independent components using group independent component analysis. In Step 2, we estimate the dFNC using sliding window. In Step 3, we concatenate all dFNCs across all participants. Then, based on elbow criteria, we estimate the cluster order. In Step 4, we use a standard kmeans clustering approach and calculate the dFNC state for group and state vector for everyone.
FIGURE 2
FIGURE 2
Extracted independent components. Fifty three independent components estimated by NeuroMark pipeline. We put them in seven domains including subcortical network (SCN), auditory network (ADN), sensorimotor network (SMN), visual sensory network (VSN), cognitive control network (CCN), default mode network (DMN), and cerebellar network (CBN).
FIGURE 3
FIGURE 3
The overview of the proposed dFNC pipeline for dFNC state estimation. In Step 1, we select a subsample of dFNC tensor and then used kmeans clustering with k-values from 2 to L and put them into (L(L+1)2-1). With r iteration, we would have r(L(L+1)2-1) clusters centroids in total. In Step 2, concatenated all cluster centroids and we use elbow criteria to find the best k-values, called Kopt hereafter. In Step 3, using another kmeans clustering approach, we estimated the final dFNC states. In Step 4, we used this final states and found the state vector for each subject.
FIGURE 4
FIGURE 4
The estimated dFNC states with the proposed and conventional pipeline for all HCP datasets. (A) We swept the L-value in the first kmeans clustering and calculated the similarity between the estimated states with new and conventional method. For any L > 5, we did not find a significant improvement in the similarity between two clustering methods. (B) Both new and conventional pipeline generated similar dFNC states in all four HCP datasets.
FIGURE 5
FIGURE 5
The clustering evaluation time with conventional and proposed method. Reducing the percentage of the data used in each iteration of the first step, reduces the evaluation time. The proposed method is 25 times faster the conventional method. The estimated states and their similarity with states estimated from whole data are shown for each percentage of data.
FIGURE 6
FIGURE 6
Both standard and the proposed dFNC pipeline generated similar dFNC features replicated across four datasets. (A) Estimated number of transitions from both standard and proposed pipeline for all HCP datasets. The similarity between the estimated number of transitions from both methods is more than 0.989. (B) Estimated occupancy rate (OCR) from both standard and proposed pipeline for all HCP datasets. The similarity between the OCR from both method is more than 0.989 (p < 0.0001, N = 833).
FIGURE 7
FIGURE 7
The comparison of the cluster quality between standard (blue) and proposed (red) approach. Each column represents that result of each session. In all comparisons, proposed dFNC pipeline had higher cluster quality (p < 0.001, N = 833). Asterisk (*) represents a significant different between the clustering quality based of old and proposed.

Similar articles

Cited by

References

    1. Alfaro-Almagro F., Jenkinson M., Bangerter N. K., Andersson J. L. R., Griffanti L., Douaud G., et al. (2018). Image processing and quality control for the first 10,000 brain imaging datasets from UK Biobank. Neuroimage 166 400–424. 10.1016/j.neuroimage.2017.10.034 - DOI - PMC - PubMed
    1. Alfaro-Almagro F., McCarthy P., Afyouni S., Andersson J. L. R., Bastiani M., Miller K. L., et al. (2021). Confound modelling in UK Biobank brain imaging. Neuroimage 224:117002. 10.1016/j.neuroimage.2020.117002 - DOI - PMC - PubMed
    1. Allen E. A., Damaraju E., Plis S. M., Erhardt E. B., Eichele T., Calhoun V. D. (2014). Tracking whole-brain connectivity dynamics in the resting state. Cereb. Cortex 24 663–676. 10.1093/cercor/bhs352 - DOI - PMC - PubMed
    1. Béjar Alonso J. (2013). K-means vs Mini Batch K-Means: A Comparison. Available online at: http://hdl.handle.net/2117/23414 (accessed May, 2013).
    1. Carbó-Carreté M., Cañete-Massé C., Peró-Cebollero M., Guàrdia-Olmos J. (2020). Using fMRI to assess brain activity in people with down syndrome: a systematic review. Front. Hum. Neurosci. 14:147. 10.3389/fnhum.2020.00147 - DOI - PMC - PubMed