

Mesenchymal Stem Cell Derived Exosomes as Nanodrug Carrier of Doxorubicin for Targeted Osteosarcoma Therapy via SDF1-CXCR4 Axis
- PMID: 35959282
- PMCID: PMC9359454
- DOI: 10.2147/IJN.S372851
Mesenchymal Stem Cell Derived Exosomes as Nanodrug Carrier of Doxorubicin for Targeted Osteosarcoma Therapy via SDF1-CXCR4 Axis
Abstract
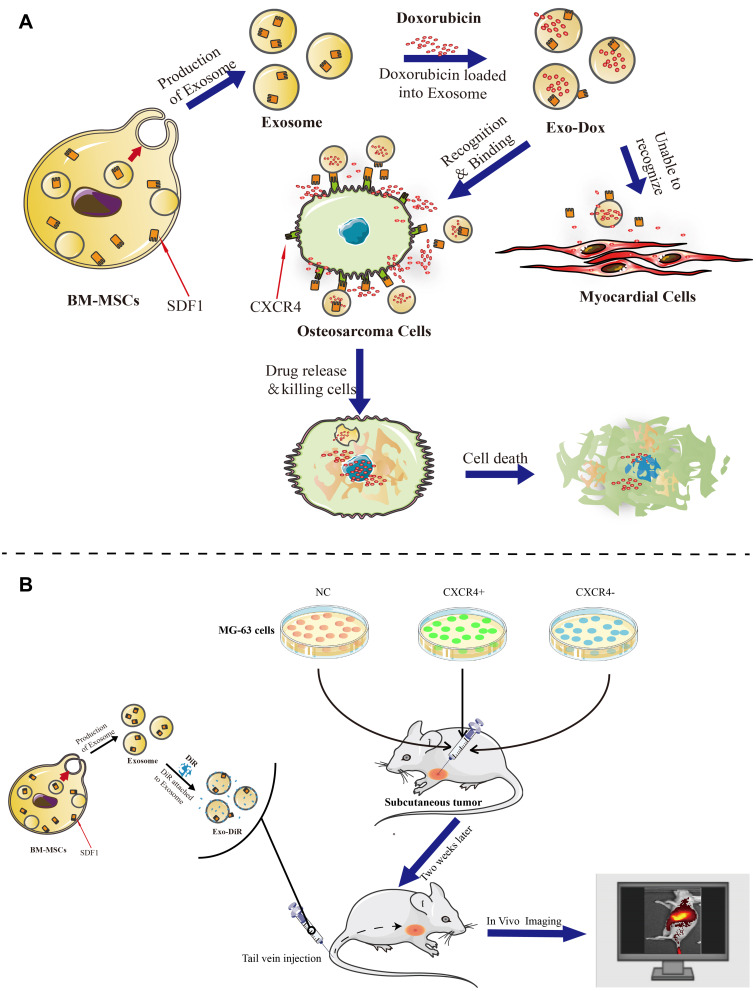
Purpose: The objective of this study was to investigate the antitumor activity, targeting capability, and mechanism of the developed nanodrug consisting of doxorubicin and exosome (Exo-Dox) derived from mesenchymal stem cells in vitro and in vivo.
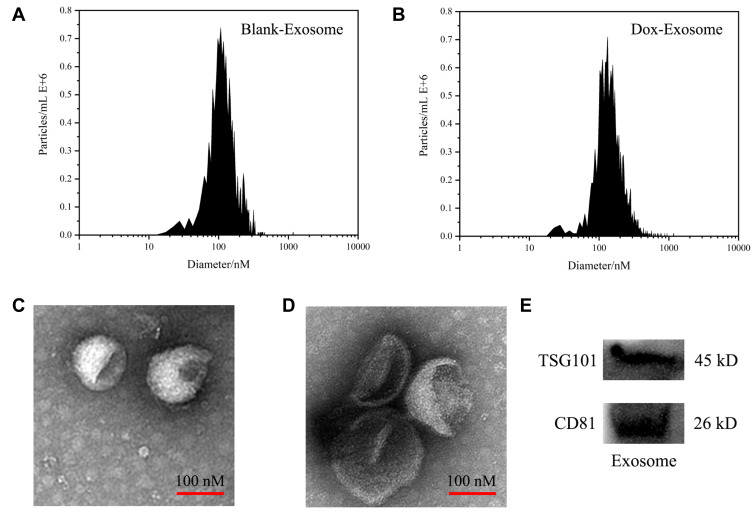
Methods: The exosomes were isolated with Exosome Isolation Kit, and the Exo-Dox was prepared by mixing exosome with Dox-HCl, desalinizing with triethylamine and then dialyzing against PBS overnight. The exosome and Exo-Dox were examined by nanoparticle tracking analysis (NTA) and transmission electron microscopy (TEM). The antitumor activity, targeting capability, and mechanism of the developed Exo-Dox were evaluated by cell viability assay, histological and immunofluorescence analysis and in vivo imaging system.
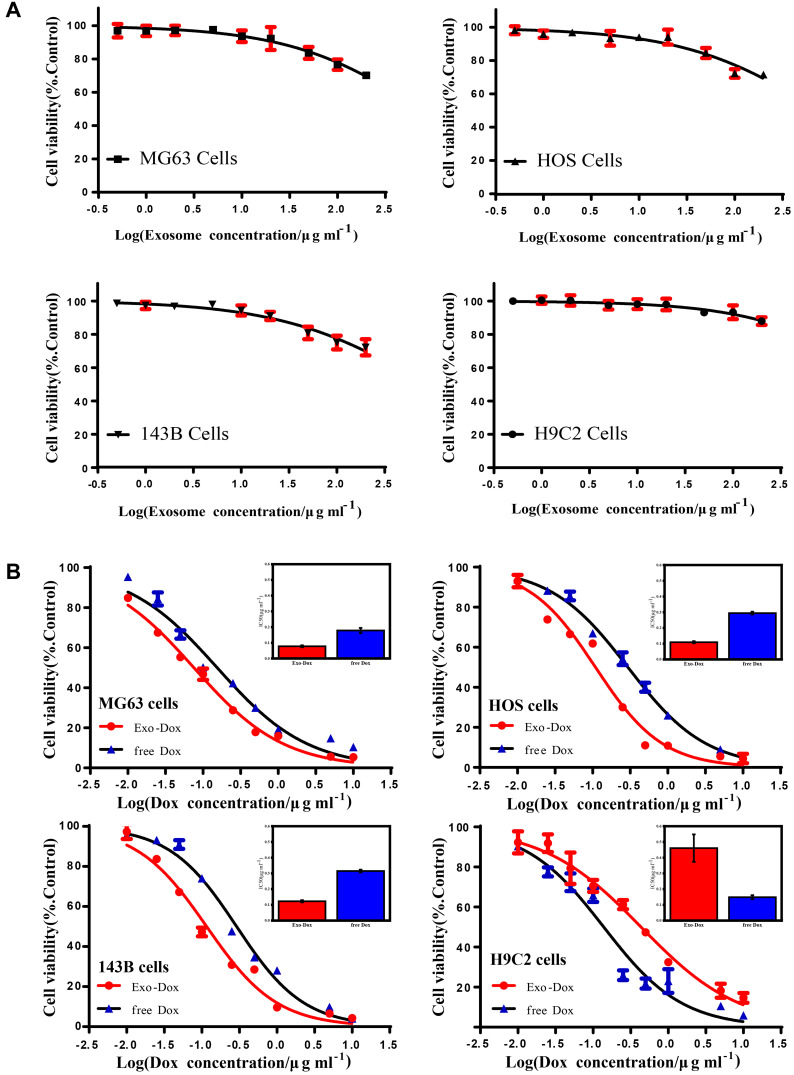
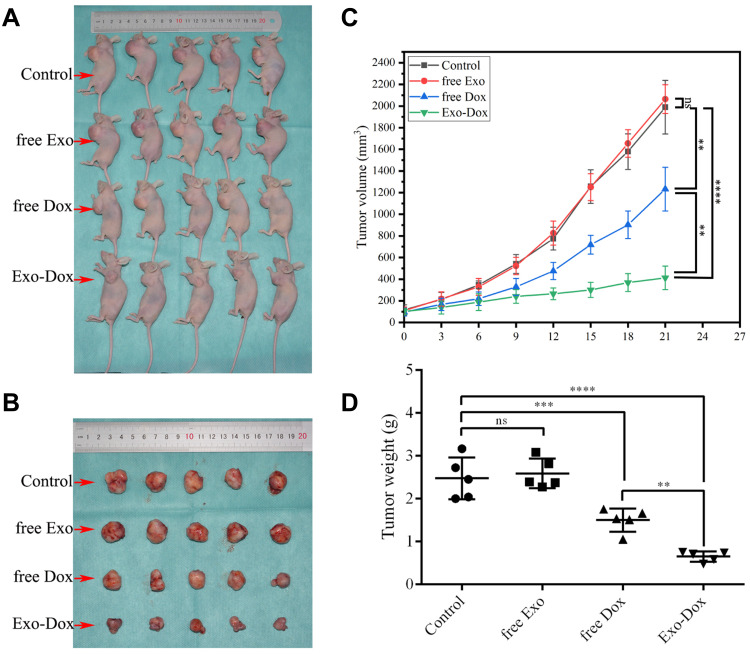
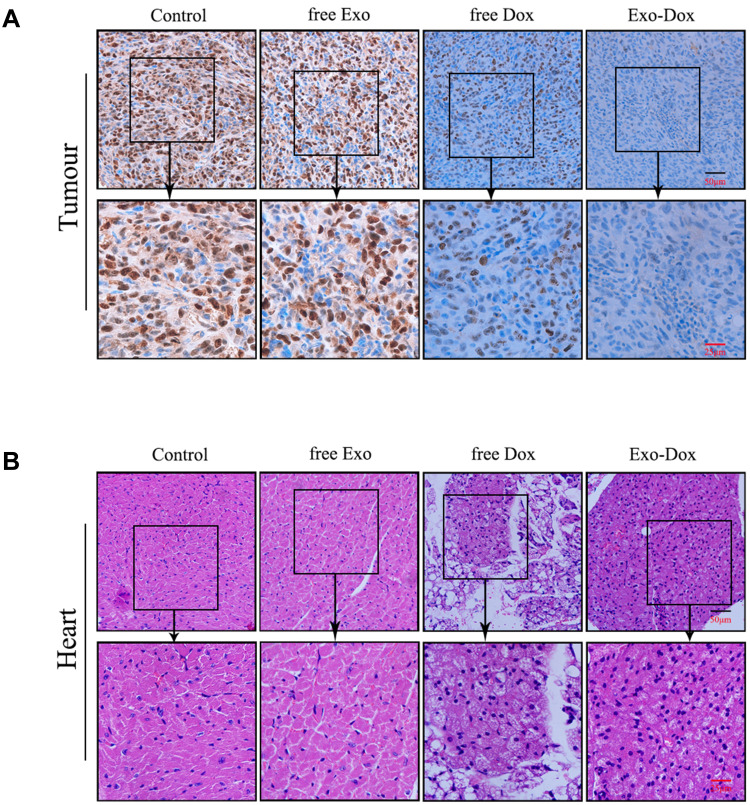
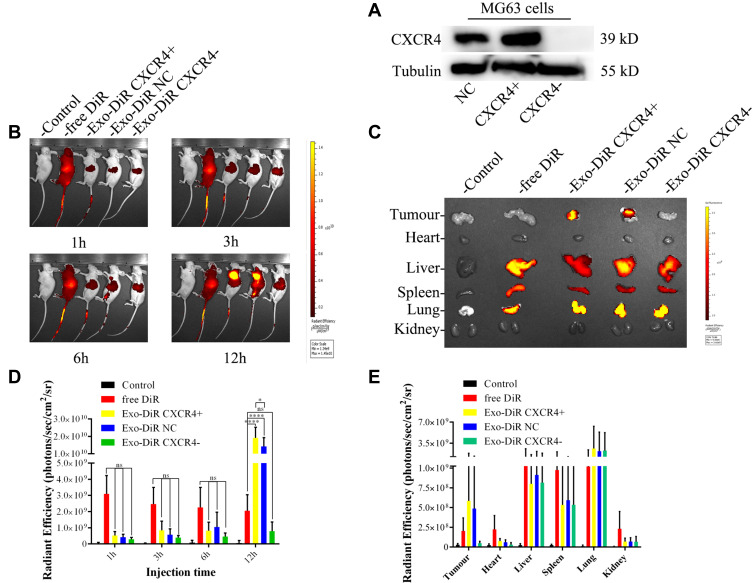
Results: NTA results showed the size of the exosomes had increased from 141.6 nm to 178.1 nm after loading with doxorubicin. Compared with free Dox, the Exo-Dox exhibited higher cytotoxicity against osteosarcoma MG63 cells, HOS cells, and 143B cells than free Dox, the half-maximal inhibitory concentrations (IC50) of Dox, Exo-Dox were calculated to be 0.178 and 0.078 μg mL-1 in MG63 cells, 0.294 and 0.109μg mL-1 in HOS cells, 0.315 and 0.123 μg mL-1 in 143B cells, respectively. The in vivo imaging showed that MSC derived Exo could serve as a highly efficient delivery vehicle for targeted drug delivery. The immunohistochemistry and histology analysis indicated that compared with the free Dox group, the Ki67-positive cells and cardiotoxicity in Exo-Dox group were significantly decreased.
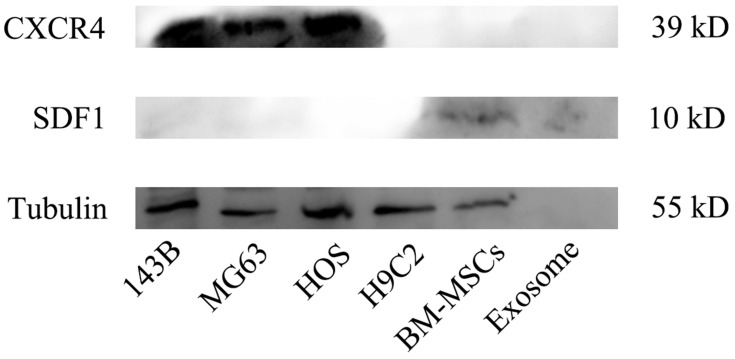
Conclusion: Our results suggested that MSC-derived Exo could be excellent nanocarriers used to deliver chemotherapeutic drug Dox specifically and efficiently in osteosarcoma, resulting in enhanced toxicity against osteosarcoma and less toxicity in heart tissue. We further demonstrated the targeting capability of Exo was due to the chemotaxis of MSC-derived exosomes to osteosarcoma cells via SDF1-CXCR4 axis.
Keywords: doxorubicin; exosome; nanocarrier; osteosarcoma; targeted therapy.
© 2022 Wei et al.
Conflict of interest statement
The authors report no conflicts of interest in this work.
Figures

Similar articles
-
A Nanodrug Consisting Of Doxorubicin And Exosome Derived From Mesenchymal Stem Cells For Osteosarcoma Treatment In Vitro.Int J Nanomedicine. 2019 Nov 1;14:8603-8610. doi: 10.2147/IJN.S218988. eCollection 2019. Int J Nanomedicine. 2019. PMID: 31802872 Free PMC article.
-
Exosome mimetics derived from bone marrow mesenchymal stem cells ablate neuroblastoma tumor in vitro and in vivo.Biomater Adv. 2022 Nov;142:213161. doi: 10.1016/j.bioadv.2022.213161. Epub 2022 Oct 17. Biomater Adv. 2022. PMID: 36308859
-
Exosome mimetics derived from bone marrow mesenchymal stem cells deliver doxorubicin to osteosarcoma in vitro and in vivo.Drug Deliv. 2022 Dec;29(1):3291-3303. doi: 10.1080/10717544.2022.2141921. Drug Deliv. 2022. PMID: 36352741 Free PMC article.
-
Osteosarcoma from the unknown to the use of exosomes as a versatile and dynamic therapeutic approach.Eur J Pharm Biopharm. 2022 Jan;170:91-111. doi: 10.1016/j.ejpb.2021.12.003. Epub 2021 Dec 10. Eur J Pharm Biopharm. 2022. PMID: 34896571 Review.
-
Mesenchymal stem cells-derived exosomes: novel carriers for nanoparticle to combat cancer.Eur J Med Res. 2023 Dec 9;28(1):579. doi: 10.1186/s40001-023-01556-y. Eur J Med Res. 2023. PMID: 38071346 Free PMC article. Review.
Cited by
-
Nanosized drug delivery strategies in osteosarcoma chemotherapy.APL Bioeng. 2023 Feb 23;7(1):011501. doi: 10.1063/5.0137026. eCollection 2023 Mar. APL Bioeng. 2023. PMID: 36845905 Free PMC article. Review.
-
Advances in cell therapy for orthopedic diseases: bridging immune modulation and regeneration.Front Immunol. 2025 Apr 10;16:1567640. doi: 10.3389/fimmu.2025.1567640. eCollection 2025. Front Immunol. 2025. PMID: 40276505 Free PMC article. Review.
-
Progress of mesenchymal stem cell-derived exosomes in targeted delivery of antitumor drugs.Cancer Cell Int. 2025 Apr 29;25(1):169. doi: 10.1186/s12935-025-03795-x. Cancer Cell Int. 2025. PMID: 40301903 Free PMC article. Review.
-
DCC-2036 inhibits osteosarcoma via targeting HCK and the PI3K/AKT-mTORC1 axis to promote autophagy.World J Surg Oncol. 2025 Apr 2;23(1):115. doi: 10.1186/s12957-025-03778-2. World J Surg Oncol. 2025. PMID: 40176057 Free PMC article.
-
Extracellular vesicles as vital players in drug delivery: a focus on clinical disease treatment.Front Bioeng Biotechnol. 2025 May 14;13:1600227. doi: 10.3389/fbioe.2025.1600227. eCollection 2025. Front Bioeng Biotechnol. 2025. PMID: 40438295 Free PMC article. Review.
References
-
- Sayles LC, Breese MR, Koehne AL, et al. Genome-informed targeted therapy for osteosarcoma. Cancer Discov. 2019;9(1):46–63. doi:10.1158/2159-8290.CD-17-1152 - DOI - PMC - PubMed
MeSH terms
Substances
LinkOut - more resources
Full Text Sources
Medical
