

Identification of Potential Biomarkers and Immune Infiltration Characteristics in Ulcerative Colitis by Combining Results from Two Machine Learning Algorithms
- PMID: 35959356
- PMCID: PMC9359832
- DOI: 10.1155/2022/5412627
Identification of Potential Biomarkers and Immune Infiltration Characteristics in Ulcerative Colitis by Combining Results from Two Machine Learning Algorithms
Abstract
Objective: This study was designed to identify potential biomarkers for ulcerative colitis (UC) and analyze the immune infiltration characteristics in UC.
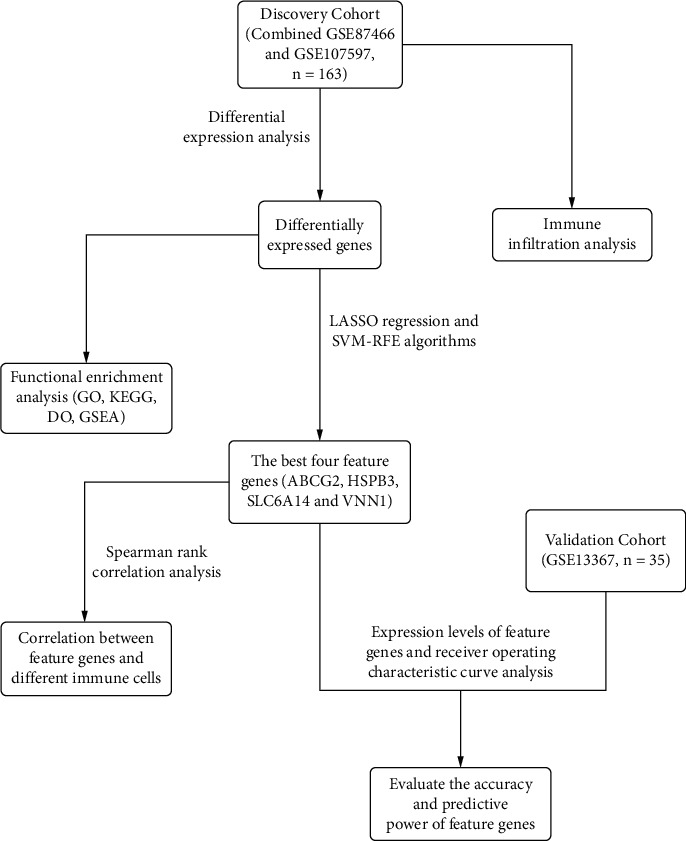
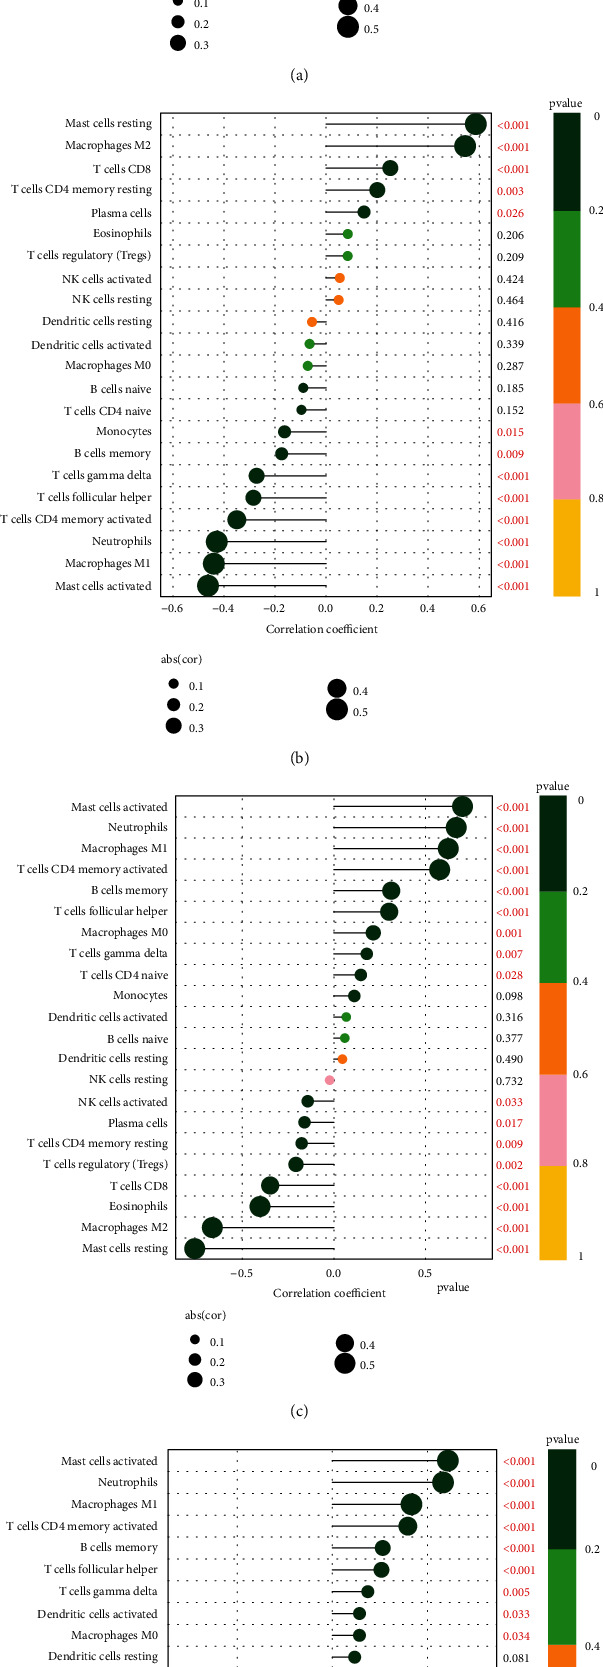
Methods: Datasets containing human UC and normal control tissues (GSE87466, GSE107597, and GSE13367) were downloaded from the GEO database. Then, the GSE87466 and GSE107597 datasets were merged, and the differentially expressed genes (DEGs) between UC and normal control tissues were screened out by the "limma R" package. The LASSO regression model and support vector machine recursive feature elimination (SVM-RFE) were performed to screen out the best biomarkers. The GSE13367 dataset was used as a validation cohort, and the receiver operating characteristic curve (ROC) was used to evaluate the diagnostic performance. Finally, the immune infiltration characteristics in UC were explored by CIBERSORT, and we further analyzed the correlation between potential biomarkers and different immune cells.
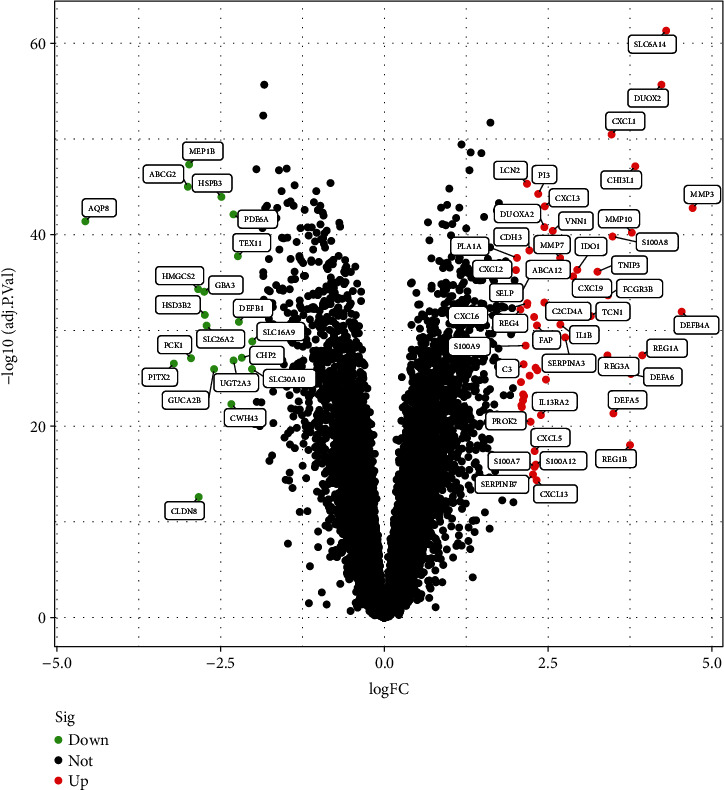
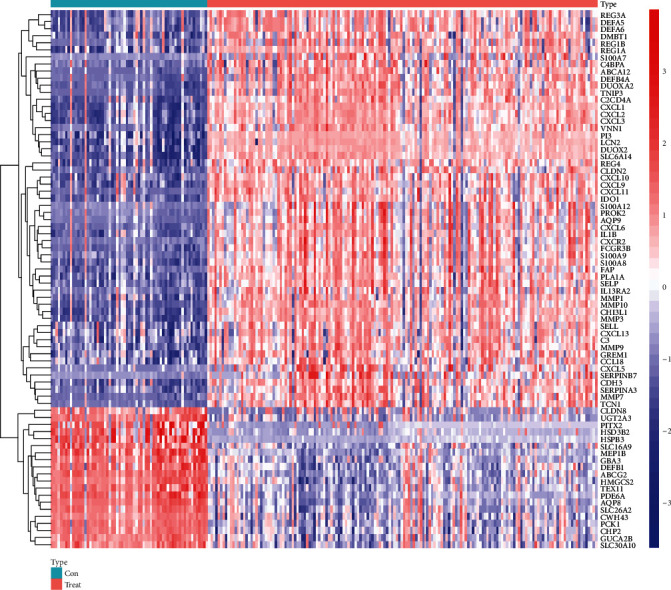
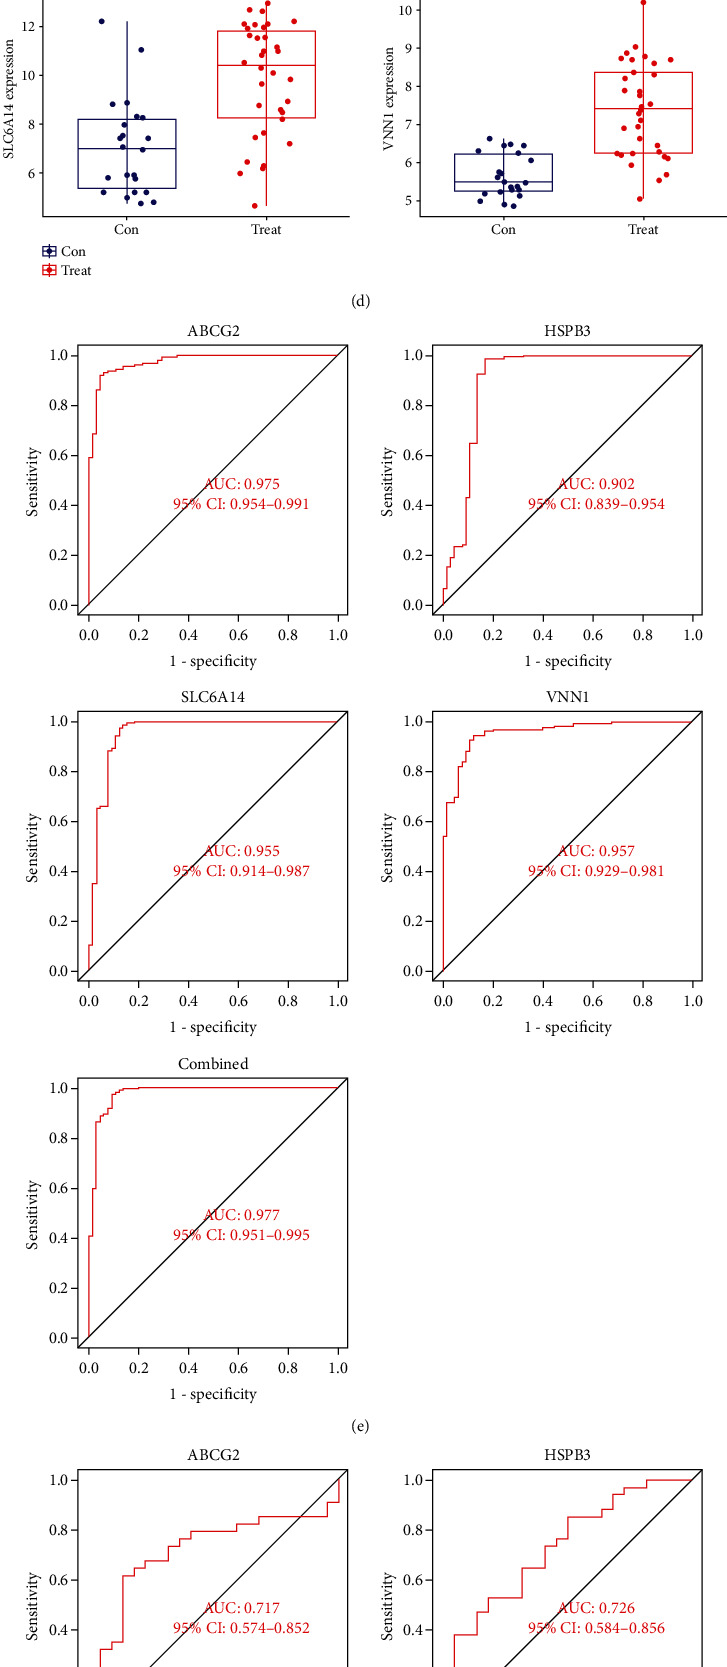
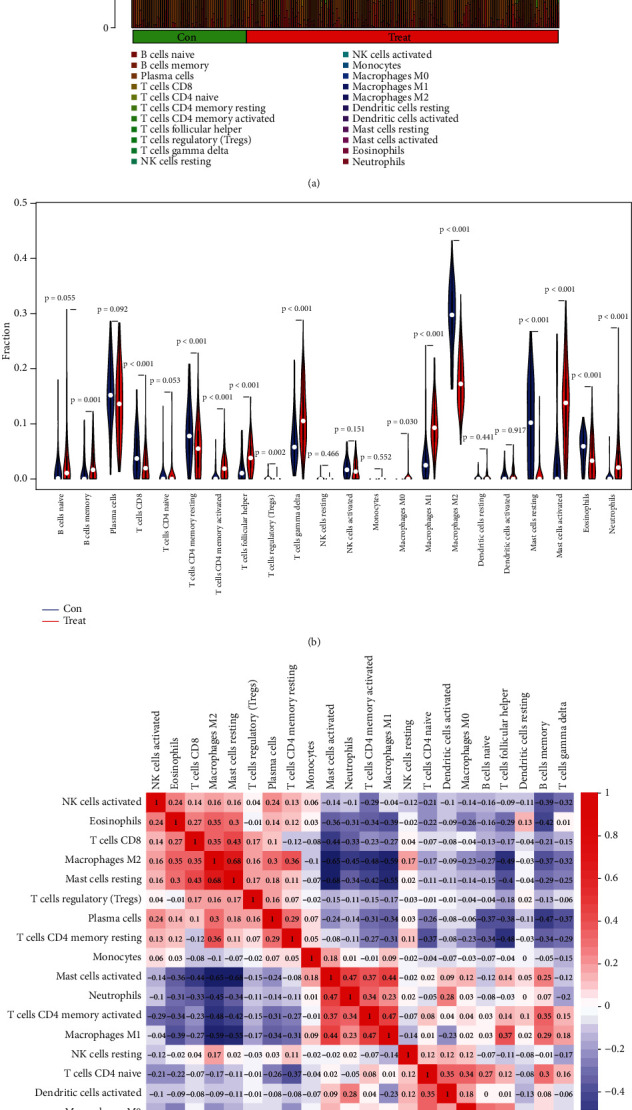
Results: A total of 76 DEGs were screened out, among which 56 genes were upregulated and 20 genes were downregulated. Functional enrichment analysis revealed that these DEGs were mainly involved in immune response, chemokine signaling, IL-17 signaling, cytokine receptor interactions, inflammatory bowel disease, etc. ABCG2, HSPB3, SLC6A14, and VNN1 were identified as potential biomarkers for UC and validated in the GSE13367 dataset (AUC = 0.889, 95% CI: 0.797~0.961). Immune infiltration analysis by CIBERSORT revealed that there were significant differences in immune infiltration characteristics between UC and normal control tissues. A high level of memory B cells, γδ T cells, activated mast cells, M1 macrophages, neutrophils, etc. were found in the UC group, while a high level of M2 type macrophages, resting mast cells, eosinophils, CD8+ T cells, etc. were found in the normal control group.
Conclusion: ABCG2, HSPB3, SLC6A14, and VNN 1 were identified as potential biomarkers for UC. There was an obvious difference in immune infiltration between UC and normal control tissues, which may provide help to guide individualized treatment and develop new research directions.
Copyright © 2022 Minchun Bu et al.
Conflict of interest statement
The authors declare that they have no competing interests.
Figures

Similar articles
-
Identifying biomarkers associated with the diagnosis of ulcerative colitis via bioinformatics and machine learning.Math Biosci Eng. 2023 Apr 17;20(6):10741-10756. doi: 10.3934/mbe.2023476. Math Biosci Eng. 2023. PMID: 37322958
-
Age-related genes affecting the immune cell infiltration in ulcerative colitis revealed by weighted correlation network analysis and machine learning.Eur Rev Med Pharmacol Sci. 2023 Sep;27(18):8447-8462. doi: 10.26355/eurrev_202309_33768. Eur Rev Med Pharmacol Sci. 2023. PMID: 37782162
-
SLC6A14 as a Key Diagnostic Biomarker for Ulcerative Colitis: An Integrative Bioinformatics and Machine Learning Approach.Biochem Genet. 2025 Jan 13. doi: 10.1007/s10528-025-11027-0. Online ahead of print. Biochem Genet. 2025. PMID: 39806040
-
Unveiling the key genes, environmental toxins, and drug exposures in modulating the severity of ulcerative colitis: a comprehensive analysis.Front Immunol. 2023 Jul 19;14:1162458. doi: 10.3389/fimmu.2023.1162458. eCollection 2023. Front Immunol. 2023. PMID: 37539055 Free PMC article. Review.
-
Comprehensive analysis reveals key genes and environmental toxin exposures underlying treatment response in ulcerative colitis based on in-silico analysis and Mendelian randomization.Aging (Albany NY). 2023 Dec 4;15(23):14141-14171. doi: 10.18632/aging.205294. Epub 2023 Dec 4. Aging (Albany NY). 2023. PMID: 38059894 Free PMC article. Review.
Cited by
-
Advances in Inflammatory Bowel Disease Diagnostics: Machine Learning and Genomic Profiling Reveal Key Biomarkers for Early Detection.Diagnostics (Basel). 2024 Jun 4;14(11):1182. doi: 10.3390/diagnostics14111182. Diagnostics (Basel). 2024. PMID: 38893707 Free PMC article.
-
Bioinformatics Analysis of Immune Cell Infiltration and Diagnostic Biomarkers between Ankylosing Spondylitis and Inflammatory Bowel Disease.Comput Math Methods Med. 2023 Jan 5;2023:9065561. doi: 10.1155/2023/9065561. eCollection 2023. Comput Math Methods Med. 2023. PMID: 36643579 Free PMC article.
-
Artificial intelligence use for precision medicine in inflammatory bowel disease: a systematic review.Am J Transl Res. 2025 Jan 15;17(1):28-46. doi: 10.62347/XILL3707. eCollection 2025. Am J Transl Res. 2025. PMID: 39959235 Free PMC article. Review.
References
MeSH terms
Substances
LinkOut - more resources
Full Text Sources
Medical
Research Materials
Miscellaneous
