. 2022 Mar;1(3):263-280.
doi: 10.1038/s44161-022-00028-6. Epub 2022 Mar 16.

Single-cell transcriptomics reveals cell-type-specific diversification in human heart failure

Affiliations

Single-cell transcriptomics reveals cell-type-specific diversification in human heart failure

Andrew L Koenig et al. Nat Cardiovasc Res. 2022 Mar.

Abstract

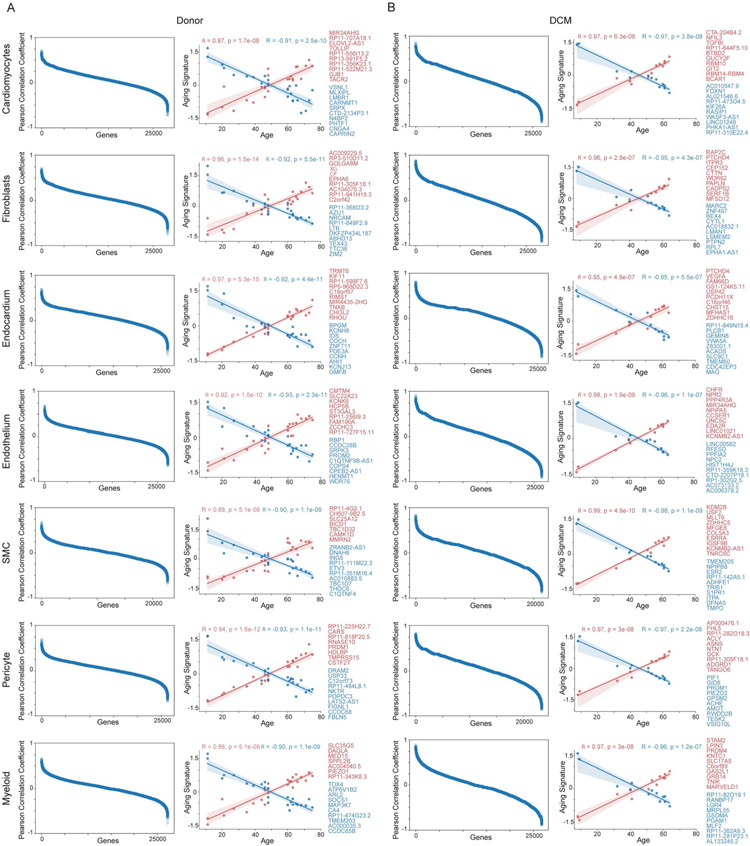
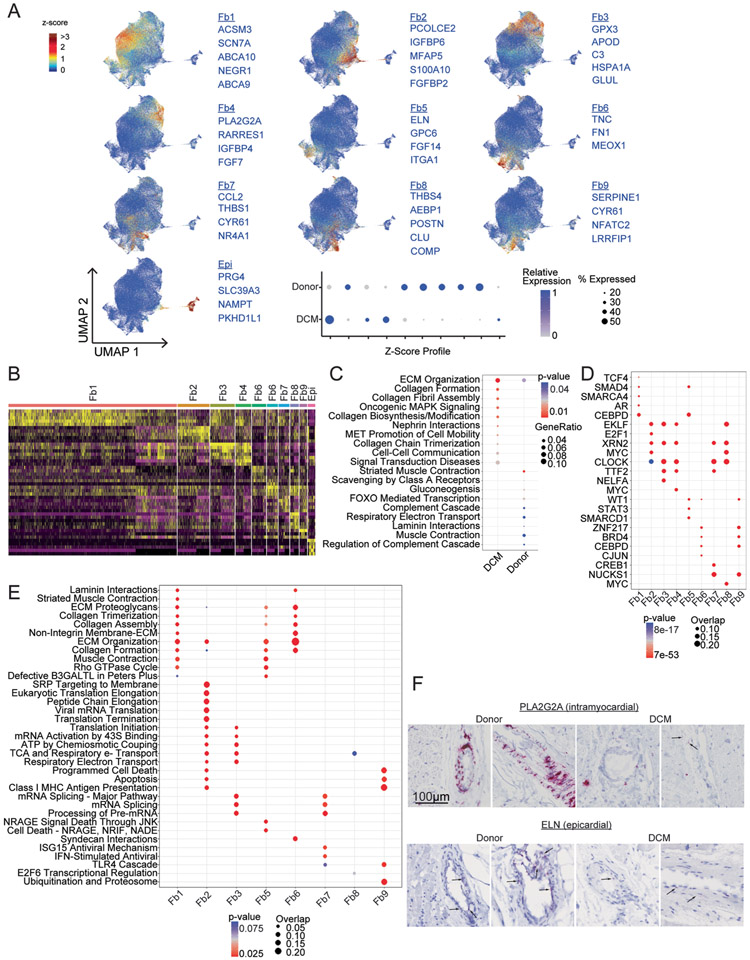
Heart failure represents a major cause of morbidity and mortality worldwide. Single-cell transcriptomics have revolutionized our understanding of cell composition and associated gene expression. Through integrated analysis of single-cell and single-nucleus RNA-sequencing data generated from 27 healthy donors and 18 individuals with dilated cardiomyopathy, here we define the cell composition of the healthy and failing human heart. We identify cell-specific transcriptional signatures associated with age and heart failure and reveal the emergence of disease-associated cell states. Notably, cardiomyocytes converge toward common disease-associated cell states, whereas fibroblasts and myeloid cells undergo dramatic diversification. Endothelial cells and pericytes display global transcriptional shifts without changes in cell complexity. Collectively, our findings provide a comprehensive analysis of the cellular and transcriptomic landscape of human heart failure, identify cell type-specific transcriptional programs and disease-associated cell states and establish a valuable resource for the investigation of human heart failure.


Figures

Extended Data Fig. 1 ∣
Extended Data Fig. 1 ∣. Sample processing and QC Plots.
A, Diagram of tissue processing and flow cytometry cell sorting strategies for single cell RNA sequencing (top) and single-nucleus RNA sequencing (bottom). Plots are representative density plots (blue indicates low density while yellow indicates higher density. B, Violin plots of the number of genes per cell/nuclei split by sequencing technology for the integrated Seurat object before and after QC filtering (left) and after QC filtering split by cell type (right). C, Violin plots of the percent mitochondrial reads per cell/nuclei split by sequencing technology for the integrated Seurat object before and after QC filtering (left) and after QC filtering split by cell type (right).
Extended Data Fig. 2 ∣
Extended Data Fig. 2 ∣. Integration of single cell RNA sequencing and single-nucleus RNA sequencing data allows for combined analysis of samples from different technologies.
A, UMAP projection showing unsupervised clustering of the integrated dataset. B, UMAP projection split by technology. C, UMAP projection colored by disease state. D, Heat map of the top 10 genes by log2FC enriched in each cluster. E, Z-score feature plots for transcriptional signatures enriched in each cell type. Genes used for cell type identification (blue) were selected based on enrichment from Seurat differential expression analysis.
Extended Data Fig. 3 ∣
Extended Data Fig. 3 ∣. Single-cell and nucleus RNA sequencing identifies major cell populations within the LV myocardium.
A, UMAP projection showing unsupervised clustering of single-nucleus RNA sequencing data. B, Heatmap of the top 10 genes by log2FC enriched in each cluster within single-nucleus RNA sequencing dataset. C, UMAP projection showing unsupervised clustering of single cell RNA sequencing data. D, Heatmap of the top 10 genes by log2FC enriched in each cluster within single cell RNA sequencing dataset. E-F, Violin plots split by cluster displaying the expression of characteristic cell marker genes in the single-nucleus RNA sequencing (E) and single cell RNA sequencing (F) datasets.
Extended Data Fig. 4 ∣
Extended Data Fig. 4 ∣. Pseudobulk differential expression reveals the contribution of disease state, sex and disease severity across major cell types.
A, Volcano plots of pseudobulk differential expression analysis of single-nucleus RNA sequencing data performed on each cell type comparing donor control vs. dilated cardiomyopathy (DCM). B, Volcano plots of pseudobulk differential expression analysis of single nucleus RNA sequencing data performed on each cell type comparing disease severity (INTERMACS score 3+4 vs 1+2, lower score indicates more advance disease). C-D, Volcano plots of pseudobulk differential expression analysis of single nucleus RNA sequencing data performed on each cell type comparing sex separated by donor (C) and DCM (D). Insets represent values outside of the plotted area. See Supplementary Tables 21-26 for complete list of genes.
Extended Data Fig. 5 ∣
Extended Data Fig. 5 ∣. Pseudobulk differential expression reveals gene expression correlation with age in donor and diseased hearts.
A-B, Plot of genes versus Pearson correlation coefficient (left) and linear regression using the top 10 genes correlated with age ranked by Pearson coefficient. Line of best fit is displayed (red-positively correlated, blue-negatively correlated, genes listed in respective colors, points represent individual samples, p-values calculated using 2-tailed linear regression Wald test with t-distribution, shaded areas represent 95% confidence interval, Donor; n=25, DCM; n=13) for donor (A) and DCM (B). Pearson Coefficients were calculated for all expressed genes from single nucleus dataset in relation to age as a continuous variable. See Supplementary Tables 25-26 for complete list of genes.
Extended Data Fig. 6 ∣
Extended Data Fig. 6 ∣. Supplement to Fig. 3 – Cardiomyocytes.
A, Z-score feature plots for transcriptional signatures enriched in each cardiomyocyte state. Genes used for cell type identification (blue) were selected based on enrichment from Seurat differential expression analysis. Dot plot displays relative expression values for each Z-score split by disease state. B, Heatmap displaying top 5 enriched genes in each cell state from Seurat differential expression analysis on integrated dataset. C, enrichPathways analysis identifies pathways top differentially enriched pathways by cell state. Genes used in the analysis were selected from Seurat differential expression analyses with adjusted p<0.05. p-value calculated using hypergeometric distribution and corrected for multiple comparisons. D, enrichPathway analysis comparing enrichment of top pathways between disease states. Genes used in the analysis selected from intersection of pseudobulk and Seurat differential expression with p<0.05 and log2FC>0.1. p-value calculated using hypergeometric distribution and corrected for multiple comparisons. E, Transcription factor analysis displaying top enriched transcription factors in each cell state using ChEA 2016 database (https://maayanlab.doud/Enrichr). Genes used in the analysis selected from Seurat differential expression with p<0.05 and log2FC>0.1. p-value calculated using Fisher exact test. F, Palantir pseudotime and entropy values overlaid on UMAP projection split by disease state.
Extended Data Fig. 7 ∣
Extended Data Fig. 7 ∣. Supplement to Figs. 4 and 5 – Monocytes, macrophages and dendritic cells.
A, Z-score feature plots for transcriptional signatures enriched in each monocytes, macrophages, and dendritic cells state. Genes used for cell type identification (blue) were selected based on enrichment from Seurat differential expression analysis from single cell dataset (from Fig. 5). Z-scores are overlaid on the single cell RNA sequencing (left) and integrated UMAP (right) projections. B, Heatmap displaying top 5 enriched genes in each cell state from Seurat differential expression analysis on integrated dataset. C, Heatmap displaying top 5 enriched genes in each cell state from Seurat differential expression analysis on single cell dataset.
Extended Data Fig. 8 ∣
Extended Data Fig. 8 ∣. Supplement to Fig. 6 – Fibroblasts.
A, Z-score feature plots for transcriptional signatures enriched in each fibroblast state. Genes used for cell type identification (blue) were selected based on enrichment from Seurat differential expression analysis. Z-scores are overlaid on the integrated UMAP projections. Dot plot displays relative expression values for each Z-score split by disease state. B, Heatmap displaying top 5 enriched genes in each cell state from Seurat differential expression analysis on integrated dataset. C, WikiPathways analysis identifies pathways differentially enriched by disease state. Genes used in the analysis included the intersection of pseudobulk and Seurat differential expression analyses with adjusted p<0.05. p-value calculated using hypergeometric distribution and corrected for multiple comparisons. D, Transcription factor analysis displaying top enriched transcription factors in each cell state using ChEA 2016 database (https://maayanlab.cloud/Enrichr). Genes used in the analysis selected from Seurat differential expression with p<0.05 and log2FC>0.1. p-value calculated using Fisher exact test. E, enrichPathway analysis comparing enrichment of pathways between cell states. Genes used in the analysis selected from Seurat differential expression with p<0.05 and log2FC>0.1. p-value calculated using hypergeometric distribution and corrected for multiple comparisons. F, RNA in situ hybridization for PLA2G2A and ELN (red). Representative images showing perivascular staining of PLA2G2A in the myocardium of donor samples. Minimal staining was observed in DCM samples. ELN staining was observed in the media of epicardial coronary arteries in both donor and DCM samples.
Extended Data Fig. 9 ∣
Extended Data Fig. 9 ∣. Pericytes and smooth muscle cells exhibit global changes in gene expression in dilated cardiomyopathy.
A, Unsupervised clustering of pericytes and fibroblasts within the integrated dataset split by disease state. Inset panel (right) colored by disease state demonstrates mixing within cell states. B, Heatmap displaying top 5 enriched genes in each cell population from Seurat differential expression analysis on integrated dataset. C-D, Principal-component analysis (PCA, DESeq2) plots of pericyte (C) and smooth muscle cell (D) pseudobulk single nucleus RNA sequencing data colored by sex and disease state and age. Each data point represents an individual subject. Heatmaps displaying the top 100 upregulated and downregulated genes ranked by log2 fold-change comparing donor control to dilated cardiomyopathy (DCM). Differentially expressed genes were derived from the intersection of pseudobulk (DESeq2) and single cell (Seurat) analyses. E, WikiPathways analysis identifies top differentially enriched pathways in pericytes (top) and smooth muscle cells (bottom) by disease state. No pathway enrichment was detected in DCM pericytes. Genes used in the analysis included the intersection of pseudobulk and Seurat differential expression analyses with adjusted p<0.05 and log2FC>0.1. p-value calculated using hypergeometric distribution and corrected for multiple comparisons. F, Representative images of RGS5 staining for pericytes by RNA in situ hybridization.
Extended Data Fig. 10 ∣
Extended Data Fig. 10 ∣. Supplement to Fig. 7 – Endothelial cells.
A, UMAP projection of the integrated dataset split by technology (single cell vs. single nucleus RNA sequencing) and colored by subpopulation. B, Distribution of nuclei in the integrated object divided by major cell type (*<0.05, **<0.01, ***<0.001 by Welch’s T-test, two-tailed, data represents mean ± standard deviation, Donor; n=25 samples, DCM; n=13 samples). p-values for clusters comparing Donor to DCM are; Ec1:1.9e-1, Ec2: 3.0e-1, Ec3: 1.5e-3, Ec4: 1.1e-1, Ecd1: 3.3e-5, Ecd2: 6.7e-3. C, Z-score feature plots for transcriptional signatures enriched in endothelial and endocardial cell populations. Genes used for cell type identification (blue) were selected based on enrichment from Seurat differential expression analysis. Z-scores are overlaid on the integrated dataset. D, Dot plot of relative expression values for each Z-score split by disease state. E, Heatmap displaying top 5 enriched genes in each cell state from Seurat differential expression analysis on integrated dataset. F. Transcription factor analysis displaying top enriched transcription factors in each cell state using ChEA 2016 database (https://maayanlab.cloud/Enrichr). p-value calculated using Fisher exact test. Genes used in the analysis selected from Seurat differential expression with p<0.05 and log2FC>0.1. G, Representative RNAScope images of vascular (top) and lymphatic (bottom) endothelial cells. ACKR1 – venous, BTNL9 – capillary, CCL21 – lymphatic.
Fig. 1 ∣
Fig. 1 ∣. Cellular composition of the healthy and failing human heart.
a, Schematic depicting design of the snRNA-seq and scRNA-seq experiments. Transmural sections were obtained from the apical anterior wall of the left ventricle during donor heart procurement, LVAD implantation or heart transplantation for comparison of disease, sex and age (snRNA-seq, n = 25 donor control, n = 13 dilated cardiomyopathy; scRNA-seq, n = 2 donor control, n = 5 dilated cardiomyopathy). Dashed box indicates location where sample was collected. LVAD, left ventricular assist device. b, The analysis pipeline included tissue processing and single-cell barcoded library generation (10X Genomics 5′ v1 kit), sequence alignment (Cell Ranger) and further analysis using R and Python packages (Seurat, Harmony, DEseq2, Palantir, ClusterProfiler and Enrichr). c, Unsupervised Uniform Manifold Approximation and Projection (UMAP) clustering of 220,752 nuclei, 49,723 cells and an integrated dataset combining snRNA-seq and scRNA-seq data after QC and data filtering using Harmony integration. d, Violin plots generated from the integrated dataset displaying characteristic marker genes of each identified cell population. e, Pie chart showing the proportion of cells within the snRNA-seq, scRNA-seq and integrated datasets.
Fig. 2 ∣
Fig. 2 ∣. Differential influence of disease state, sex and age on cell type-specific gene expression.
ac, Dot plots showing pseudobulk (DESeq2) based differential gene expression across major cell populations. Differential expression was calculated from snRNA-seq data for disease (a, Donor versus DCM), INTERMACS score (b, 1 and 2 versus 3 and 4) and sex (c, male versus female) are shown. d, Genes correlated with age by Pearson coefficient are also shown. Genes with adjusted P value <0.05 are colored in red and genes with adjusted P value >0.05 are colored in gray (P value calculated using Wald test adjusted for multiple test correction). Number of upregulated and downregulated genes with adjusted P value <0.05 per cell type is displayed in parenthesis. Supplementary Tables 21-26 contain a complete list of genes.
Fig. 3 ∣
Fig. 3 ∣. Acquisition of disease-associated cardiomyocyte states in dilated cardiomyopathy.
a, PCA, DESeq2 plots of cardiomyocyte pseudobulk snRNA-seq data colored by sex and disease state (left) and age (right). Each data point represents an individual. b, Heat map displaying the top 100 upregulated and downregulated genes ranked by log2 fold-change comparing donor control to DCM. DEGs were derived from the intersection of pseudobulk (DESeq2) and single-cell (Seurat) analyses. c, Unsupervised re-clustering of donor and DCM cardiomyocytes within the integrated dataset split by disease state. Major cardiomyocyte states are labeled. Inset (right) colored by disease state demonstrates mixing within cell states. d, Dot plot displaying z scores for transcriptional signatures that distinguish cardiomyocyte states (genes selected by enrichment in Seurat differential expression analysis, listed in box below plot). e, Distribution of cardiomyocyte states by cluster (*P < 0.05, **P < 0.01, ***P < 0.001, Welch’s t-test, two-tailed, data represents mean ± s.d., donor; n = 25 samples, DCM; n = 13 samples). P values for clusters comparing donor to DCM are Cm1: 3.8 × 10⁻⁴; Cm2, 1.8 × 10⁻¹; Cm3, 3.2 × 10⁻¹; Cm4, 8.1 × 10⁻³; Cm5, 5.4 × 10⁻²; Cm6, 1.1 × 10⁻¹; Cm7, 1.1 × 10⁻¹. f, Violin plots of MYH6, ANKRD1, NPPA and ADGRL3 expression in donor control and DCM cardiomyocytes. g, Quantification of the number of cardiomyocytes expressing ANKRD1, MYH6, NPPA and NPPB mRNA in donor control and DCM samples (P value from Welch’s t-test, two-tailed, data represents mean ± s.d. For ANKRD1, donor; n = 6 samples, DCM; n = 6 samples. For MYH6, NPPA and NPPB, donor; n = 4 samples, DCM; n = 4 samples). h, Representative RNA in situ hybridization images (RNAScope) of indicated genes. i, Palantir pseudotime trajectory analysis of cardiomyocytes showing entropy and pseudotime scores overlaid on the UMAP projection (left). Entropy versus pseudotime plots of donor and DCM cardiomyocytes identifying differing trajectories of healthy and disease-associated cardiomyocyte states (right).
Fig. 4 ∣
Fig. 4 ∣. Dilated cardiomyopathy is associated with shifts in macrophage composition and gene expression favoring inflammatory populations.
a, PCA, DESeq2 plots of monocyte, macrophage and dendritic cell pseudobulk snRNA-seq data colored by sex and disease state (left) and age (right). Each data point represents an individual. b, Heat map displaying the top 100 upregulated and downregulated genes ranked by log2 fold-change comparing donor control to DCM. DEGs were derived from the intersection of pseudobulk (DESeq2) and single-cell (Seurat) analyses. c, WikiPathways analysis comparing top enriched pathways in each condition. Genes were selected from the intersection of pseudobulk (DESeq2) and single-cell (Seurat) analyses with P < 0.05 and log2FC >0.1. P value calculated using hypergeometric distribution and corrected for multiple comparisons. d, UMAP of unsupervised re-clustering of monocytes, macrophages and dendritic cells within the Harmony integrated dataset split by disease state. Major cell states are labeled. Inset (right) colored by disease state demonstrates mixing within cell states. e, Z score feature plot of the two macrophage populations identified split by disease state (left, Mac1; right, Mac2). Genes (in blue) were selected by enrichment in the respective populations. f,g, Dot plots displaying the z scores for transcriptional signatures that distinguish monocyte, macrophage and dendritic cell populations by cell state (f) and split by disease state (g) (genes selected by enrichment in Seurat differential expression analysis are listed in box below plot). h, Distribution of myeloid states by cluster (*P < 0.05, ***P < 0.001, Welch’s t-test, two-tailed, data represents mean ± s.d., derived from single-nucleus data, donor; n = 25 samples, DCM; n = 13 samples). P values for clusters comparing donor to DCM are Mac1, 2.7 × 10⁻¹; Mac2, 5.4 × 10⁻¹; DCs, 2.6 × 10⁻²; Prolif, 9.0 × 10⁻⁴; Mono, 3.4 × 10⁻². i, Representative RNA in situ hybridization images (RNAScope) for CD163 (red and blue, hematoxylin) and quantification of CD163+ cells in donor and DCM samples (P value from Welch’s t-test, two-tailed, data represents mean ± s.d., donor; n = 6 samples, DCM; n = 6 samples). CD163 is a marker of tissue-resident macrophages. j, UMAP plot of clusters split by sequencing technology. k, Distribution of myeloid states by cluster Welch’s t-test, two-tailed, data represents mean ± s.d., derived from only single-cell data, donor; n = 2 samples, DCM; n = 5 samples). P values for clusters comparing donor to DCM are Mac1, 2.1 × 10⁻¹; Mac2, 6.6 × 10⁻²; DCs, 6.6 × 10⁻²; Prolif, 5.1 × 10⁻¹; Mono, 1.5 × 10⁻¹.
Fig. 5 ∣
Fig. 5 ∣. Dilated cardiomyopathy is associated with the emergence of inflammatory monocyte-derived populations.
a, UMAP projection of unsupervised re-clustering of myeloid cells from the scRNA-seq dataset. Major cell states are labeled. Inset (right) colored by disease state demonstrates mixing within cell states. b, Dot plot displaying the z scores for transcriptional signatures that distinguish each monocyte, macrophage and dendritic cell state by cell state (above) and disease state (below) (genes selected by enrichment in Seurat differential expression analysis, listed in box below plot). c, Z score feature plot overlaying an inflammatory gene expression signature (genes in blue) on the scRNA-seq UMAP projection split by disease state. d,e, Palantir pseudotime trajectory analysis of myeloid scRNA-seq data. Entropy and pseudotime overlayed on UMAP projection split by disease state (d) and entropy versus pseudotime plots split by disease state identify major cell trajectories (nonclassical monocytes, resident macrophages and dendritic cells). Inflammatory cell states that emerge in DCM have high entropy and low pseudotime values, suggesting an intermediate state of differentiation. f, Transcription factor analysis for genes upregulated in inflammatory macrophage states (Mac1, Mac4 and Mac5) using ChEA 2016 database (https://maayanlab.cloud/Enrichr). Genes used in the analysis selected from Seurat differential expression with P < 0.05 and log2FC>0.1. P value calculated using Fisher’s exact test. g, enrichPathway analysis displaying the top five enriched pathways in each cell state. Genes used in the analysis selected from Seurat differential expression with P < 0.05 and log2FC > 0.1. P value calculated using hypergeometric distribution and corrected for multiple comparisons.
Fig. 6 ∣
Fig. 6 ∣. Phenotypic shifts and emergence of disease-associated fibroblasts in dilated cardiomyopathy.
a, PCA, DESeq2 plots of fibroblast pseudobulk snRNA-seq data colored by sex and disease state (left) and age (right). Each data point represents an individual. b, Heat map displaying the top 100 upregulated and downregulated genes ranked by log2 fold-change comparing donor control to DCM. DEGs were derived from the intersection of pseudobulk (DESeq2) and single-cell (Seurat) analyses. c, Unsupervised re-clustering of donor and DCM fibroblasts and epicardium within the integrated dataset split by disease state. Major fibroblast states are labeled. Inset (right) colored by disease state demonstrates mixing within cell states. d, Distribution of fibroblast states by cluster (*P < 0.05, **P < 0.01, ***P < 0.01, Welch’s t-test, two-tailed, data represents mean ± s.d., donor; n = 25 samples, DCM; n = 13 samples). P values for clusters comparing donor to DCM are Fb1, 8.3 × 10⁻¹; Fb2, 3.0 × 10⁻¹; Fb3, 4.2 × 10⁻⁴; Fb4, 5.1 × 10⁻³, Fb5; 5.9 × 10⁻²; Fb6, 2.6 × 10⁻¹; Fb7, 5.3 × 10⁻¹; Fb8, 7.5 × 10⁻³; Fb9, 4.0 × 10⁻¹; Epi, 9.1 × 10⁻¹. e, Dot plot displaying the z scores for transcriptional signatures that distinguish fibroblast states (genes selected by enrichment in Seurat differential expression analysis, listed in box below plot). f, Z score feature plot of transcriptional signatures associated with DCM (top) and with donor (bottom) fibroblast states. Plot is split by disease state. DCM fibroblasts are enriched in genes associated with activation. Enriched genes (blue) were defined using Seurat differential gene expression analysis. g, Palantir pseudotime trajectory analysis of integrated fibroblast RNA-seq data. Entropy and pseudotime overlayed on UMAP projection split by disease state. h, Representative RNA in situ hybridization images (RNAScope) of indicated genes (red) counterstained with hematoxylin (blue). i, Quantification of the number of cells expressing DCN, POSTN, PLA2G2A, CCL2 and PCOLCE2 mRNA in donor control and DCM samples (P value from Welch’s t-test, two-tailed, data represent mean ± s.d., donor; n = 6 samples, DCM; n = 6 samples).
Fig. 7 ∣
Fig. 7 ∣. Endothelial cells exhibit global gene expression shifts in dilated cardiomyopathy.
a, PCA, DESeq2 plots of vascular endothelial cell pseudobulk snRNA-seq data colored by sex and disease state (left) and age (right). Each data point represents an individual. b, Heat map displaying the top 100 upregulated and downregulated genes ranked by log2 fold-change comparing donor control to DCM. DEGs were derived from the intersection of pseudobulk (DESeq2) and single-cell (Seurat) analyses. c, Unsupervised re-clustering of donor and DCM endothelial and endocardial cells within the integrated dataset split by disease state. Major endothelial states are labeled. Inset (right) colored by disease state demonstrates mixing within cell states. d, Dot plot displaying z scores for transcriptional signatures that distinguish endothelial cell populations (genes selected by enrichment in Seurat differential expression analysis, genes listed in the box to right of plot). e, Bar graph of the number of DEGs per endothelial population (intersection of DESeq2 and Seurat differential expression analyses with adjusted P < 0.05 (Wilcoxon rank-sum), log2FC > 0.1). f, WikiPathways analysis identifying top differentially enriched pathways in donor and DCM capillary endothelial cells. Genes used in the analysis selected from intersection of pseudobulk and Seurat differential expression with P < 0.05 and log2FC > 0.1. P value calculated using hypergeometric distribution and corrected for multiple comparisons. g, WikiPathways analysis identifying top differentially enriched pathways in donor and DCM venous endothelial cells. Genes used in the analysis selected from intersection of pseudobulk and Seurat differential expression with P < 0.05 and log2FC > 0.1. P value calculated using hypergeometric distribution and corrected for multiple comparisons. h, WikiPathways analysis identifying top differentially enriched pathways in donor and DCM arterial endothelial cells. Genes used in the analysis selected from intersection of pseudobulk and Seurat differential expression with P < 0.05 and log2FC > 0.1. P value calculated using hypergeometric distribution and corrected for multiple comparisons. i, Z score feature plots of transcriptional signatures associated with donor and DCM groups in capillary and venous endothelial cells split by disease state. Genes (blue) were selected by enrichment in the differential expression analyses.
Fig. 8 ∣
Fig. 8 ∣. Endocardial cells exhibit distinct gene signatures in dilated cardiomyopathy.
a, PCA, DESeq2 plots of endocardial cell pseudobulk snRNA-seq data colored by sex and disease state and age. Each data point represents an individual. b, Heat map displaying the top 100 upregulated and downregulated genes ranked by log2FC comparing donor control to DCM. DEGs were derived from the intersection of pseudobulk (DESeq2) and single-cell (Seurat) analyses. c, Unsupervised re-clustering of donor and DCM endocardial cells split by disease state. d, UMAP feature plots of NRG1 and NRG3 split by disease state. e, Violin plots displaying NRG1 and NRG3 expression in endocardial cells from donor and DCM samples. f, WikiPathways analysis identifying top differentially enriched pathways in donor and DCM endocardial cells. Genes used in the analysis selected from intersection of pseudobulk and Seurat differential expression with P < 0.05 and log2FC > 0.1. P value was calculated using hypergeometric distribution and corrected for multiple comparisons. g, WikiPathways analysis identifying top differentially enriched pathways in endocardial cell states. Genes used in the analysis selected from Seurat differential expression with P < 0.05 and log2FC > 0.1. P value calculated using hypergeometric distribution and corrected for multiple comparisons. h, Transcription factor analysis displaying top enriched transcription factors in each cell state using the ChEA 2016 database (https://maayanlab.cloud/Enrichr). Genes used in the analysis selected from Seurat differential expression with P < 0.05 and log2FC > 0.1. P value calculated using Fisher’s exact test. TBX20a and TBX20b represent enrichment identified from two independent CHIP-seq experiments (ChEA_term 22080862, 22328084).

References

    1. Dulken BW et al. Single-cell analysis reveals T cell infiltration in old neurogenic niches. Nature 571, 205–210 (2019). - PMC - PubMed
    1. Zilionis R et al. Single-cell transcriptomics of human and mouse lung cancers reveals conserved myeloid populations across individuals and species. Immunity 50, 1317–1334 (2019). - PMC - PubMed
    1. Travaglini KJ et al. A molecular cell atlas of the human lung from single-cell RNA sequencing. Nature 587, 619–625 (2020). - PMC - PubMed
    1. Park J et al. Single-cell transcriptomics of the mouse kidney reveals potential cellular targets of kidney disease. Science 360, 758–763 (2018). - PMC - PubMed
    1. Rudman-Melnick V et al. Single-cell profiling of AKI in a murine model reveals novel transcriptional signatures, profibrotic phenotype, and epithelial-to-stromal crosstalk. J. Am. Soc. Nephrol 31, 2793–2814 (2020). - PMC - PubMed