

Isochlorogenic Acid C Alleviates High-Fat Diet-Induced Hyperlipemia by Promoting Cholesterol Reverse Transport
- PMID: 35959429
- PMCID: PMC9358028
- DOI: 10.3389/fphar.2022.881078
Isochlorogenic Acid C Alleviates High-Fat Diet-Induced Hyperlipemia by Promoting Cholesterol Reverse Transport
Abstract
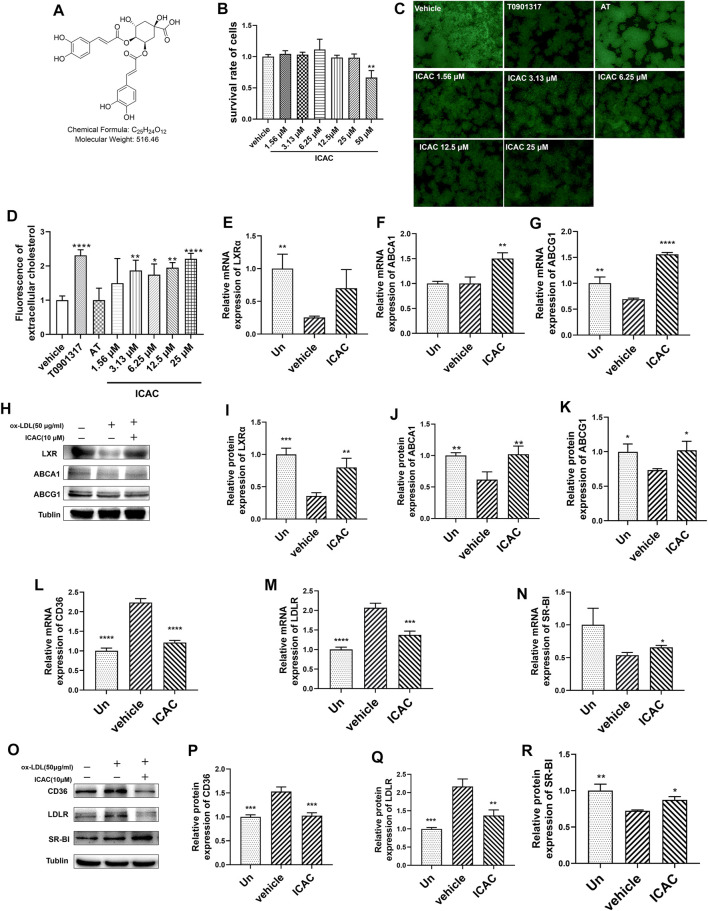
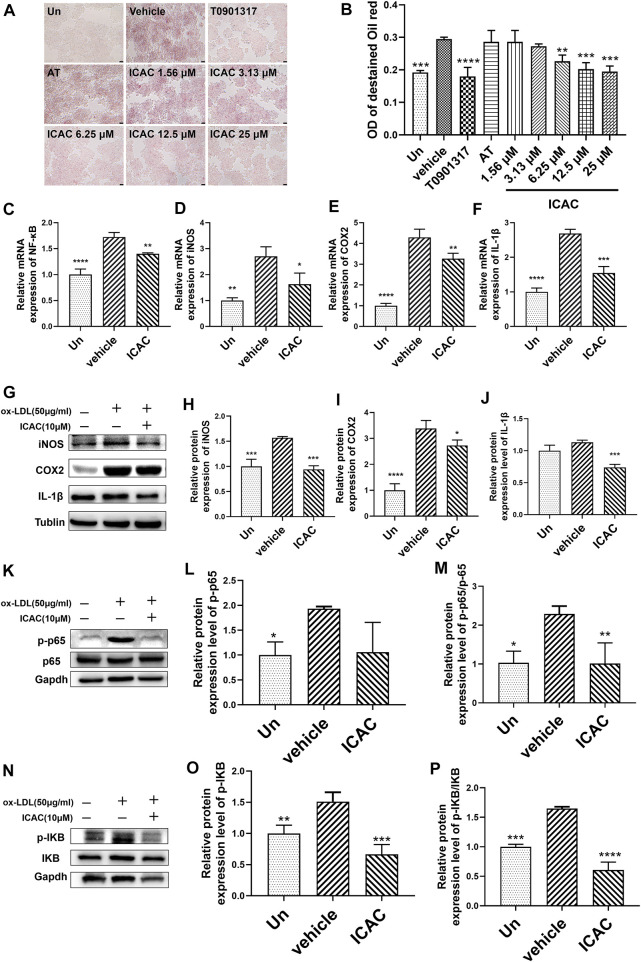
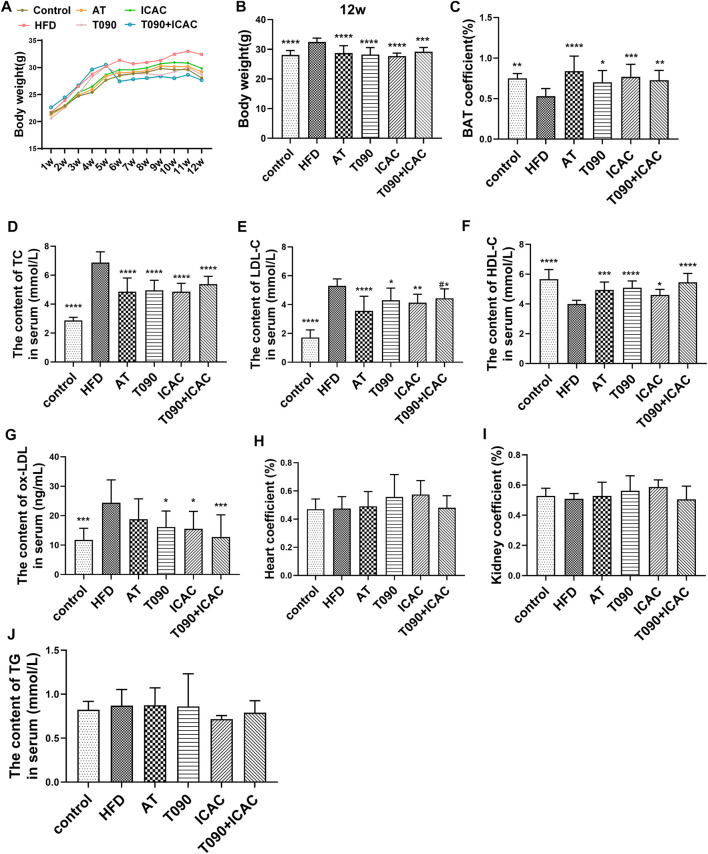
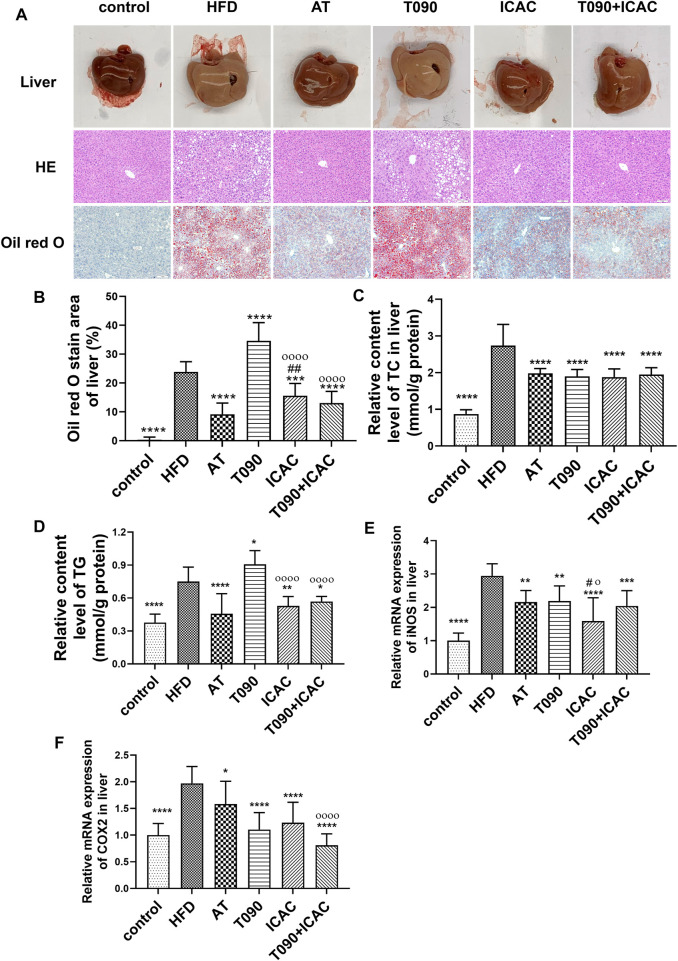
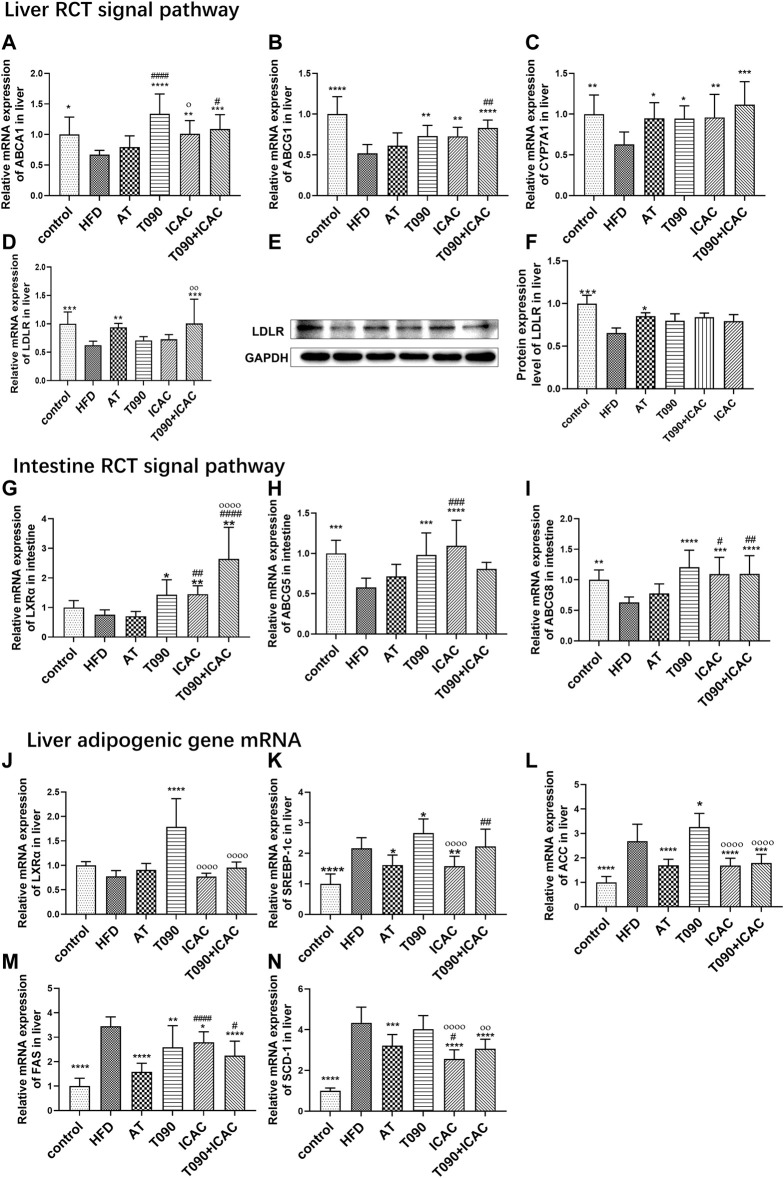
Background: Promoting cholesterol reverse transport (RCT) has been proven to be a promising hyperlipidemia therapy since it is more effective for the treatment of atherosclerosis (AS) caused by hyperlipidemia. Liver X receptor (LXR) agonists can accelerate RCT, but most of them trigger undesirable liver steatosis due to the activation of liver LXRα. Aim: We aim to figure out whether isochlorogenic acid C (ICAC) facilitates RCT without causing hepatic steatosis. Methods: In vitro study, we established foam macrophages and macrophages with loaded NBD-cholesterol models to investigate the competence of RCT promoting ICAC. RT-qPCR and Western blot were used to verify ICAC's regulation of RCT and NF-κB inflammatory pathways. In this in vivo study, male 6-week-old C57BL/6 mice were fed a high-fat diet (HFD) to investigate ICAC's anti-hyperlipidemic effect and its functions in regulating RCT. The anti-hyperlipidemic effect of ICAC was evaluated by blood and liver lipid levels, liver hematoxylin, oil red o staining, and liver coefficient. Finally, mRNA levels of genes involved in RCT and inflammation pathways in the liver and intestine were detected by RT-qPCR. Results: ICAC prevented macrophages from foaming by up-regulating the LXRα mediated RCT pathway and down-regulating expression of the cholesterol absorption genes LDLR and CD36, as well as suppressing iNOS, COX2, and IL-1β inflammatory factors. In HFD-fed mice, ICAC significantly lowered the lipid level both in the serum and the liver. Mechanistic studies showed that ICAC strengthened the RCT pathway in the liver and intestine but didn't affect liver LXRα. Furthermore, ICAC impeded both adipogenesis and the inflammatory response in the liver. Conclusion: ICAC accelerated RCT without affecting liver LXRα, thus resulting in a lipid-lowering effect without increasing liver adipogenesis. Our results indicated that ICAC could be a new RCT promoter for hyperlipidemia treatment without causing liver steatosis.
Keywords: cholesterol efflux; foam cells; hyperlipemia; inflammatory; isochlorogenic acid C; reverse cholesterol transport.
Copyright © 2022 Zheng, Lin, Li, Gan, Huang, Yao, Cai, Zhao, Hu, Li, Xu, Li, Peng, Zhao, Lai, Chen and Huang.
Conflict of interest statement
The authors declare that the research was conducted in the absence of any commercial or financial relationships that could be construed as a potential conflict of interest.
Figures
Similar articles
-
Polymethoxyflavones in citrus extract has a beneficial effect on hypercholesterolemia rats by promoting liver cholesterol metabolism.J Ethnopharmacol. 2024 Mar 25;322:117644. doi: 10.1016/j.jep.2023.117644. Epub 2023 Dec 20. J Ethnopharmacol. 2024. PMID: 38135227
-
Fargesin alleviates atherosclerosis by promoting reverse cholesterol transport and reducing inflammatory response.Biochim Biophys Acta Mol Cell Biol Lipids. 2020 May;1865(5):158633. doi: 10.1016/j.bbalip.2020.158633. Epub 2020 Jan 25. Biochim Biophys Acta Mol Cell Biol Lipids. 2020. PMID: 31988050
-
[Study on anti-hyperlipidemia effect of Linderae Radix via regulating reverse cholesterol transport].Zhongguo Zhong Yao Za Zhi. 2021 Apr;46(7):1795-1802. doi: 10.19540/j.cnki.cjcmm.20200104.401. Zhongguo Zhong Yao Za Zhi. 2021. PMID: 33982484 Chinese.
-
Polydatin attenuates atherosclerosis in apolipoprotein E-deficient mice: Role of reverse cholesterol transport.Phytomedicine. 2019 Sep;62:152935. doi: 10.1016/j.phymed.2019.152935. Epub 2019 Apr 22. Phytomedicine. 2019. PMID: 31085374
-
Danlou Recipe promotes cholesterol efflux in macrophages RAW264.7 and reverses cholesterol transport in mice with hyperlipidemia induced by P407.BMC Complement Med Ther. 2023 Dec 8;23(1):445. doi: 10.1186/s12906-023-04253-9. BMC Complement Med Ther. 2023. PMID: 38066464 Free PMC article.
Cited by
-
Research Progress on Anti-Inflammatory Mechanism of Inula cappa.Int J Mol Sci. 2025 Feb 23;26(5):1911. doi: 10.3390/ijms26051911. Int J Mol Sci. 2025. PMID: 40076538 Free PMC article. Review.
-
Pharmacological profile of dicaffeoylquinic acids and their role in the treatment of respiratory diseases.Front Pharmacol. 2024 Aug 22;15:1371613. doi: 10.3389/fphar.2024.1371613. eCollection 2024. Front Pharmacol. 2024. PMID: 39239645 Free PMC article. Review.
-
Berberine modulates cardiovascular diseases as a multitarget-mediated alkaloid with insights into its downstream signals using in silico prospective screening approaches.Saudi J Biol Sci. 2024 May;31(5):103977. doi: 10.1016/j.sjbs.2024.103977. Epub 2024 Mar 11. Saudi J Biol Sci. 2024. PMID: 38510527 Free PMC article.
-
Uncovering the Role of Anmeidan against Atherosclerosis from Integrated Network Pharmacology and Pharmacological Experiments.Comb Chem High Throughput Screen. 2025;28(6):915-930. doi: 10.2174/0113862073281925240417062009. Comb Chem High Throughput Screen. 2025. PMID: 38676497
-
Apigenin attenuates the atherosclerotic lesions through enhancing selective autophagy/lipophagy and promoting RCT process.Pharm Biol. 2025 Dec;63(1):387-401. doi: 10.1080/13880209.2025.2509020. Epub 2025 May 23. Pharm Biol. 2025. PMID: 40407263 Free PMC article.
References
LinkOut - more resources
Full Text Sources
Research Materials