. 2022 Jul 10;10(2):92-124.
doi: 10.2478/jtim-2021-0056. eCollection 2022 Jun.

Novel Insights into Alcoholic Liver Disease: Iron Overload, Iron Sensing and Hemolysis

Affiliations

Novel Insights into Alcoholic Liver Disease: Iron Overload, Iron Sensing and Hemolysis

Sebastian Mueller et al. J Transl Int Med. .

Abstract

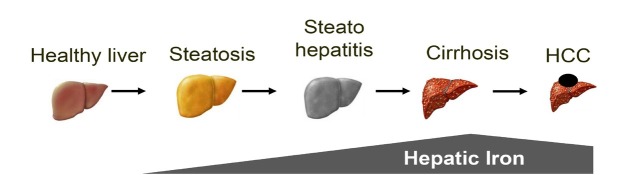
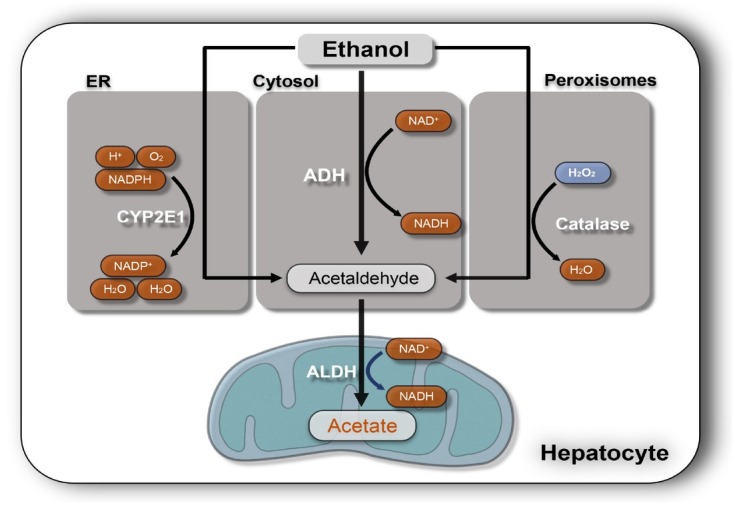
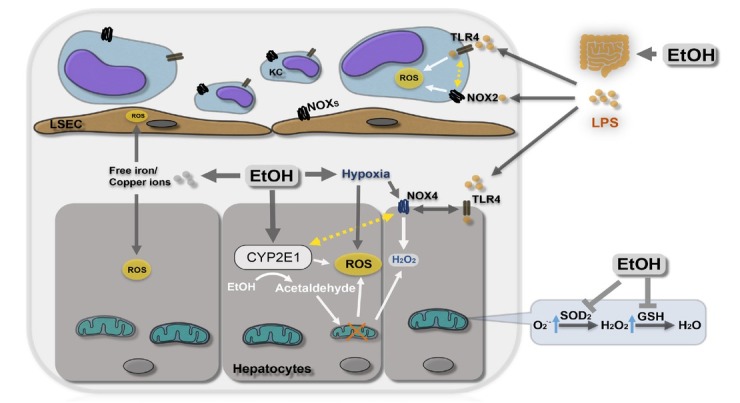
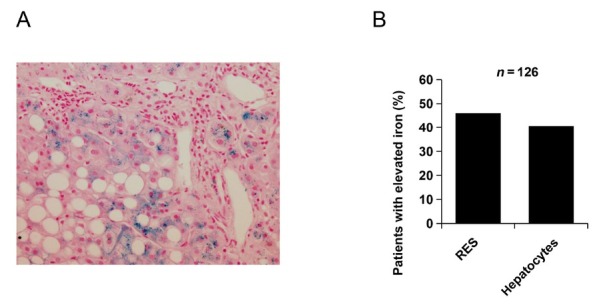
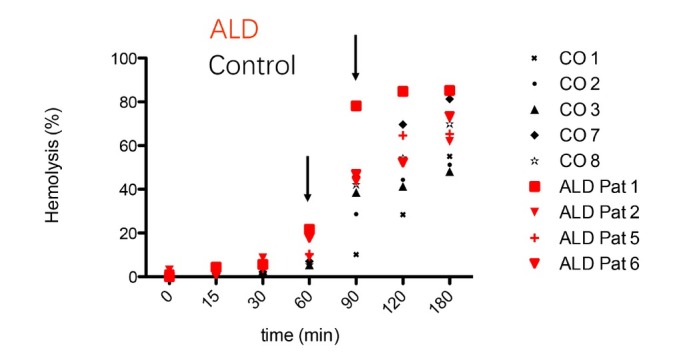
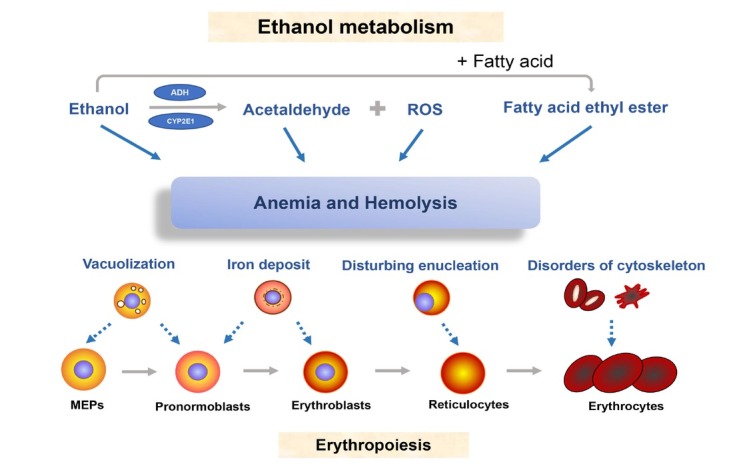
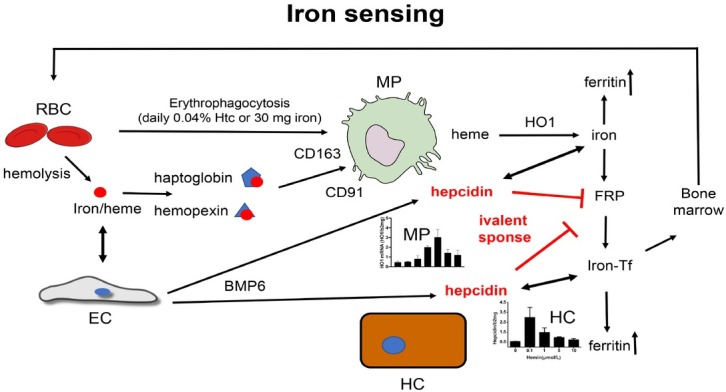
The liver is the major target organ of continued alcohol consumption at risk and resulting alcoholic liver disease (ALD) is the most common liver disease worldwide. The underlying molecular mechanisms are still poorly understood despite decades of scientific effort limiting our abilities to identify those individuals who are at risk to develop the disease, to develop appropriate screening strategies and, in addition, to develop targeted therapeutic approaches. ALD is predestined for the newly evolving translational medicine, as conventional clinical and health care structures seem to be constrained to fully appreciate this disease. This concept paper aims at summarizing the 15 years translational experience at the Center of Alcohol Research in Heidelberg, namely based on the long-term prospective and detailed characterization of heavy drinkers with mortality data. In addition, novel experimental findings will be presented. A special focus will be the long-known hepatic iron accumulation, the somewhat overlooked role of the hematopoietic system and novel insights into iron sensing and the role of hepcidin. Our preliminary work indicates that enhanced red blood cell (RBC) turnover is critical for survival in ALD patients. RBC turnover is not primarily due to vitamin deficiency but rather to ethanol toxicity directly targeted to erythrocytes but also to the bone marrow stem cell compartment. These novel insights also help to explain long-known aspects of ALD such as mean corpuscular volume of erythrocytes (MCV) and elevated aspartate transaminase (GOT/AST) levels. This work also aims at identifying future projects, naming unresolved observations, and presenting novel hypothetical concepts still requiring future validation.

Keywords: alcoholic liver disease; cd163; erythrophagocytosis; hemolysis; hepcidin; iron overload; red blood cell.


Conflict of interest statement

Conflict of Interest None declared.

Figures

Figure 1
Figure 1
Alcoholic liver disease progresses from steatosis to cirrhosis. All stages show distinct signs of iron overload. HCC: hepatocellular carcinoma.
Figure 2
Figure 2
Major three ethanol-oxidizing pathways in the liver. ADH is the major enzyme for breaking down ethanol to AA and reduced NAD+ (NADH) in hepatocytes. AA is the major toxic product of ethanol oxidization. Cytochrome P450 2E1 (CYP2E1) is another major inducible oxidoreductase expressed in the ER that oxidizes ethanol to AA and converts reduced NADPH to its oxidized form (NADP+) also causing ROS formation. Peroxisomal catalase is a minor ethanol metabolism pathway in the liver that normally degrades hydrogen peroxide (H2O2) to water but can also oxidize ethanol to AA. ER: endoplasmic reticulum; ALDH: aldehyde dehydrogenase; NADPH: nicotinamide adenine dinucleotide phosphate; ADH: alcohol dehydrogenase; AA: acetaldehyde; ROS: Reactive oxygen species.
Figure 3
Figure 3
Ethanol metabolism and ROS formation. Enzymatic and non-enzymatic factors including inflammation, hypoxia, free iron are all able to enhance oxidative stress in ALD. EtOH: ethanol; ROS: Reactive oxygen species; O2.-: superoxide anion; H2O2: hydrogen peroxide; CYP2E1: cytochrome P450 2E1; NOX: nicotinamide adenine dinucleotide phosphate oxidase; SOD: superoxide dismutase; LPS: lipopolysaccharide; TLR4: Toll-like receptor 4; KC: Kupffer cell; LSEC: liver sinusoidal endothelial cells; GSH: reduced glutathione.
Figure 4
Figure 4
Hepatic iron accumulation in ALD. (A) Staining with Hematoxylin Eosin and iron marker Prussian blue indicating iron accumulation in hepatocytes and macrophages in a typical patient with ALD. (B) Statistical analysis in the Heidelberg ALD cohort indicates that almost 50% have pathological iron overload both in hepatocytes and macrophages (RES). ALD: alcoholic liver disease; RES: reticluoendothelial system.
Figure 5
Figure 5
Schematic overview of iron toxicity. (A) Iron plays a bivalent role in cell physiology. It is both vital for many cell functions but also (B) highly toxic and carcinogenic through the generation of hydroxyl radicals (Fenton chemistry).
Figure 6
Figure 6
(A) Iron homeostasis and utilization in the body. Dietary iron is absorbed in the duodenum and binds to transferrin. Iron is then delivered to the bone marrow for erythropoiesis the major utilization pathway. Senescent RBCs are phagocytosed by macrophages (erythrophagocytosis) and ca. 90% of iron is recycled for heme synthesis. Excess iron is stored in ferritin in the liver. Regulation of iron metabolism by hepcidin and factors which influence hepcidin expression is also shown. Black circles indicate potential sites of alcohol interference. (B) Heme degradation by HO1. Notably, the heme binding respiratory chain-blocker CO is produced and toxic iron is release. In addition, bilirubin is ultimately conjugated in the liver and excreted through the biliary system. Bilirubin and bile acids can both cause eryptosis and hemolysis at higher concentrations. FPN: ferroportin; HFE: hemochromatosis protein; BMP: bone morphogenetic protein; LPS: lipopolysaccharide; RBC: red blood cell.
Figure 7
Figure 7
Present concepts of signaling pathways on hepcidin: erythropoiesis, iron, infection. These conventional concepts are not able e.g. why hepcidin is strongly suppressed in patients with severe hemolytic disease and why hepcidin is stimulated by iron in vivo but suppressed in vitro. BMP: bone morphogenetic protein; IL6: interleukin 6; STAT3: signal transducer and activator of transcription 3.
Figure 8
Figure 8
Important factors affecting hepcidin in patients with ALD. ALD: alcoholic liver disease.
Figure 9
Figure 9
In vivo hepcidin mRNA expression. (A) Liver hepcidin expression in untreated (white) and 10% ethanol, gavage-fed male 129/Sv mice for 24 h as determined by real-time PCR. 7 mice were employed in each group for every experiment. (B) Serum hepcidin in healthy controls and ALD patients (total and age and gender matched) from the Heidelberg ALD cohort (ongoing study). ALD: alcoholic liver disease; EtOH: ethanol.
Figure 10
Figure 10
Experimental erythrophagocytosis and hepcidin expression in THP-1 macrophages. (A) Erythrophagocytosis of human erythrocytes (oxidized by copper sulfate) by PMA-differentiated THP-1 cells. (B) HO1 continuously increases with increasing numbers of oxidized RBCs (shown as % hematocrit = htc). No HO1 induction is seen with non-oxidized control RBCs. (C) In contrast, hepcidin mRNA shows a so-called “bivalent response” to increasing concentrations of oxidized RBCs (heme). Low levels of heme increase hepcidin while higher levels cause hepcidin suppression. ERFE cannot explain these in vitro observations. RBC: red blood cell; Htc: hematocrit; ERFE: erythroferrone; HO1: hemeoxygenase 1.
Figure 11
Figure 11
Direct exposure of human RBCs with EtOH and AA for 24 h. Note, that hemolysis or modification only occurs at quite high levels of ethanol and acetaldehyde. CO: normal control (no addition of ethanol); EtOH: ethanol; AA: acetaldehyde.
Figure 12
Figure 12
Eryptosis and in vitro erythrophagocytosis in the presence of calf bile acids and bilirubin. (A) Induction of an eryptosis phenotype by bile acids or for three hours. (B) Experimental set up to assess erythrophagocytosis. THP-1 cells were differentiated over 24 hours by PMA to attaching macrophages and exposed to 1% Htc bile acid or bilirubin treated RBCs for another 24 h. Cells were then collected for mRNA quantitation by RT-PCR. (C) HO1 mRNA induction (erythrophagocytosis) in the presence of identical concentrations of bile acid- and bilirubin-treated RBCs. The experiment underlines that cholestasis can initiate a vicious cycle of hemolysis and heme-degradation-mediated hemolysis. This vicious cycle is deteriorating in endstage ALD and may also contribute to AH. Htc: hematocrit; RBC: red blood cell; ALD: alcoholic liver disease; HO1: hemeoxygenase 1; AH: alcoholic hepatitis; Htc: hematocrit.
Figure 13
Figure 13
RBCs in ALD patients are more fragile than RBCs in normal controls. RBCs from both groups were treated with the hemolytic agent phenylhydrazine for various time points and hemolysis was measured by absorption spectroscopy in the supernatant. After 60 min, the hemolysis rate of ALD patients was significantly higher than in healthy controls. It indicates that RBCs seem to be generally more fragile and prone to turn over in drinkers. ALD: alcoholic liver disease; RBC: red blood cell; CO: control patients (healthy volunteers without alcohol consumption).
Figure 14
Figure 14
The in vitro bivalent response of hepatocytes hepcidin to iron levels. A. Hepcidin expression in Huh7 cells was inhibited by all ferric iron forms (FAC 50 μmol/L, FeCl3 50 μmol/L, FC 50 μmol/L, Ferrlecit 50 μmol/L and Hemin 50 μmol/L). B. Hepcidin expression in Huh7 cells co-cultured with BMP6-secreting endothelial cells (HUVEC)-derived conditioned medium was upregulated by low hemin (0.1 μmol/L) but inhibited by higher hemin concentrations; FAC: ferric ammonium citrate.
Figure 15
Figure 15
Hepcidin expression in mice liver with mild or severe hemolysis. One or two injections the hemolytic agent PHZ (60 mg/kg body weight) during two consecutive days (the last injection is t = 0) were applied to mice as models of mild or severe hemolysis. Hepcidin transcription levels were measured at 4, 8, 12, 24, 48 h after the injection. In the mild hemolysis model, hepcidin was upregulated after 4 h and recovered at 48 h. In contrast, in the severe hemolysis model, hepcidin was inhibited at 48 h as is seen in patients with severe hemolysis; PHZ: phenylhydrazine.
Figure 16
Figure 16
Blood parameters in mild and severe hemolysis in mice. Two PHZ injections (with 60 mg/kg body weight) in two consecutive days (the last injection is t = 0) were applied to mice. Blood samples were collected at 24 and 48 h after the injection. Hemolytic mice developed anemia, elevation of GOT, GPT and LDH. Transferrin also increased while hepcidin showed a bivalent response. GOT: glutamic-oxaloacetic transaminase; GPT: glutamic-pyruvic transaminase; LDH: lactate dehydrogenase; PHZ: phenylhydrazine.
Figure 17
Figure 17
Hemin-induced HO1 expression and LC3B expression in a dose dependent manner in THP-1 macrophages. Note that HO1 remains stably expressed despite increasing hemin levels while first signs of autophagy are observed at higher hemin levels (beginning toxicity). It remains to be elucidated whether HO1 expression is limited at higher hemin levels to prevent toxic iron release and whether carbon monoxide is involved in this regulation; HO1: hemeoxygenase 1.
Figure 18
Figure 18
Presence of Hp or Hpx lowers HO1 expression in THP1 cells. Exposure of THP-1 macrophages to lysed RBCs or 30 μmol/L hemin causes induction of HO1 mRNA expression. HO1 mRNA is significantly suppressed in the presence of heme scavenging Hp and Hpx. *P < 0.05, **P < 0.01, ***P < 0.001. Hp: haptoglobin; Hpx: hemopexin; RBC: red blood cell; HO1: hemeoxygenase 1.
Figure 19
Figure 19
Ethanol metabolism and bone marrow toxicity. Ethanol and its metabolites acetaldehyde, ROS and fatty acid ethyl ester interfere with erythropoiesis and cause damage to precursor cells such as erythroblasts. This leads to vacuolization of MEPs and pronormoblasts, iron deposit in erythroblasts and malfunctional enucleation of reticulocytes. ROS: reactive oxygen species; MEP: megakaryocyte erythroid progenitor; ADH: alcohol dehydrogenase.
Figure 20
Figure 20
Proposed novel concept of iron sensing and the regulatory role of hepcidin-secreting HC, MC and BMP6-secreting endothelial cells. Basal daily RBCs turnover and hemolysis stimulate hepcidin and determine basal serum hepcidin levels mainly through iron/heme-induced BMP6 secretion from endothelial cells. The bivalent response of hepcidin secreting both by MC and HC determines hepcidin levels with suppression of hepcidin at higher iron/heme levels and induction of hepcidin at low iron levels. Hepcidin blocks iron export through ferroportin in both an autocrine, iron-buffering manner but also, second, in a systemic function. Under pathologic conditions (e.g. severe hemolysis) single cell and systemic control are in conflict. While suppression of hepcidin prevents e.g. toxic iron accumulation in macrophages or hepatocytes it ultimately causes systemic iron overload. RBC: red blood cell; EC: endothelial cell; BMP: bone morphogenic protein; HC: hepatocytes; MP: macrophages; FRP: ferroportin; HO1: hemeoxygenase 1; Iron-Tf: iron-loaded transferrin; Htc: hematocrit.
Figure 21
Figure 21
Proposed novel hepcidin signaling and iron sensing integrating the important role of continuous hemolysis and the bivalent response of hepcidin. For comparison, see also the conventional concept of hepcidin signaling in Figure 7. In normal conditions, iron released from RBC recycling is sensed by endothelial cells and the signal is transduced to hepatocytes by BMP6, which further control TfR2-HFE-HJV complex to upregulate hepcidin. During blood loss, hemolysis-driven hepcidin is suppressed because hemolysis-driven hepcidin expression will be decreased. This effect is further supported by GDF15 and ERFE. However, under conditions of severe hemolysis, the excess iron has an additional inhibitory effect on hepatocyte hepcidin, next to anemia-mediated effects, ultimately causing further iron accumulation. RBC: red blood cell; BMP: bone morphogenic protein; IL6: interleukin 6; STAT3: signal transducer and activator of transcription 3; ERFE: erythroferrone.
Figure 22
Figure 22
Evidence that elevated GOT levels in ALD are, at least in part, due to enhanced RBC turnover. (A) Measurement of GOT, GPT, GGT and LDH in diluted lysed RBCs and serum. Note that at 0.5% hematocrit, RBC-associated GOT elevation can be observed (and LDH). (B) GOT measured in hemolyzed RBCs (in distilled water 1:10) according to hematocrit. Consequently, ethanol-mediated RBC-turnover will be most likely responsible for GOT elevation in ALD. In addition, the heme degradation product bilirubin needs to be conjugated and excreted by the liver. During jaundice in endstage ALD, accumulation of bilirubin and bile acids will further cause hemolysis (eryptosis) initiating a vicious cycle of hemolysis and bilirubin elevation (see also Figure 6A). So far, RBC-GOT cannot be discriminated from liver-GOT. ALD: alcoholic liver disease; GOT: glutamic-oxaloacetic transaminase; RBC: red blood cell; GPT: glutamic-pyruvic transaminase; GGT: glutamyltransferase; AST: aspartate aminotransferase; ALT: alanine aminotransferase; LDH: lactate dehydrogenase.

References

    1. Ofliver E. EASL Clinical Practice Guidelines: Management of alcohol-related liver disease. J Hepatol. 2018;69:154–81. - PubMed
    1. Wong RJ, Aguilar M, Cheung R, Perumpail RB, Harrison SA, Younossi ZM. Nonalcoholic steatohepatitis is the second leading etiology of liver disease among adults awaiting liver transplantation in the United States. Gastroenterology. 2015;148:547–55. et al. - PubMed
    1. Burra P, Senzolo M, Adam R, Delvart V, Karam V, Germani G. Liver transplantation for alcoholic liver disease in Europe: a study from the ELTR (European Liver Transplant Registry) Am J Transplant. 2010;10:138–48. et al. - PubMed
    1. Hazeldine S, Hydes T, Sheron N. Alcoholic liver disease - the extent of the problem and what you can do about it. Clin Med (Lond) 2015;15:179–85. - PMC - PubMed
    1. Teli MR, Day CP, Burt AD, Bennett MK, James OF. Determinants of progression to cirrhosis or fibrosis in pure alcoholic fatty liver. Lancet. 1995;346:987–90. - PubMed

LinkOut - more resources