. 2022 Jul 25:16:831803.
doi: 10.3389/fncel.2022.831803. eCollection 2022.

Transient and Steady-State Properties of Drosophila Sensory Neurons Coding Noxious Cold Temperature

Affiliations

Transient and Steady-State Properties of Drosophila Sensory Neurons Coding Noxious Cold Temperature

Natalia Maksymchuk et al. Front Cell Neurosci. .

Abstract

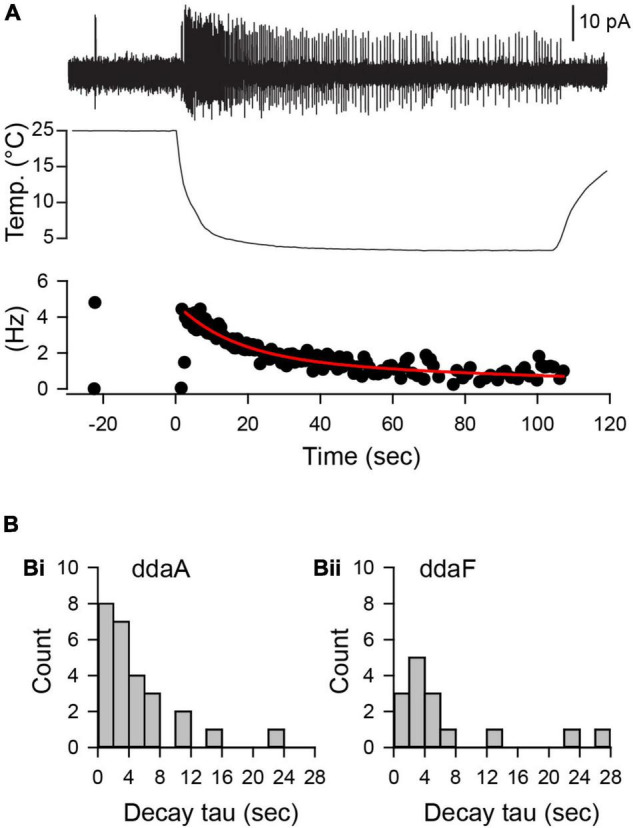
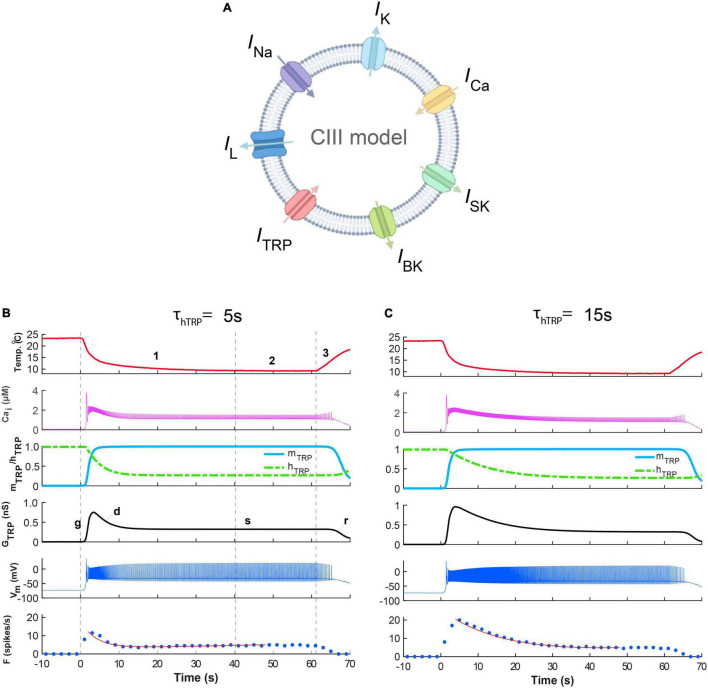
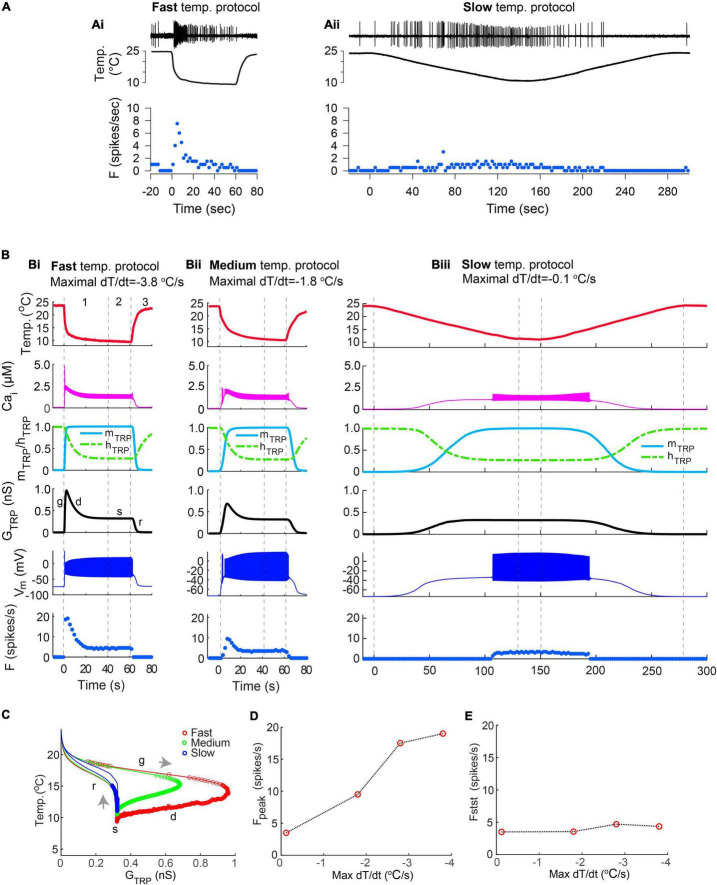
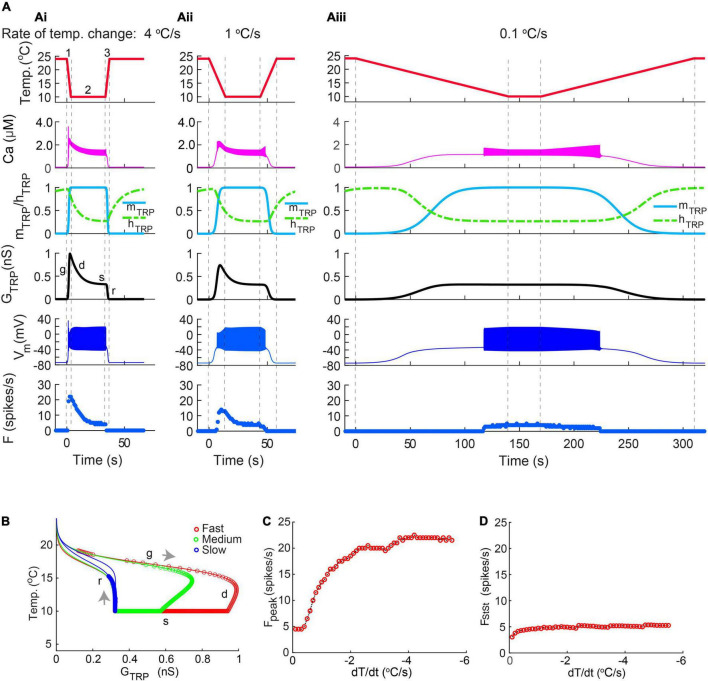
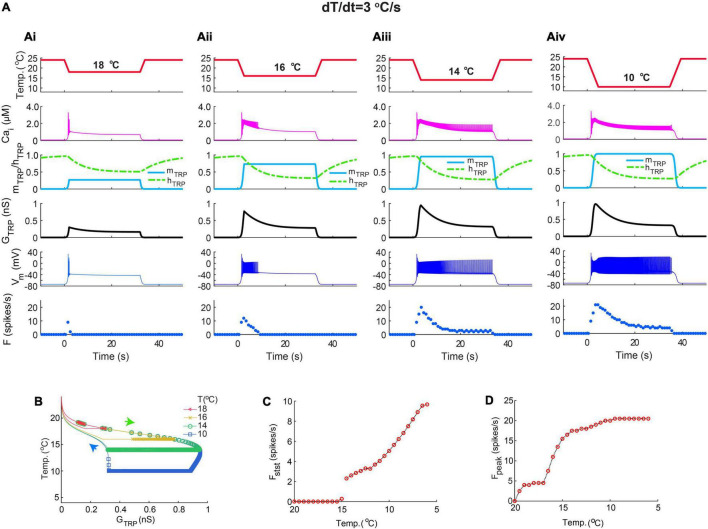
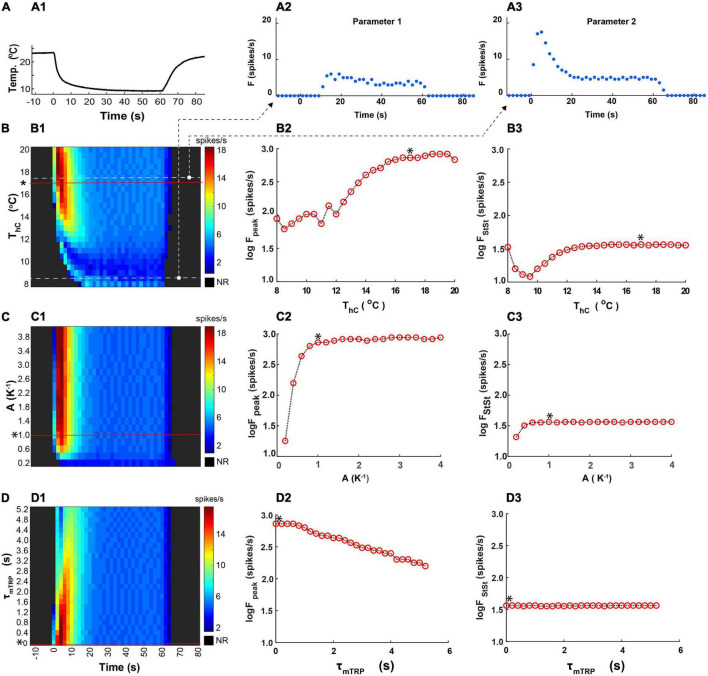
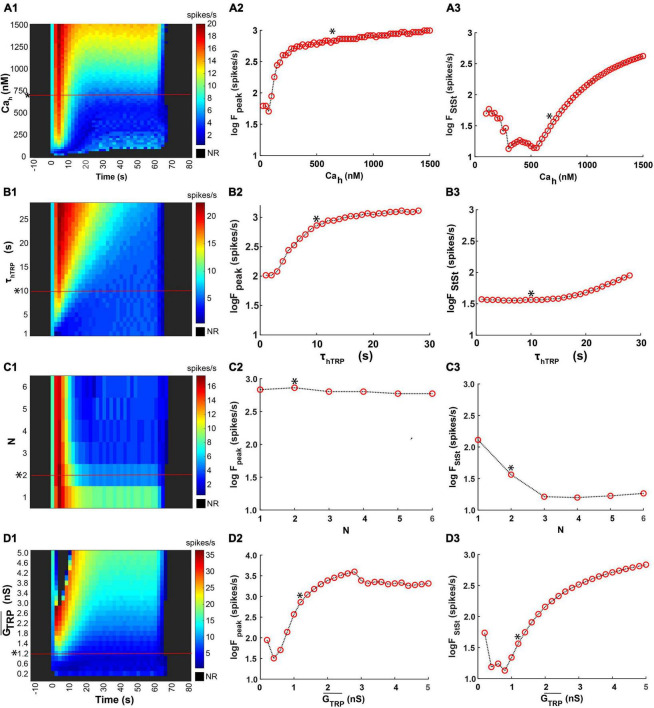
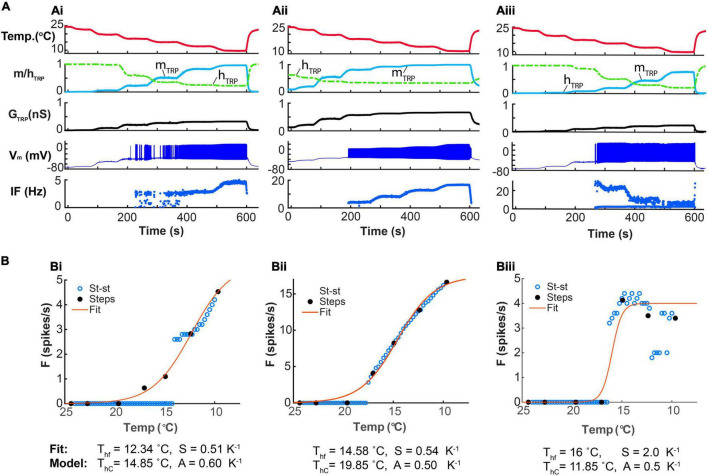
Coding noxious cold signals, such as the magnitude and rate of temperature change, play essential roles in the survival of organisms. We combined electrophysiological and computational neuroscience methods to investigate the neural dynamics of Drosophila larva cold-sensing Class III (CIII) neurons. In response to a fast temperature change (-2 to -6°C/s) from room temperature to noxious cold, the CIII neurons exhibited a pronounced peak of a spiking rate with subsequent relaxation to a steady-state spiking. The magnitude of the peak was higher for a higher rate of temperature decrease, while slow temperature decrease (-0.1°C/s) evoked no distinct peak of the spiking rate. The rate of the steady-state spiking depended on the magnitude of the final temperature and was higher at lower temperatures. For each neuron, we characterized this dependence by estimating the temperature of the half activation of the spiking rate by curve fitting neuron's spiking rate responses to a Boltzmann function. We found that neurons had a temperature of the half activation distributed over a wide temperature range. We also found that CIII neurons responded to decrease rather than increase in temperature. There was a significant difference in spiking activity between fast and slow returns from noxious cold to room temperature: The CIII neurons usually stopped activity abruptly in the case of the fast return and continued spiking for some time in the case of the slow return. We developed a biophysical model of CIII neurons using a generalized description of transient receptor potential (TRP) current kinetics with temperature-dependent activation and Ca2+-dependent inactivation. This model recapitulated the key features of the spiking rate responses found in experiments and suggested mechanisms explaining the transient and steady-state activity of the CIII neurons at different cold temperatures and rates of their decrease and increase. We conclude that CIII neurons encode at least three types of cold sensory information: the rate of temperature decrease by a peak of the firing rate, the magnitude of cold temperature by the rate of steady spiking activity, and direction of temperature change by spiking activity augmentation or suppression corresponding to temperature decrease and increase, respectively.

Keywords: Drosophila larvae; cold nociception; cold temperature magnitude; computational modeling; rate of temperature change; thermal sensation.


Conflict of interest statement

The authors declare that the research was conducted in the absence of any commercial or financial relationships that could be construed as a potential conflict of interest.

Figures

FIGURE 1
FIGURE 1
Extracellular recordings of CIII neurons in a Drosophila larval filet. (A,B) The larva filet was placed in an experimental chamber with running HL3 saline. To produce a controlled temperature decrease during the stimulus, the superfusion path was switched to the one that goes through the chiller, and chilled saline was delivered. The saline temperature was constantly monitored by a thermometer probe. The saline was grounded with an Ag-AgCl wire in an agar bridge. We recorded spiking activities from two subtypes of CIII neurons, ddaA or ddaF, located in the dorsal cluster of sensory neurons. To do this, the cell body with a portion of its neurite was gently sucked up into the pipette. (C) Image of CIII neurons (ddaA and ddaF) labeled by GAL419–12, UAS-mCD8::GFP, with the electrode (a dotted line) attached to ddaA.
FIGURE 2
FIGURE 2
Spiking responses of CIII neurons to two types of temperature stimulation protocols. (A,B) Spiking activities of ddaA (A) and ddaF (B) in response to the fast-stimulation protocol (10°C, Ai,Bi) and the slow-stimulation protocol (Aii,Bii). The panels show, from top to bottom, the heat map representation of the spiking rate, the plot of the averaged spiking rate against time, the temperature change, the rate of temperature change, and % histogram of the time bins (2 s), with the maximum spiking rate. In (A,B), cyan and pink traces show individual data; blue and purple traces show the mean values. N = 40 (Ai), 21 (Aii), 26 (Bi), and 15 (Bii). Time zero is set to the onset of the stimulation. (C,D) The average spiking rate in ddaA (C) and ddaF (D) during the falling phase (1), the steady phase (2), and the rising phase (3) of the fast and slow stimulation protocols drawn schematically above the graphs. Asterisks indicate significant differences (see text).
FIGURE 3
FIGURE 3
Spiking responses of CIII neurons to fast and slow temperature stimulation. (A,B) Two types of spiking responses to the fast-stimulation protocol. In (Ai,Bi), three representative traces of spiking activity recorded extracellularly from two ddaA neurons are shown with corresponding temperature traces on the bottom (Ai,Bi). The temperature was reduced to 20°C (dark red), 15°C (dark green), and 10°C (blue). Graphs in (Aii,Bii) show changes in the spiking rate (spikes/s, a solid line) in every 2-s bin. In each graph, the pink area indicates the running average of the spiking rate measured with a 10-s moving window, whereas the cyan area indicates standard deviation. (C,D) Two types of spiking responses to the slow-stimulation protocol. As in (A,B), the spike traces with corresponding temperature traces (Ci,Di) and the changes in the spiking rate (Cii,Dii) are shown. (E) The relationship between the steady-state spiking rate vs. temperature. In (Ei) (ddaA) and (Eiii) (ddaF), the spiking rate in time windows of 50-60 s after the onset of the fast stimulation protocol is plotted against temperature. Symbols are color-coded based on the target temperature: 20°C, red/dark red; 15°C, green/dark green; and 10°C, blue/dark blue; room temperature, gray. In (Eii) (ddaA) and (Eiv) (ddaF), average spike frequencies (spikes/s) were measured in every 2°C bin from 25°C to 9°C during the slow ramp stimulation protocol. In all graphs, opened circles show individual data, and color-filled black circles show the averages. Error bars indicate standard deviations. (F) Bar graphs showing the percentage of neurons that exhibited a distinct peak within 20 s after the onset of the fast-stimulation protocol (20, 15, 10°C) and during the downslope (120 s) of the slow-stimulation protocol (Slow). (G) The maximal spike frequencies were plotted against the rate of change of temperature in the fast- (blue/dark blue) and slow-stimulation (pink/purple) protocols (Gi, ddaA; Gii, ddaF). The maximal spiking rate was measured by a 10-s running window that runs through all 1-s bins. The asterisks indicate p < 0.05 by t-test.
FIGURE 4
FIGURE 4
The cold temperature sensitivity of individual CIII neurons was evaluated by curve fitting their steady-state spiking rate to the Boltzmann function of steady temperature value. (A) Examples of spiking activity of three different CIII neurons (one ddaA and two ddaFs) obtained with the step-stimulation protocol, showing different threshold temperatures. One neuron (ddaF-1) completely stopped spiking at the lowest temperature step (10°C). The activities, along with temperature recordings, are shown (Ai). The plots of the average spiking rate corresponding to each temperature (Aii), and percentile histograms of temperature of half activation for the spiking rate (Aiii,Aiv) are presented. (B) Two contrasting examples of spiking activities of two ddaA neurons in response to the fast-stimulation protocol reaching three different steady temperatures (Bi) and to the slow-stimulation protocol (Bii) are shown. In (Bi,Bii), the upper traces (blue and dark blue) and the lower traces (red and dark red) were recorded from the same set of cells, ddaA-1 and ddaA-2, respectively. The plots of spiking rates (spikes/s) against temperature (Biii), and percentile histograms of temperature of half activation for the spiking rate (Biv,Bv) were also shown. In the fast protocol (Bi), the average spike rate was measured during a 20-s window near the end of each stimulus. In the slow ramp protocol (Bii), the average spiking rate was measured for every 2°C bin (16–17 s). In (Biv,Bv) the gray bars show data by the fast-stimulation protocol, whereas the black bars by the slow-stimulation protocol.
FIGURE 5
FIGURE 5
The decline of the spiking rate during the noxious cold stimulation showed an exponential decay with a broad distribution of time constants of decay. (A) A representative spiking response (a top trace) of a ddaA neuron to a 10°C fast-temperature stimulation (middle traces). A plot of instantaneous spike frequencies (Hz) was shown at the bottom. (B) Histograms of decay time constant in ddaA (Bi) and ddaF (Bii) in response to a 10°C temperature stimulation.
FIGURE 6
FIGURE 6
Responses of the CIII model reflect three phases of the fast-stimulation temperature protocol. The difference in the time constants of the Ca2+-dependent inactivation of TRP current produces the difference between the time course of the spiking rate decay. (A) The CIII computational model includes voltage-gated Na+ current, INa, encoded by the para gene; voltage-gated K+ current IK, encoded by the Shab gene; the voltage-gated N-type calcium channel, ICa, encoded by the cacophony gene; leak current IL; and TRP current, ITRP; small conductance Ca2+-activated potassium current, ISK, encoded by the SK gene; and big conductance Ca2+-activated potassium current, and IBK, encoded by the slowpoke gene. In (B,C), the fast-stimulation protocol and model parameters are the same, except for the time constant of inactivation of the TRP current: τhTRP = 5 s (B) and τhTRP = 15 s (C). (B,C) The experimental temperature trace (the top panel, red), intracellular Ca2+ concentration (the second panel, magenta), activation and inactivation of the TRP current (the third panel, blue and green, respectively), TRP conductance (the fourth panel, black), cold-evoked spiking activity response (the fifth panel, navy blue), and the spiking rate (a 2-s bin, bottom, navy blue) for the model with observed fast (B) and slow (C) spiking rate decays after the peak. In the bottom panel, the red line is a curve fitting the firing rate, with a double exponential function. The parameters of TRP current shared between the model in (B,C) are GTRP¯ = 1.2 nS, Th = 290 K (16.85oC), A = 1 K–1, N = 2, Cah = 700 nM, τmTRP = 0.002 s. Letters “g,” “d,” “s,” “r” show phases of TRP conductance, GTRP: g, growing; d, declining; s, steady, and r, returning of GTRP to its initial level.
FIGURE 7
FIGURE 7
(Ai,Aii) Examples of CIII responses to the fast-stimulation protocol (Ai) and to a slow-stimulation protocol (Aii) obtained by electrophysiological experiments. (Bi–iii) A model reproduces the diversity of responses seen in electrophysiological recordings as being due to differences in the rate of temperature changes. Fast and medium temperature changes produced a well-defined peak of the spiking rate at the beginning of the temperature stimulus (Bi,Bii), whereas slow temperature decrease did not produce any notable peak (Biii). Numbers correspond to the phases of temperature protocol: 1 – temperature declines to the noxious cold range, 2 – steady noxious cold temperature, 3– temperature rises to an ambient level. The fast, medium, and slow rates of temperature decrease were –3.8°C/s in (Bi), –1.8°C/s in (Bii), and –.12°C/s in (Biii), respectively. Letters “g,” “d,” “s,” “r” show phases of TRP conductance mentioned in Figure 6: g, growing; d, declining; s, steady, and r, returning of GTRP to its initial level. (C) The faster rate of temperature decrease, the higher peak of conductance of TRP current, GTRP. Gray arrows indicate the direction of GTRP trajectory at temperature change: temperature decrease and increase correspondingly. Color circles indicate individual spikes. (D,E) Dependence of the maximal spiking rate (D) and a steady-state frequency (E) on the maximal rate of temperature change. The bin size for frequency is 2 s. Parameters of the model were GTRP¯ = 1.2 ns; Th = 290 K; A = 1 K–1; N = 2; Cah = 700 nM; τhTRP = 10 s; τmTRP = 0.002 s.
FIGURE 8
FIGURE 8
The CIII model responses to linear temperature change. Like exponential temperature change (Figure 7), the peak of the firing rate at trapezoid stimulation temperature protocol was determined by the rate of temperature change. (A) Fast temperature change induces a strong peak of the spiking rate at the beginning of the temperature stimulus (Ai,Aii). Slow temperature change (Aiii) did not produce a peak of the spiking rate. The absolute value of the rate of temperature decrease and increase was 4oC/s in (Ai), 1oC/s in (Aii), and 0.1oC/s in (Aiii). Numbers 1, 2, and 3 in (Ai) mark three phases of temperature protocol: (1) temperature decline, (2) steady temperature, and (3) temperature rise. (B) The higher rate of temperature decrease, the larger peak of conductance of TRP current, GTRP. Circles mark individual spikes. Arrows indicate the direction of temperature change: temperature decrease and increase correspondingly. (C) Dependence of the maximal spiking rate on the rate of temperature change. (D) The dependence steady-state spiking rate on the rate of temperature change. Bin size for frequency is equal to 2 s. Letters mark phases of TRP conductance changes (Figure 6): g, growing; d, declining; s, steady, and r, returning to the initial level. The parameters of the model are the same as in Figure 7.
FIGURE 9
FIGURE 9
The CIII neuron model responds to the magnitude of steady cold temperature. (Ai–Aiv) Representative examples of the CIII model responses to different magnitudes of cold temperature at a fixed rate of temperature change, 3oC/s. (B) Trajectories of TRP current conductance at different cold temperature magnitudes are shown in (Ai–Aiv). (C,D) Dependences of the spiking rate peak (C) and steady-state frequency (D) on the magnitude of the cold temperature value. (B) In size for the spiking rate is equal to 2 s. The parameters of the model are the same as in Figure 7.
FIGURE 10
FIGURE 10
Effects of parameters determining kinetics of activation of the TRP current on the peak and the steady-state spiking rate of the CIII model’s responses to the fast temperature stimulation protocol. (A1) A representative example of the fast stimulation trace used in an experiment was applied to the CIII model. (A2,A3) Representative CIII model responses to this temperature protocol at different values of temperature of half activation: Th = 281.5K and 290.5K, respectively. For convenience, Parameter Th is represented by ThC in oC, 8.35oC, and 17.35oC, respectively. (B1–D1) Color maps code spiking responses (x axis) of the CIII model to the stimulation trace (A1) using different values of the parameter of interest (y axis) with other parameters kept at their canonical values* (a canonical parameter set in Figure 7). In all color maps, the average frequency was calculated in the 2-s bin window. (B2–D2,B3–D3) Dependences of the spiking rate peak and the steady-state spiking rate, respectively, on the parameter values: temperature of half activation, Th (ThC is in oC, B), the steepness of TRP activation, A (C), and time constant of TRP activation, τmTRP (D). NR, no response.
FIGURE 11
FIGURE 11
Effects of parameters of inactivation kinetics and maximal conductance of the TRP current on the model responses. We used here the same temperature stimulation trace (Figure 10A1), the canonical set of the model parameters, measurements of the responces, and the format of the color maps as in Figure 10. (A1–D1). We investigated effects of the Ca2+ concentration of half inactivation, Cah (A1–A3), the time constant of TRP inactivation, τhTRP (B1–B3), the Hill coefficient, N (C1–C3), and the TRP current maximal conductance, GTRP¯, (D1–D3).
FIGURE 12
FIGURE 12
CIII neuron model responses to steady-state temperature. (Ai–Aiii) Graphs from the top to the bottom show the experimental temperature protocol with steps of temperature changes, TRP activation and inactivation over time, instantaneous TRP conductance over time, electrical activity over time, and the spiking rate over time. (Bi–Biii) Model temperature-response curves based on experimental step-stimulation protocol (black-closed circles). These curves were fitted with Boltzmann function (the red line) with the following temperature of half activation and steepness: 12.34oC, 0.51 K–1 (Bi); 14.58oC, 0.54 K–1 (Bii) and 16oC, 2. K–1 (Biii). Model temperature-response curves obtained at various constant steady-state temperatures are shown as blue open circles. Parameters for (Ai,Bi): GTRP¯ = 1.5 nS, A = 0.6 K–1, N = 5, Th = 288 K, Cah = 900 nM, τhTRP = 5 s, τmTRP = 0.002 s. Parameters for (Aii,Bii): GTRP¯ = 2 nS, A = 0.5 K–1, N = 1, Th = 293 K, Cah = 900 nM, τhTRP = 5 s, τmTRP= 0.002 s. Parameters for (Aiii,Biii): GTRP¯ = 1.5 nS, A = 0.5 K–1, N = 5, Th = 285 K, Cah = 700 nM, τhTRP = 10 s, τmTRP = 0.002 s.

Similar articles

Cited by

References

    1. Adams D. J., Berecki G. (2013). Mechanisms of conotoxin inhibition of N-type (Ca(v)2.2) calcium channels. Biochim. Biophys. Acta 1828 1619–1628. 10.1016/j.bbamem.2013.01.019 - DOI - PubMed
    1. Alonso L. M., Marder E. (2020). Temperature compensation in a small rhythmic circuit. eLife 9:e55470. 10.7554/eLife.55470 - DOI - PMC - PubMed
    1. Alpert M. H., Frank D. D., Kaspi E., Flourakis M., Zaharieva E. E., Allada R., et al. (2020). A circuit encoding absolute cold temperature in Drosophila. Curr. Biol. 30 2275–2288.e2275. 10.1016/j.cub.2020.04.038 - DOI - PMC - PubMed
    1. Altner H., Loftus R. (1985). Ultrastructure and function of insect thermo- and hygroreceptors. Annu. Rev. Entomol. 30 273–295.
    1. Ameismeier F., Loftus R. (1988). Response characteristics of cold cell on the antenna of Locusta migratoria L. J. Comp. Physiol. A 163 507–516.

LinkOut - more resources