

Mesophyll conductance response to short-term changes in pCO2 is related to leaf anatomy and biochemistry in diverse C4 grasses
- PMID: 35959528
- PMCID: PMC9825963
- DOI: 10.1111/nph.18427
Mesophyll conductance response to short-term changes in pCO2 is related to leaf anatomy and biochemistry in diverse C4 grasses
Abstract
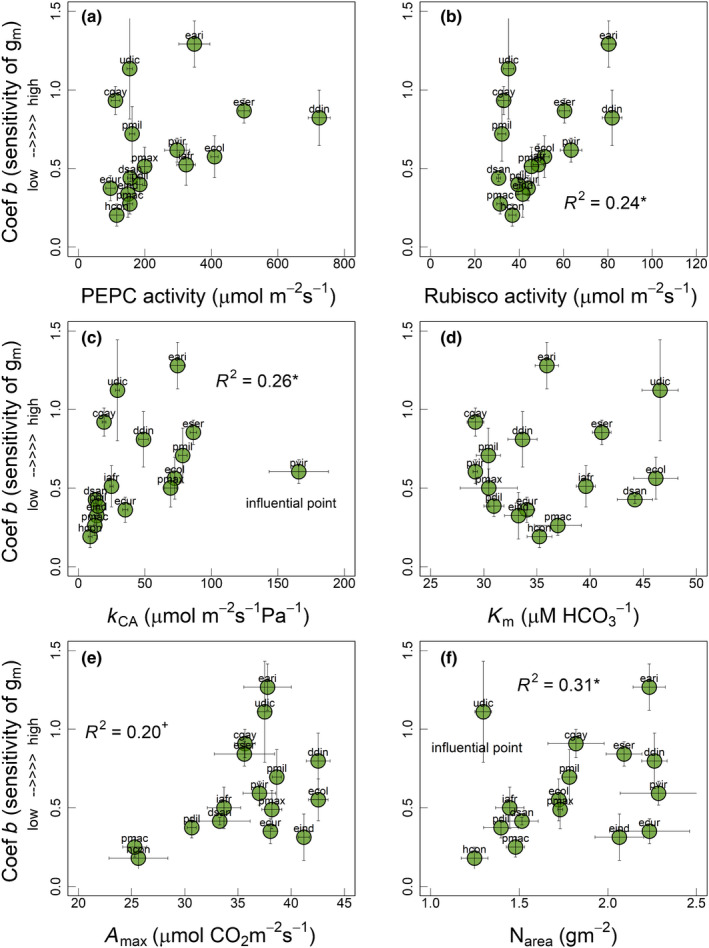
Mesophyll CO2 conductance (gm ) in C3 species responds to short-term (minutes) changes in environment potentially due to changes in leaf anatomical and biochemical properties and measurement artefacts. Compared with C3 species, there is less information on gm responses to short-term changes in environmental conditions such as partial pressure of CO2 (pCO2 ) across diverse C4 species and the potential determinants of these responses. Using 16 C4 grasses we investigated the response of gm to short-term changes in pCO2 and its relationship with leaf anatomy and biochemistry. In general, gm increased as pCO2 decreased (statistically significant increase in 12 species), with percentage increases in gm ranging from +13% to +250%. Greater increase in gm at low pCO2 was observed in species exhibiting relatively thinner mesophyll cell walls along with greater mesophyll surface area exposed to intercellular air spaces, leaf N, photosynthetic capacity and activities of phosphoenolpyruvate carboxylase and Rubisco. Species with greater CO2 responses of gm were also able to maintain their leaf water-use efficiencies (TEi ) under low CO2 . Our study advances understanding of CO2 response of gm in diverse C4 species, identifies the key leaf traits related to this response and has implications for improving C4 photosynthetic models and TEi through modification of gm .
Keywords: C4 photosynthesis; CO2 response of mesophyll conductance; PEPC affinity for bicarbonate (Km); carbonic anhydrase (CA); leaf anatomy; mesophyll cell wall thickness; phosphoenolpyruvate carboxylase (PEPC); water-use efficiency.
© 2022 The Authors. New Phytologist © 2022 New Phytologist Foundation.
Figures


Similar articles
-
Increased adaxial stomatal density is associated with greater mesophyll surface area exposed to intercellular air spaces and mesophyll conductance in diverse C4 grasses.New Phytol. 2020 Jan;225(1):169-182. doi: 10.1111/nph.16106. Epub 2019 Sep 4. New Phytol. 2020. PMID: 31400232
-
Mesophyll conductance in Zea mays responds transiently to CO2 availability: implications for transpiration efficiency in C4 crops.New Phytol. 2018 Mar;217(4):1463-1474. doi: 10.1111/nph.14942. Epub 2017 Dec 8. New Phytol. 2018. PMID: 29220090
-
Limitation of C4 photosynthesis by low carbonic anhydrase activity increases with temperature but does not influence mesophyll CO2 conductance.J Exp Bot. 2022 Jan 27;73(3):927-938. doi: 10.1093/jxb/erab464. J Exp Bot. 2022. PMID: 34698863
-
Mesophyll conductance to CO2 and Rubisco as targets for improving intrinsic water use efficiency in C3 plants.Plant Cell Environ. 2016 May;39(5):965-82. doi: 10.1111/pce.12622. Epub 2015 Dec 11. Plant Cell Environ. 2016. PMID: 26297108 Review.
-
Mesophyll conductance: the leaf corridors for photosynthesis.Biochem Soc Trans. 2020 Apr 29;48(2):429-439. doi: 10.1042/BST20190312. Biochem Soc Trans. 2020. PMID: 32129830 Review.
Cited by
-
Cell wall thickness spectrum of photosynthetic cells in herbaceous C3, C4, and crassulacean acid metabolism plants.J Plant Res. 2025 Mar;138(2):197-213. doi: 10.1007/s10265-024-01603-7. Epub 2024 Dec 10. J Plant Res. 2025. PMID: 39658745
References
-
- Barbour MM, Evans JR, Simonin KA, von Caemmerer S. 2016. Online CO2 and H2O oxygen isotope fractionation allows estimation of mesophyll conductance in C4 plants, and reveals that mesophyll conductance decreases as leaves age in both C4 and C3 plants. New Phytologist 210: 875–889. - PubMed
-
- Barbour MM, Kaiser BN. 2016. The response of mesophyll conductance to nitrogen and water availability differs between wheat genotypes. Plant Science 251: 119–127. - PubMed
-
- Bunce JA. 2010. Variable responses of mesophyll conductance to substomatal carbon dioxide concentration in common bean and soybean. Photosynthetica 48: 507–512.
-
- von Caemmerer S. 2000. Biochemical models of leaf photosynthesis. Collingwood, Vic., Australia: CSIRO.
Publication types
MeSH terms
Substances
LinkOut - more resources
Full Text Sources
Miscellaneous
