

Drug-microenvironment perturbations reveal resistance mechanisms and prognostic subgroups in CLL
- PMID: 35959629
- PMCID: PMC9372727
- DOI: 10.15252/msb.202110855
Drug-microenvironment perturbations reveal resistance mechanisms and prognostic subgroups in CLL
Abstract
The tumour microenvironment and genetic alterations collectively influence drug efficacy in cancer, but current evidence is limited and systematic analyses are lacking. Using chronic lymphocytic leukaemia (CLL) as a model disease, we investigated the influence of 17 microenvironmental stimuli on 12 drugs in 192 genetically characterised patient samples. Based on microenvironmental response, we identified four subgroups with distinct clinical outcomes beyond known prognostic markers. Response to multiple microenvironmental stimuli was amplified in trisomy 12 samples. Trisomy 12 was associated with a distinct epigenetic signature. Bromodomain inhibition reversed this epigenetic profile and could be used to target microenvironmental signalling in trisomy 12 CLL. We quantified the impact of microenvironmental stimuli on drug response and their dependence on genetic alterations, identifying interleukin 4 (IL4) and Toll-like receptor (TLR) stimulation as the strongest actuators of drug resistance. IL4 and TLR signalling activity was increased in CLL-infiltrated lymph nodes compared with healthy samples. High IL4 activity correlated with faster disease progression. The publicly available dataset can facilitate the investigation of cell-extrinsic mechanisms of drug resistance and disease progression.
Keywords: chronic lymphocytic leukaemia; drug perturbation; microenvironment; multi-omics; trisomy 12.
© 2022 The Authors. Published under the terms of the CC BY 4.0 license.
Figures
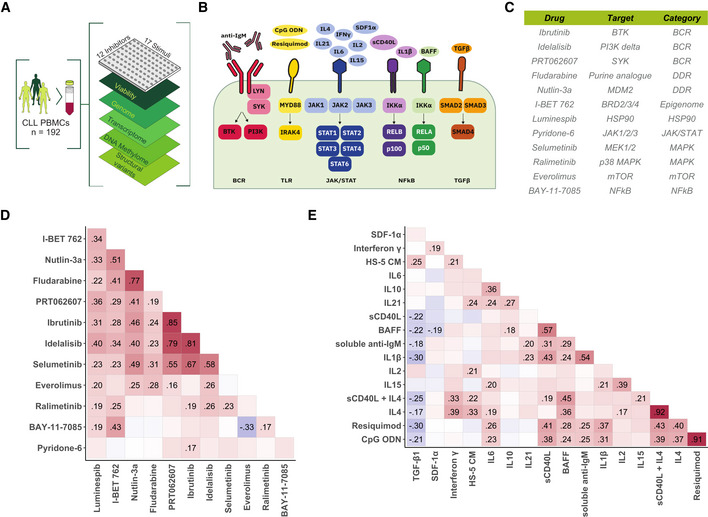
- A
Schematic of experimental protocol. We measured tumour cell viability after exposure to 12 drugs and 17 microenvironmental stimuli, both individually and in combination, in primary CLL samples (n = 192). Integrating these data with genomic, transcriptomic, DNA methylation and copy number variation data, we identified pro‐survival pathways, molecular modulators of drug and microenvironment responses, and drug‐stimulus interactions in CLL. The combinatorial data cube (12 × 17 × 192) can be accessed in toto (
github.com/Huber‐group‐EMBL/CLLCytokineScreen2021 ) and explored interactively, via the shiny app (www.dietrichlab.de/CLL_Microenvironment/ ). - B
Overview of stimuli included in the screen and their primary annotated targets. In addition, we also used medium condition by the human stroma cell line HS‐5.
- C
Table of drugs included in the screen. Drug target and category of target are also shown.
- D, E
Pearson correlation coefficients, taken across the 192 patient samples, of the logarithm of the relative viability after single treatment with drug (D) and stimulus (E) treatments. Text labels indicate correlation coefficients for those pairs where the correlation was significantly different from 0 at a false discovery rate (FDR) threshold of 0.05 (method of Benjamini & Hochberg (1995)), adjustment performed separately for drug and stimulus correlations).
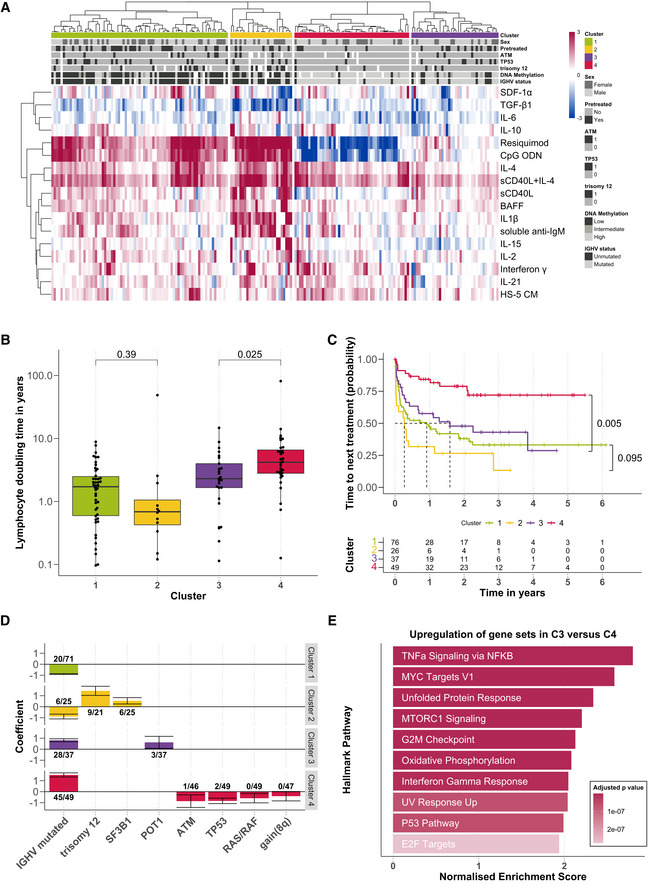
Heatmap showing viability measurements for the 192 samples (rows) subject to each of 17 microenvironmental stimuli (columns). The data are shown on a robust z‐score scale, that is, the logarithm of the relative viability measurements was scaled by the median absolute deviation within each row. Limits were applied to scaling factor for optimal visualisation. Red indicates increased viability, and blue indicates decreased viability. Samples are annotated for genetic features, sex and pre‐treatment status.
Lymphocyte doubling time, a clinical marker for disease progression, plotted for each cluster, within the subset of 115 for which this measurement was available (C1: n = 46; C2: n = 12; C3: n = 25; C4: n = 32). P‐values from Student's t‐test (non‐paired, two‐sided). The central bar, boxes and whiskers of the plot represent the median, first and third quartiles, and 1.5‐time interquartile range (IQR), respectively.
Clinical outcome. Kaplan–Meier curves of time to next treatment for each cluster. P‐values from univariate Cox proportional hazard models comparing C1 with C2, and C3 with C4. Survival data were available for 188 patient samples.
Genetics. Multinomial regression quantifies association of genetic features with each cluster. X‐axis indicates genetic features, and y‐axis indicates coefficient from multinomial regression, indicating enrichment or depletion of the feature within each cluster. Text labels show the number of positive cases and the total number of cases tested for the feature, in each cluster. Error bars represent mean ± standard deviation.
Transcriptomes. GSEA comparing the expression of genes in samples from C3 (n = 9) versus those C4 (n = 12). Normalised enrichment scores are shown for the top 10 most significant Hallmark gene sets (Liberzon et al, 2015).
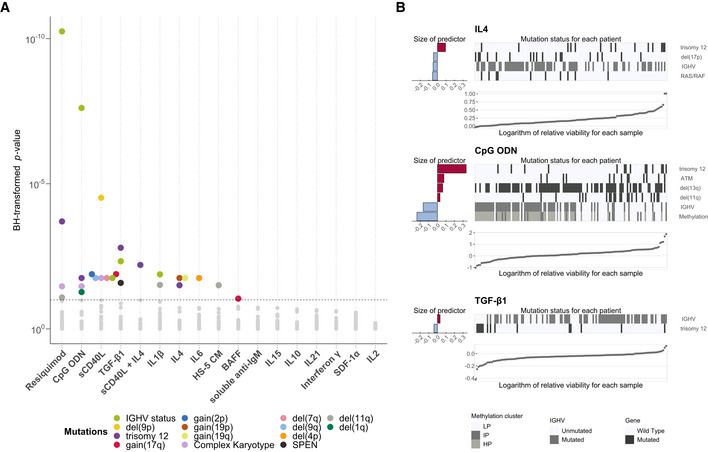
Overview of genetic feature‐stimulus associations. x‐axis shows stimuli, and y‐axis shows P‐values from Student's t‐tests (two‐sided, equal variance). Each dot represents a genetic feature‐stimulus association. Tests with P‐values smaller than the threshold corresponding to an FDR of 10% (method of Benjamini & Hochberg (1995)) are indicated by coloured circles, where the colours represent the gene mutations and structural aberrations. All genetic features tested can be found in Appendix Table S1.
Predictor profiles depicting genetic feature‐stimulus associations identified through Gaussian linear modelling with L1‐penalty, for selected stimuli. The bar plots on the left indicate size and sign of coefficients assigned to genetic features that are associated with response to given stimulus. Positive coefficients indicate higher viability after stimulation if the feature is present. The heatmaps show mutation status in each of the patient samples. The samples were sorted by the logarithm of the relative viability, which is shown in the scatter plots at the bottom. In total, 39 genetic alterations were tested amongst 129 patient samples with complete annotation. LP, low programmed; IP, intermediate programmed; HP, high programmed (Oakes et al, 2016).
- A–C
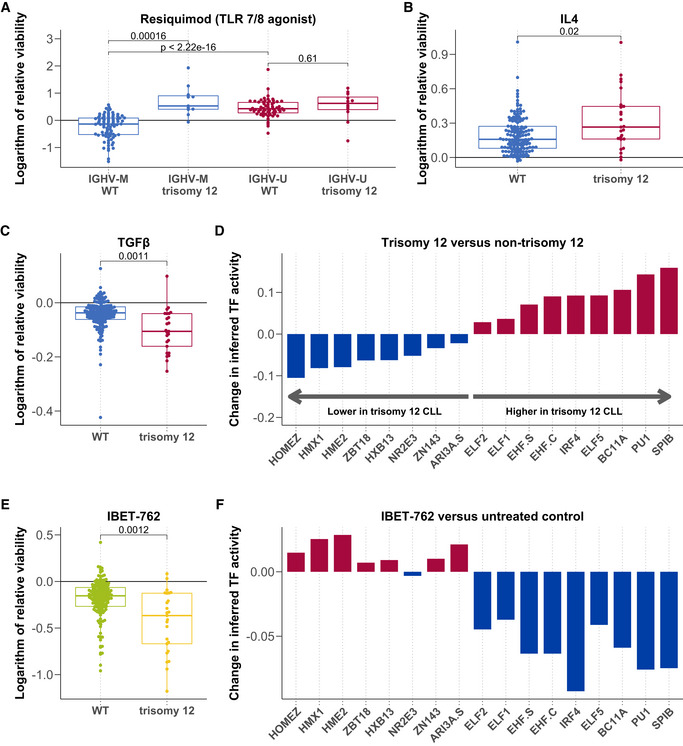
Logarithm of the relative viability after treatment with Resiquimod (A, n = 169), IL4 (B, n = 174) and TGFβ (C, n = 174) stratified by trisomy 12, and in (A), also by IGHV status. P‐values from Student's t‐test (two‐sided, non‐paired). The central bar, boxes and whiskers of the plot represent the median, first and third quartiles, and 1.5‐time IQR, respectively.
- D
Change in inferred TF activity (y‐axis) between samples with (n = 9) and without (n = 43) trisomy 12. Plot shows a change in inferred activity for all TFs with an adjusted P‐value < 0.05. Changes in inferred activity and P‐values for 638 TFs calculated using the diffTF software and data taken from (Rendeiro et al, 2016).
- E
Natural logarithm of the relative viability (n = 174) after treatment with IBET 762 in trisomy 12 and non‐trisomy 12 CLL samples. P‐value from Student's t‐test (two‐sided, non‐paired). The central bar, boxes and whiskers of the plot represent the median, first and third quartiles, and 1.5‐time IQR, respectively.
- F
Differential inferred TF activity (y‐axis) comparing IBET 762 (n = 4) and control‐treated CLL samples (n = 4). Plot shows inferred activity for the same TFs shown in Fig 4D.
- A
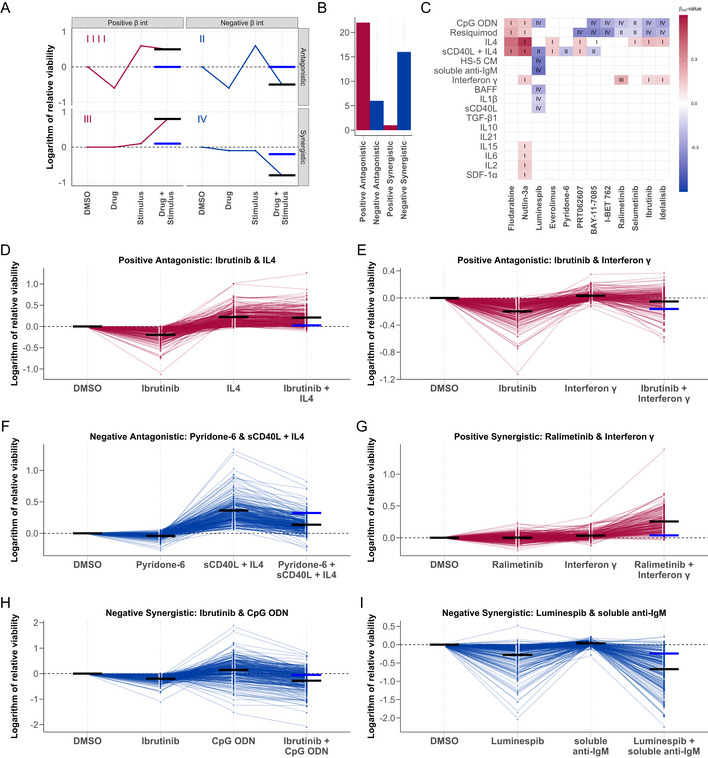
Graphical representation of the four drug‐stimulus interaction categories. Categories are defined according to the nature of the interaction (synergistic or antagonistic), and whether the viability is increased or decreased by the stimulus (positive or negative). x‐axis shows treatment type, and y‐axis shows viability with each treatment. Red and blue points and lines depict a representative treatment response pattern for given interaction type. Blue horizontal lines represent the expected viability for combinatorial treatment in the absence of an interaction between drug and stimulus (i.e. additive effects), and black horizontal lines represent the measured viability after combinatorial treatment. The difference between the black and blue lines indicates the impact of the interaction on expected viability.
- B
Bar plot of the number of interactions in each category where the P‐value for the interaction term β int < 0.05.
- C
Heatmap of all β int values with associated P‐value < 0.05, annotated with interaction category (I‐IV). Rows and columns indicate drugs and stimuli, ordered according to hierarchical clustering. Scale indicates size and sign of β int for given drug‐stimulus combination. (I) Positive β int and antagonistic (microenvironmental stimulation reduces drug effect). (II) Negative β int and antagonistic (drug reduces stimuli effect). (III) Positive β int and synergistic (microenvironmental stimulation and drug have synergistic pro‐survival effect). (IV) Negative β int and antagonistic (microenvironmental stimulation and drug show synergistic toxicity).
- D–I
Examples of drug‐stimulus interactions, for each category. Plots show the natural logarithm of the relative viability of 192 CLL samples after treatment with the respective drug and stimulus. Each line represents one patient sample linked across treatments. Black horizontal lines in each single treatment indicate the expected viability based on linear modelling. Black and blue horizontal lines in the combinatorial treatment indicate the expected viability based on the additive effect of the drug and stimulus (blue), and the expected viability accounting for the additive effect and the interaction (black). (D + E) Ibrutinib, a clinically used BTK inhibitor, is blocked by IL4 and IFNγ. (F) The JAK inhibitor pyridone‐6 inhibits the pro‐survival effect of sCD40L + IL4 stimulation. (G) The p38 inhibitor ralimetinib and IFNγ show a synergistic pro‐survival effect not observed in either single treatment. (H) TLR agonists, including CpG ODN (shown), increase sensitivity to BTK inhibition by ibrutinib, despite increasing viability as single treatments. (I) Soluble anti‐IgM sensitises CLL samples to HSP90 inhibition by luminespib.
- A
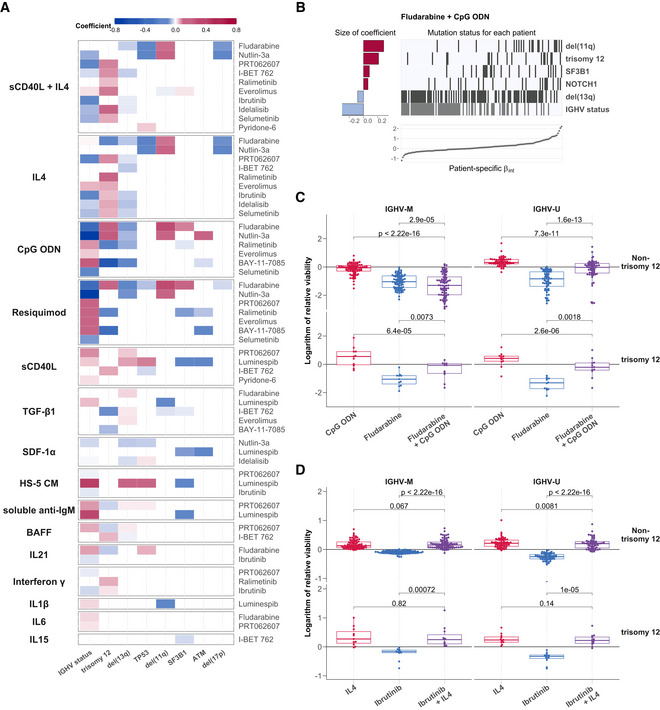
Heatmap depicting genetic predictors of drug‐stimulus interactions. Each row indicates genetic features that are associated with the size of interaction between the drug (right) and stimulus (left), that is, each row depicts the coefficients of a single multivariate model fit as in (B)). Coloured fields indicate that β int for given drug and stimulus is modulated by corresponding genetic feature. Positive coefficients are shown in red, indicating a more positive β int if the feature is present. For clarity, plot shows eight most common genetic features and omits drug‐stimulus combinations where no coefficient was assigned to any of these eight features. Heatmap of coefficients for all tested genetic features can be seen in Appendix Fig S18.
- B
Predictor profile depicting genetic features that modulate the interaction between fludarabine and CpG ODN, identified using multivariate modelling. The horizontal bars on the left show the size of coefficients assigned to genetic features by model. The matrix in the centre indicates patient sample mutation status for the given genetic features aligned with the scatter plot below indicating the size of β int for the same patient sample. Grey lines indicate the presence of genetic feature/IGHV mutated.
- C, D
Beeswarm boxplots of the natural logarithm of the relative viability of 169 CLL samples, for (C) fludarabine + CpG ODN and (D) ibrutinib + IL4 single and combinatorial treatments, faceted by IGHV status and trisomy 12 status. P‐values from paired Student's t‐test. The central bar, boxes and whiskers of the plot represent the median, first and third quartiles and 1.5‐time IQR, respectively.
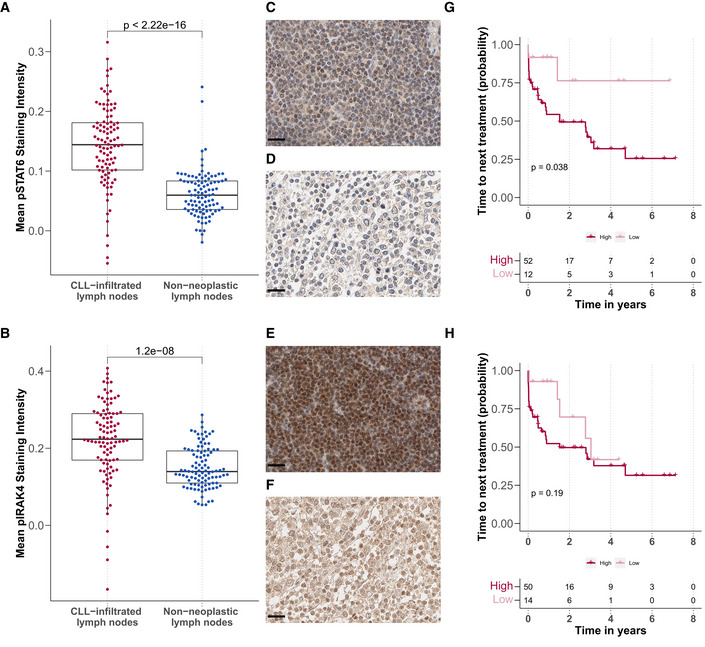
- A, B
Mean (A) pSTAT6 and (B) pIRAK4 staining intensity in CLL‐infiltrated (n = 100 for pSTAT and pIRAK4) and tumour‐free lymph node biopsies (n = 98 for pSTAT6 and n = 100 for pIRAK4) after background subtraction (y‐axis), P‐values from Student's t‐test. Each dot represents the mean of all cells in the tissue microarray cores per patient sample. The central bar, boxes and whiskers of the plot represent the median, first and third quartiles, and 1.5‐time IQR, respectively.
- C–F
Example images of immunohistochemistry sections: (C + D) pSTAT6 levels in (C) CLL‐infiltrated and (D) tumour‐free samples. (E + F) pIRAK4 levels in (E) CLL‐infiltrated and (F) tumour‐free samples. Scale bar defines 20 μm in all images.
- G, H
Kaplan–Meier plots for time to next treatment stratified by levels (high/low) of pSTAT6 (G) and pIRAK4 (H). P‐values from univariate Cox proportional hazard models.
Similar articles
-
Molecular basis of aggressive disease in chronic lymphocytic leukemia patients with 11q deletion and trisomy 12 chromosomal abnormalities.Int J Mol Med. 2007 Oct;20(4):461-9. Int J Mol Med. 2007. PMID: 17786276
-
B-cell receptor configuration and mutational analysis of patients with chronic lymphocytic leukaemia and trisomy 12 reveal recurrent molecular abnormalities.Hematol Oncol. 2014 Mar;32(1):22-30. doi: 10.1002/hon.2086. Epub 2013 Jul 17. Hematol Oncol. 2014. PMID: 23861036
-
NF-κB activation in chronic lymphocytic leukemia: A point of convergence of external triggers and intrinsic lesions.Semin Cancer Biol. 2016 Aug;39:40-8. doi: 10.1016/j.semcancer.2016.07.005. Epub 2016 Aug 1. Semin Cancer Biol. 2016. PMID: 27491692 Review.
-
In vitro activity of 20 agents in different prognostic subgroups of chronic lymphocytic leukemia--rolipram and prednisolone active in cells from patients with poor prognosis.Eur J Haematol. 2009 Jul;83(1):22-34. doi: 10.1111/j.1600-0609.2009.01248.x. Epub 2009 Feb 24. Eur J Haematol. 2009. PMID: 19245531
-
Microenvironmental interactions in chronic lymphocytic leukemia: the master role of CD49d.Semin Hematol. 2014 Jul;51(3):168-76. doi: 10.1053/j.seminhematol.2014.05.002. Epub 2014 May 15. Semin Hematol. 2014. PMID: 25048781 Review.
Cited by
-
Ex vivo drug response profiling for response and outcome prediction in hematologic malignancies: the prospective non-interventional SMARTrial.Nat Cancer. 2023 Dec;4(12):1648-1659. doi: 10.1038/s43018-023-00645-5. Epub 2023 Oct 2. Nat Cancer. 2023. PMID: 37783805 Free PMC article.
-
Novel meriolin derivatives potently inhibit cell cycle progression and transcription in leukemia and lymphoma cells via inhibition of cyclin-dependent kinases (CDKs).Cell Death Discov. 2024 Jun 11;10(1):279. doi: 10.1038/s41420-024-02056-6. Cell Death Discov. 2024. PMID: 38862521 Free PMC article.
-
Toll-Like Receptors in the Immunotherapy Era: Dual-Edged Swords of Tumor Immunity and Clinical Translation.MedComm (2020). 2025 Jul 27;6(8):e70308. doi: 10.1002/mco2.70308. eCollection 2025 Aug. MedComm (2020). 2025. PMID: 40727252 Free PMC article. Review.
-
Disrupting pro-survival and inflammatory pathways with dimethyl fumarate sensitizes chronic lymphocytic leukemia to cell death.Cell Death Dis. 2024 Mar 18;15(3):224. doi: 10.1038/s41419-024-06602-z. Cell Death Dis. 2024. PMID: 38494482 Free PMC article.
-
The Immunology of DLBCL.Cancers (Basel). 2023 Jan 29;15(3):835. doi: 10.3390/cancers15030835. Cancers (Basel). 2023. PMID: 36765793 Free PMC article. Review.
References
-
- Aguilar‐Hernandez MM, Blunt MD, Dobson R, Yeomans A, Thirdborough S, Larrayoz M, Smith LD, Linley A, Strefford JC, Davies A et al (2016) IL‐4 enhances expression and function of surface IgM in CLL cells. Blood 127: 3015–3025 - PubMed
-
- Akalin A, Franke V, Vlahoviček K, Mason CE, Schübeler D (2015) Genomation: a toolkit to summarize, annotate and visualize genomic intervals. Bioinformatics 31: 1127–1129 - PubMed
-
- Baumann T, Moia R, Gaidano G, Delgado J, Condoluci A, Villamor N, Payedimarri AB, Costa D, Patriarca A, Jiménez‐Vicente C et al (2021) Lymphocyte doubling time in chronic lymphocytic leukemia modern era: A real‐life study in 848 unselected patients. Leukemia 35: 2325–2331 - PubMed
Publication types
MeSH terms
Substances
LinkOut - more resources
Full Text Sources
