. 2022 Oct;112(1):172-192.
doi: 10.1111/tpj.15938. Epub 2022 Aug 26.

Distinct composition and amplification dynamics of transposable elements in sacred lotus (Nelumbo nucifera Gaertn.)

Affiliations

Distinct composition and amplification dynamics of transposable elements in sacred lotus (Nelumbo nucifera Gaertn.)

Stefan Cerbin et al. Plant J. 2022 Oct.

Abstract

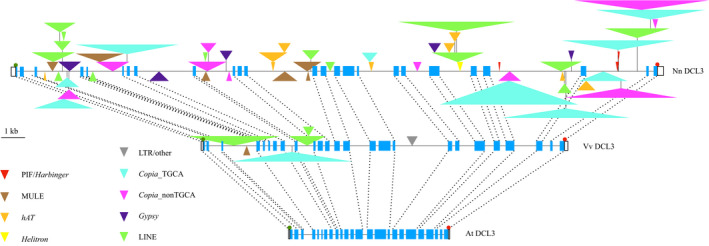
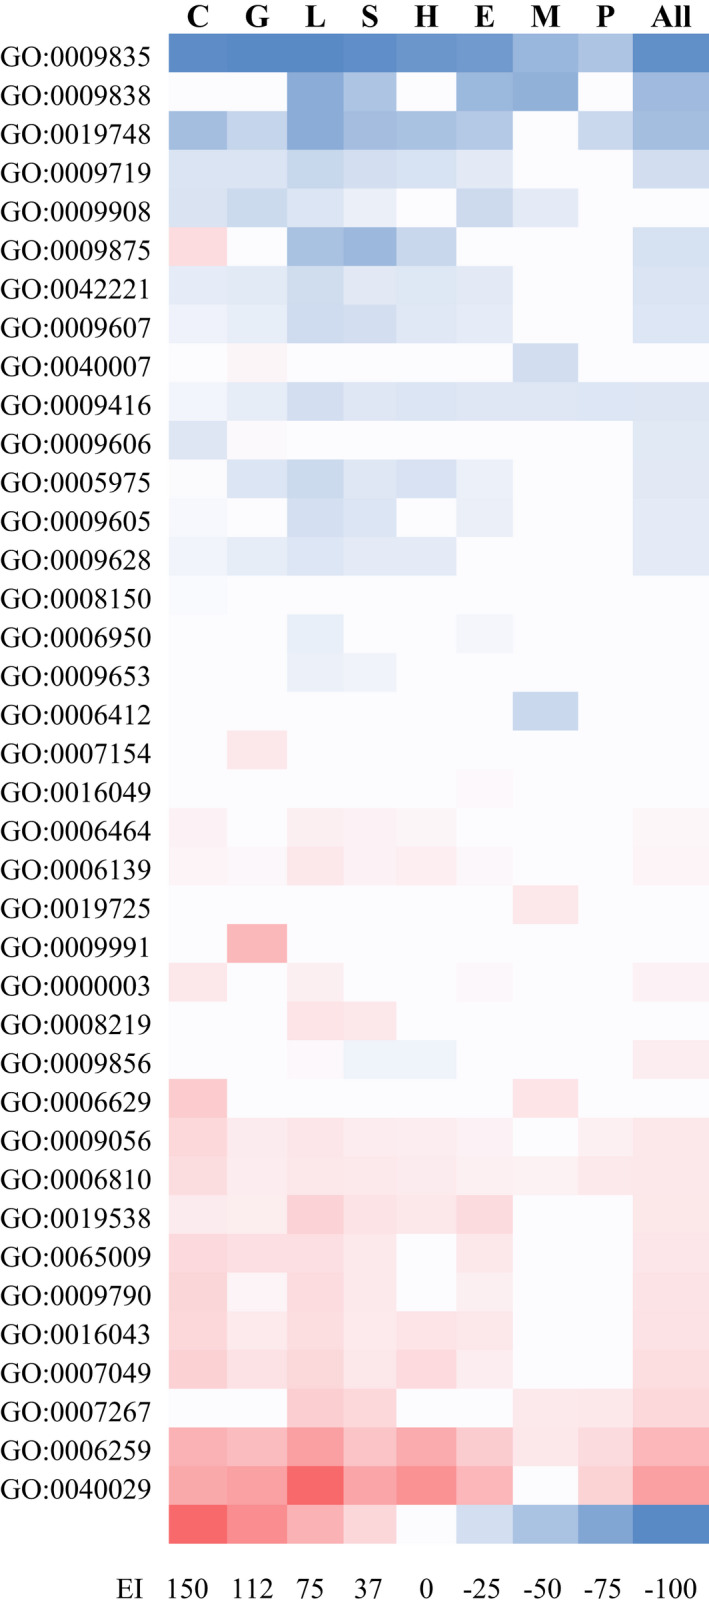
Sacred lotus (Nelumbo nucifera Gaertn.) is a basal eudicot plant with a unique lifestyle, physiological features, and evolutionary characteristics. Here we report the unique profile of transposable elements (TEs) in the genome, using a manually curated repeat library. TEs account for 59% of the genome, and hAT (Ac/Ds) elements alone represent 8%, more than in any other known plant genome. About 18% of the lotus genome is comprised of Copia LTR retrotransposons, and over 25% of them are associated with non-canonical termini (non-TGCA). Such high abundance of non-canonical LTR retrotransposons has not been reported for any other organism. TEs are very abundant in genic regions, with retrotransposons enriched in introns and DNA transposons primarily in flanking regions of genes. The recent insertion of TEs in introns has led to significant intron size expansion, with a total of 200 Mb in the 28 455 genes. This is accompanied by declining TE activity in intergenic regions, suggesting distinct control efficacy of TE amplification in different genomic compartments. Despite the prevalence of TEs in genic regions, some genes are associated with fewer TEs, such as those involved in fruit ripening and stress responses. Other genes are enriched with TEs, and genes in epigenetic pathways are the most associated with TEs in introns, indicating a dynamic interaction between TEs and the host surveillance machinery. The dramatic differential abundance of TEs with genes involved in different biological processes as well as the variation of target preference of different TEs suggests the composition and activity of TEs influence the path of evolution.

Keywords: Nelumbo nucifera; amplification; genes; intron; retrotransposon; target specificity; transposon.


Conflict of interest statement

The authors declare that they have no conflicts of interest.

Figures

Figure 1
Figure 1
The phylogeny of the core integrase of Copia retroelements with different terminal motifs in lotus and other plants. Numbers next to branches indicate the % bootstrap support (1000 replicates, 50% cutoff). Retroelements with the same ends are labeled with the same color and shape. Retroelements starting with ‘TG’ are shown as dots, while elements starting with ‘TA’ are shown as triangles. Red arrows and vertical bars indicate branches containing lotus retroelements with different ends. A branch containing lotus and grape retroelements with ‘TACA’ motif is denoted by a green arrow and a vertical bar. A branch containing Arabidopsis and grape retroelements with ‘TATA’ motif is denoted by a purple arrow and a vertical bar. The tree is unrooted. Abbreviations for species: At, Arabidopsis thaliana; Gr, Gossypium raimondii; Nn, Nelumbo nucifera; Os, Oryza sativa; Sl, Solanum lycopersicum; Nt, Nicotiana tabacum; Vv, Vitis vinifera. [Colour figure can be viewed at wileyonlinelibrary.com]
Figure 2
Figure 2
Overview of TE abundance indicated as insertion density (a) and genomic fraction (b) in different genomic regions. Upstream refers to regions 2 kb upstream of the transcription start site, and downstream refers to regions 2 kb downstream of the transcription termination site. Genic regions include upstream regions, downstream regions, exons, and introns. Intergenic refers to the genome excluding gene bodies and 2‐kb flanking sequences. [Colour figure can be viewed at wileyonlinelibrary.com]
Figure 3
Figure 3
The abundance and enrichment of TE superfamilies in genic regions. (a) The composition of TEs (fraction of genome) in each region. (b) The enrichment/underrepresentation of different TE superfamilies in each region, reflected by the enrichment index, which represents the percent difference between the genomic fraction in each region and that at the genome‐wide level. Upstream refers to 2‐kb regions upstream of the transcription start site, and downstream refers to 2‐kb regions downstream of the transcription termination site. [Colour figure can be viewed at wileyonlinelibrary.com]
Figure 4
Figure 4
Comparison of abundance of intact LTR retrotransposons with different LTR sequence identity of individual intact retroelements in introns and intergenic regions. (a) The insertion density of retroelements in each identity range. (b) The percentage/fraction of retroelements in each identity range for each group of retroelements. Intergenic regions refer to the genome excluding gene bodies and 2‐kb flanking sequences. [Colour figure can be viewed at wileyonlinelibrary.com]
Figure 5
Figure 5
Comparison of the Dicer‐like 3 (DCL3) gene structure in Arabidopsis, grape, and sacred lotus. Top, Nn (Nelumbo nucifera) DCL3 (107 kb); bottom, At (Arabidopsis thaliana) DCL3 (7.3 kb, AT3G43920, TAIR10); middle, Vv (Vitus vinifera) DCL3 (28.6 kb, GenBank accession No. NC_012010.3, 1 757 859–1 786 478, GeneID: 100254311). Blue boxes indicate exons of genes, white boxes indicate UTRs, triangles indicate transposons denoted by color, black and horizontal lines represent non‐transposon intron sequences. Triangles stacked on top of other triangles signify a nested insertion. Green and red dots signify transcription start and stop sites of the genes, respectively. Dash lines of blue exons denote regions of homology of coding regions between grape and other species. [Colour figure can be viewed at wileyonlinelibrary.com]
Figure 6
Figure 6
Heatmap of enrichment/underrepresentation of each superfamily of TEs in genes involved in different biological processes. Only significant enrichment/underrepresentation is shown in color. Abbreviations are shown on top. C, Copia; G, Gypsy; L, LINE; S, SINE; H, hAT; E, Helitron; M, MULE; P, PIF/Harbinger; All, all TEs. See Table S6 for GO terms. [Colour figure can be viewed at wileyonlinelibrary.com]

Similar articles

Cited by

References

    1. Agren, J.A. & Wright, S.I. (2011) Co‐evolution between transposable elements and their hosts: a major factor in genome size evolution? Chromosome Research, 19, 777–786. - PubMed
    1. Altschul, S.F. , Gish, W. , Miller, W. , Myers, E.W. & Lipman, D.J. (1990) Basic local alignment search tool. Journal of Molecular Biology, 215, 403–410. - PubMed
    1. Anderson, S.N. , Stitzer, M.C. , Brohammer, A.B. , Zhou, P. , Noshay, J.M. , O'Connor, C.H. et al. (2019) Transposable elements contribute to dynamic genome content in maize. The Plant Journal, 100, 1052–1065. - PubMed
    1. Badouin, H. , Gouzy, J. , Grassa, C.J. , Murat, F. , Staton, S.E. , Cottret, L. et al. (2017) The sunflower genome provides insights into oil metabolism, flowering and asterid evolution. Nature, 546, 148–152. - PubMed
    1. Bao, W. , Jurka, M.G. , Kapitonov, V.V. & Jurka, J. (2009) New superfamilies of eukaryotic DNA transposons and their internal divisions. Molecular Biology and Evolution, 26, 983–993. - PMC - PubMed

Publication types