. 2022 Sep 13;146(11):851-867.
doi: 10.1161/CIRCULATIONAHA.122.060454. Epub 2022 Aug 12.

Loss of Nuclear Envelope Integrity and Increased Oxidant Production Cause DNA Damage in Adult Hearts Deficient in PKP2: A Molecular Substrate of ARVC

Affiliations

Loss of Nuclear Envelope Integrity and Increased Oxidant Production Cause DNA Damage in Adult Hearts Deficient in PKP2: A Molecular Substrate of ARVC

Marta Pérez-Hernández et al. Circulation. .

Abstract

Background: Arrhythmogenic right ventricular cardiomyopathy (ARVC) is characterized by high propensity to life-threatening arrhythmias and progressive loss of heart muscle. More than 40% of reported genetic variants linked to ARVC reside in the PKP2 gene, which encodes the PKP2 protein (plakophilin-2).

Methods: We describe a comprehensive characterization of the ARVC molecular landscape as determined by high-resolution mass spectrometry, RNA sequencing, and transmission electron microscopy of right ventricular biopsy samples obtained from patients with ARVC with PKP2 mutations and left ventricular ejection fraction >45%. Samples from healthy relatives served as controls. The observations led to experimental work using multiple imaging and biochemical techniques in mice with a cardiac-specific deletion of Pkp2 studied at a time of preserved left ventricular ejection fraction and in human induced pluripotent stem cell-derived PKP2-deficient myocytes.

Results: Samples from patients with ARVC present a loss of nuclear envelope integrity, molecular signatures indicative of increased DNA damage, and a deficit in transcripts coding for proteins in the electron transport chain. Mice with a cardiac-specific deletion of Pkp2 also present a loss of nuclear envelope integrity, which leads to DNA damage and subsequent excess oxidant production (O2.- and H2O2), the latter increased further under mechanical stress (isoproterenol or exercise). Increased oxidant production and DNA damage is recapitulated in human induced pluripotent stem cell-derived PKP2-deficient myocytes. Furthermore, PKP2-deficient cells release H2O2 into the extracellular environment, causing DNA damage and increased oxidant production in neighboring myocytes in a paracrine manner. Treatment with honokiol increases SIRT3 (mitochondrial nicotinamide adenine dinucleotide-dependent protein deacetylase sirtuin-3) activity, reduces oxidant levels and DNA damage in vitro and in vivo, reduces collagen abundance in the right ventricular free wall, and has a protective effect on right ventricular function.

Conclusions: Loss of nuclear envelope integrity and subsequent DNA damage is a key substrate in the molecular pathology of ARVC. We show transcriptional downregulation of proteins of the electron transcript chain as an early event in the molecular pathophysiology of the disease (before loss of left ventricular ejection fraction <45%), which associates with increased oxidant production (O2.- and H2O2). We propose therapies that limit oxidant formation as a possible intervention to restrict DNA damage in ARVC.

Keywords: DNA damage; arrhythmogenic right ventricular dysplasia; nuclear envelope; oxidative stress; plakophilins; sirtuin 3.


Figures
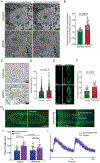
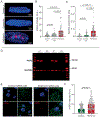
Figure 1:
Figure 1:. Structural and functional modifications of the nuclear envelope in ARVC patients and in PKP2-deficient heart cells.
A: TEM images of the nuclei of cardiac myocytes obtained from a control (top) and an ARVC patient (bottom) biopsy sample. Purple line marks the contour of the nuclear envelope. The ratio of the perimeter measured while accounting for invaginations over the perimeter measured without invaginations is shown in B. Each dot corresponds to 1 nucleus. Control n=28 nuclei from three control patients; ARVC n=28 nuclei from five ARVC patients. Columns/bars represent mean and standard deviation, respectively. Statistical test: Linear Mixed Effects Model. C: Histological sections obtained from a control (top) and an ARVC patient (bottom) biopsy Haematoxylin-stained to mark the nuclei. Images were digitally pre-processed by an experienced cardiac pathologist to remove nuclei from non-myocyte cells (see Supplementary Figure S4). D: Quantitative analysis of sections obtained from 3 controls and 5 ARVC patient samples showing larger nuclei area in the ARVC group. Columns/bars represent mean and standard deviation. Each dot corresponds to 1 nucleus. Statistical test: Generalized Linear Mixed Effects Model. E: Confocal stacked immunofluorescence images of laminB1, marking the nuclear envelope of control (top) and of PKP2-deficient myocytes obtained from PKP2cKO mice. Top images show a single plane, while bottom images display the whole stack. Notice the increased invaginations in the PKP2cKO nuclei. Quantitative analysis of total nuclear laminB1 intensity is shown in F. Intensity is measured between 0 and 255. Each symbol represents one nucleus. Control, n=42 nuclei from N=4 mice; PKP2cKO , n=42 nuclei from N=4 mice. Columns and bars represent mean and standard deviation values, respectively. Statitical test: Generalized Linear Mixed Effects Model. G: Line confocal Ca2+ imaging of the nuclear and perinuclear region of murine cardiomyocytes from control and PKP2cKO myocytes. Ga: Image of the nucleus of a control myocyte stained with the Ca2+ indicator Fluo-8. The position of the line scan is indicated by the white line in the middle and a time-space plot of the fluorescence is presented in the right. The average time to upstroke measured from the subnucleolemmal and from the central region of the nucleus are shown in Gb and examples of the transients are shown in Gc. In Gb and Gc, blue represents data/traces from the subnucleolemmal and purple from the central regions. Number of nuclei measured are indicated in the columns. Data collected from Controls, n=28 cells, N=3 mice; PKP2cKO, n=32 cells, N=3 mice. Columns indicate mean and bars, standard deviation of the mean. P values indicated by the horizontal bars. Statistical test: Linear Mixed Effects Model.
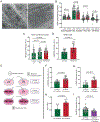
Figure 2:
Figure 2:. γH2AX in cardiac myocytes deficient in PKP2.
A: Representative images of adult murine cardiac myocyte nuclei from control left and right ventricular myocytes (top and middle) and from a PKP2cKO myocyte, immunostained for γH2AX (red) and with DAPI (blue) as a nuclear marker. Quantitative analysis of γH2AX intensity is shown in B and quantification of the area occupied by the speckles formed by γH2AX is shown in C. In B and C each symbol represents data from one nucleus. Control LV n=52 nuclei, N=4 mice; Control RV n=46 nuclei, N= 4 mice; and PKP2cKO n=60 nuclei, N= 6 mice. P values as per Generalized Linear Mixed Effects Model are indicated in the plot. Panels D-F show data from human induced pluripotent stem cell-derived cardiomyocytes (hiPSC-CMs). D: Western blot for PKP2 obtained from cells either Control hiPSC-CMs or after PKP2 KO. E: Representative images obtained from Control and PKP2 KO hiPSC-CMs expressing α-actinin -GFP (green) and stained for DAPI (blue) and γH2AX (red). F: Quantitative analysis of γH2AX intensity obtained from 55 control and 62 PKP2KO cells from 3 separate batches. Each symbol represents one nucleus. Horizontal bar indicates statistical significance, as determined by a Mann-Whitney test.
Figure 3:
Figure 3:. Differential proteomics and transcriptomics analyses of data from human heart biopsies from ARVC patients and healthy relatives (control).
A: Number of proteins identified (red) and quantified (blue) from proteomics measurements from five ARVC and three control heart samples. B: Volcano plot representation of protein abundances in ARVC patient hearts compared to controls. All points represent a protein. The negative logarithm (base 10) of LIMMA based empirical Bayes moderated test statistics derived p-value is shown as a function of logarithmic (base 2) ratios of protein intensities in ARVC patients relative to controls. Yellow points highlight proteins of the intercalated disc and the mitochondrial NAD+-dependent deacetylase Sirt3 (downregulated in ARVC) as well as desmin (Des) and Tgfb1 (upregulated in ARVC). C: Hallmark pathway analysis underrepresented (negative numbers) or over-represented (positive numbers) in ARVC hearts. Proteins in the “reactive oxygen species” pathway are highlighted, and individual data points illustrated by the heatmap on the right. D: Hallmark pathway analysis from transcriptomics data obtained from the same patients. Same conventions as in C; notice consistency with proteomics data in upregulation of apoptosis and DNA damage response pathways, and downregulation of oxidative phosphorylation. E: Analysis of the differential proteomics dataset for proteins reported as part of DNA repair hotspots. Abundance differences for all proteins part of the repair hotspots in ARVC hearts compared to controls are shown. Details are highlighted for proteins with increased abundances in hearts of ARVC patients.
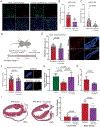
Figure 4:
Figure 4:. Desmin abundance/localization, nuclear morphology and DNA damage response under conditions of mechanical stress in PKP2 deficient adult ventricular myocytes.
A: Stochastic optical reconstruction microscopy (STORM) image of an adult ventricular myocyte stained for Desmin (green) and N-cadherin as marker of cell end (red). Yellow-boxed area is enlarged to the right. Distances from Desmin to nearest N-cadherin cluster were measured. Columns indicate mean and bars, standard deviation of the mean. The complete data distribution is presented in Supplemental Figure 8A. The mean distance is significantly greater in PKP2cKO cells. Statistical test: Generalized Linear Mixed Effects Model. Control: n= 2265 clusters from 22 images, N=4 mice. PKP2cKO: n=2398 clusters from 26 images, N =5 mice. B: STORM image of an adult ventricular myocyte stained for Desmin (green) and LaminB1 as marker of the nuclear envelope (blue). We measured the distances from Desmin to the nearest LaminB1 cluster. Columns indicate mean and bars, standard deviation of the mean. The mean distance is significantly greater in PKP2cKO cells. Statistical test: Generalized Linear Mixed Effects Model. Control: n=3901 clusters from 15 images, N=3 mice. PKP2cKO: n=4202 clusters from 16 images, N=4 mice. C: Measurements of nuclear circularity from DAPI stained control and PKP2cKO myocytes. Nuclear circularity was measured as the ratio nuclear width/nuclear length of Control LV (n= 52 nuclei, N=4 mice), Control RV (n= 43 nuclei, N=4 mice) and PKP2cKO (n=60 nuclei, N=6 mice) myocytes. Statistical test: Generalized Linear Mixed Effects Model. D: Timeline of colchicine experiment: osmotic pumps containing either colchicine (0.4 mg/kg/d) or control vehicle (saline) were intraperitoneally inserted through a small abdominal incision, in PKP2cKO mice at 7 days post-TAM (7 dpi). Pumps were maintained for 14 days. E: Quantitative analysis of total nuclear laminB1 intensity from colchicine or vehicle-treated mice. Intensity is measured between 0 and 255. Each symbol represents one nucleus. PKP2cKO, n=46 nuclei from N=4 mice; PKP2cKO+colchicine, n=48 nuclei from N=4 mice. Columns and bars represent mean and standard deviation values, respectively. Statistical test: Linear Mixed Effects Model. Representative images of LaminB1 are shown on the right. F: DAPI (blue) and γH2AX staining (red) of nuclei from cardiomyocytes isolated from PKP2cKO hearts subjected to boluses of Isoproterenol or vehicle. Quantitative analysis of γH2AX intensity is presented in the left. Numbers of nuclei/mice analyzed were 44/3 for PKP2cKO and 37/3 for PKP2cKO+Isoproterenol. Statistical Test: Linear Mixed Effects Model. G: Quantitative analysis of γH2AX intensity from nuclei obtained from mice sedentary or subjected to a six-week treadmill running program. γH2AX intensity from ventricular myocytes of sedentary control (n=31 nuclei, N=3 mice), exercised control (n=57 nuclei, N=4 mice), sedentary PKP2cKO (n=76 nuclei, N=4 mice) and exercised PKP2cKO mice (n=82 nuclei, N=5 mice) are shown. Statistical significance is reported in the figure as evaluated by Linear Mixed Effects Model (Control Sedentary vs Control Exercise) or Generalized Linear Mixed Effects Model (PKP2cKO Sedentary vs PKP2cKO Exercise).
Figure 5:
Figure 5:. Mitochondrial morphology, function and oxidant production in PKP2-deficient hearts/myocytes.
A: TEM images obtained from a right ventricular septal biopsy tissue collected from an ARVC patient. Notice the large accumulation of mitochondria within the cells. B: Seahorse oxygen consumption rates (OCRs) were measured in isolated adult cardiomyocytes from control and PKP2cKO mice. Numbers of mice/recordings analyzed were, for control, N=3 mice; n=56 recordings and for PKP2cKO, N=3 mice; n=61 recordings. Columns and bars represent mean and standard deviation values, respectively. Statistical test for basal respiration, proton leak and ATP-linked: Generalized Linear Mixed Effects Model. Statistical test for maximal respiration: Linear Mixed Effects Model. C: Quantitative analysis of superoxide radical anion radical (O2•−) formation in MitoSOX-loaded ventricular myocytes dissociated from control right and left ventricular tissue (control LV; control RV) and from a PKP2cKO heart. Numbers of cells/mice analyzed were for control (N=5 mice; n=64 LV; n=50 RV) and PKP2cKO (N=3 mice; n=37 cells). Statistical test: Linear Mixed Effects Model. D: Quantitative analysis of oxidant levels measured in cellROX-loaded hiPSC-CMs (n=23 images, 3 separate batches) and PKP2 KO hiPSC-CMs (n=22 images, 3 separate batches) (measured only in the GFP+ cells). Statistical test: Student’s t-test. Each symbol represents one cell; columns indicate average values and bars, standard deviation. E: Diagram explaining the transfer media experiment in hiPSC-CMs. Figure created with BioRender.com. F: Average cellROX intensity recorded from control hiPSC-CMs that received conditioned media from other control cells (left column; CT-CT), or from PKP2KO cells (middle column; CT-KO). Each symbol represents one image; n= 27 and 32 images analyzed for CT-CT and CT-KO respectively from 4 separate bacthes. Statistical test: Student’s t-test. G: Same experimental protocol as in F, but cells were fixed and stained for γH2AX. Each symbol represents one cell; n=27 and 21 cells, analyzed for CT-CT and CT-KO respectively, from 3 separate batches. Statistical test: Student’s t-test. H: Measurement of H2O2 concentration in the conditioned media supernatant collected from culture dishes containing hiPSC-CMs control (left column, n=8 culture dishes run in triplicates) or PKP2KO hiPSC-CMs (right column, n=9 culture dishes run in triplicates). Statistical test: Student’s t-test I: Quantitative analysis of oxidant levels in cellROX-loaded hiPSC-CMs incubated with the soluble fraction of the medium from PKP2KO hiPSC-CMs culture dish treated either with catalase (10 μmol/L; right column) or with vehicle (left column). Each symbol represents one cell; n=44 from 4 separate batches analyzed for each condition. Statistical test: Mann-Whitney Test. For all graphs, columns indicate average values and bars, standard deviation.
Figure 6:
Figure 6:. Honokiol exposure to PKP2KO hiPSC-CMs and Honokiol treatment of PKP2cKO mice reduces oxidant levels, DNA damage phenotypes and prevents right ventricular remodeling.
A. Representative confocal images of PKP2 KO hiPSC-CMs stained with cellROX (red) and MitoTracker (blue) expressing α-actinin-GFP (green), with and without 10 μmol/L Honokiol treatment for 24 hours. MitoTracker was used to identify mitochondria and cellROX as an indicator of oxidant production. Quantitative analysis of cellROX intensity is shown in B. hiPSC-CM PKP2 KO, n=18 images. + Honokiol, n=20 images; from 3 separate batches. Statistical test: Mann-Whitney test. C. Quantitative analysis of γH2AX intensity of hiPSC-CM PKP2 KO, n=170 nuclei. + Honokiol, n=193 nuclei; from 3 separate batches. Statistical test: Mann-Whitney test. D: Experimental timeline for chronic treatment of PKP2cKO mice with Honokiol: Honokiol (2mg/kg/day) or control vehice (saline) was intraperitoneally injected into PKP2cKO mice for 14 consecutive days. Treatment started at 7 days post-TAM (dpi) and at 21 dpi, mice were subjected to echocardiography and hearts extracted for histology and cellular experiments. E: Representative confocal images of PKP2cKO ventricular myocytes stained with MitoSOX (red) and MitoTracker (blue) are shown. Quantitative analysis of MitoSOX intensity is shown in the bargraph on the left. Numbers of cells/mice were 33/3 for control and 33/3 for PKP2cKO. Statistical test: Linear Mixed Effects Model.. F. Same experimental protocol as in E, but cells were fixed and immunostained for γH2AX (red) and DAPI (blue). PKP2cKO n=36 cells, N=3 mice; +Honokiol n=32 cells, N=3 mice. Quantification of the γH2AX intensity is shown in the bargraph on the left. Statistical test: Linear Mixed Effects Model. G. SIRT3 activity was measured in vitro in isolated cardiac mitochondria from control, PKP2cKO and Honokiol treated PKP2cKO mice (N=7, 6 and 6 mice, respectively). Statistical test: one way ANOVA Tukey’s multiple comparisons test. H. Right ventricular (RV) free wall area measurements by B-mode long axis echocardiography, in PKP2cKO mice with and without chronic Honokiol treatment (N=6 mice for PKP2cKO and 6 for PKP2cKO+Honokiol). Statistical test: Student’s t test. I. Representative images of Masson Trichrome stained four-chamber view sections of PKP2cKO and PKP2cKO+Honokiol hearts. Quantitative analysis of percentage collagen is shown on the right. N=6 mice for PKP2cKO and N=6 for PKP2cKO+Honokiol. Statistical test: Student’s t-test. For all graphs, columns indicate average values and bars, standard deviation.
Figure 7:
Figure 7:. Working model of cardiomyocyte remodeling in PKP2-dependent arrhythmogenic right ventricular cardiomyopathy (ARVC).
Our data show that a PKP2 deficit in an adult heart disrupts nuclear envelope morphology and its barrier function, leading to DNA damage and altered transcription. We further show that this phenomenon is facilitated by exercise or increased adrenergic tone, and it is associated with a separation of the intermediate filament desmin from its anchoring points both at the cell end and at the nuclear envelope. We also demonstrate that, in parallel, transcriptional reprogramming includes reduced expression of electron transport chain proteins and consequent enhanced formation of superoxide radical anions, O2•− yielding increased H2O2. We report that the H2O2 extruded from PKP2 deficient myocytes can cause DNA damage in distal PKP2-expressing cells and show that treatment with Honokiol, a natural product that among its effects is to activate the mitochondrial deacetylase Sirt3, reduces oxidant formation and DNA damage in myocytes deficient in PKP2, suggesting that reduction of oxidant levels can be considered a therapeutic goal for patients with ARVC.

Comment in

References

    1. Delmar M, McKenna WJ. The cardiac desmosome and arrhythmogenic cardiomyopathies: from gene to disease. Circ Res 2010;107, 700–714. - PubMed
    1. Corrado D, Link MS, Calkins H. Arrhythmogenic Right Ventricular Cardiomyopathy. N Engl J Med 2017;376, 61–72. - PubMed
    1. Austin KM, Trembley MA, Chandler SF, Sanders SP, Saffitz JE, Abrams DJ, Pu WT. Molecular mechanisms of arrhythmogenic cardiomyopathy. Nat Rev Cardiol 2019;16, 519–537. - PMC - PubMed
    1. Groeneweg JA, Bhonsale, James CA, te Riele AS, Dooijes, Tichnell, Murray, Wiesfeld AC, Sawant AC, Kassamali et al. Clinical Presentation, Long-Term Follow-Up, and Outcomes of 1001 Arrhythmogenic Right Ventricular Dysplasia/Cardiomyopathy Patients and Family Members. Circ Cardiovasc Genet 2015;8, 437–446. - PubMed
    1. Cerrone M, Remme CA, Tadros R, Bezzina CR, Delmar M. Beyond the One Gene-One Disease Paradigm: Complex Genetics and Pleiotropy in Inheritable Cardiac Disorders. Circulation 2019;140, 595–610. - PMC - PubMed

Publication types