. 2022 Nov 8;240(0):114-126.
doi: 10.1039/d2fd00081d.

Bridging length scales from molecules to the whole organism by cryoCLEM and cryoET

Affiliations

Bridging length scales from molecules to the whole organism by cryoCLEM and cryoET

Megan Lovatt et al. Faraday Discuss. .

Abstract

Resolving atomic structures of isolated proteins has uncovered mechanisms and fundamental processes in biology. However, many functions can only be tested in the context of intact cells and tissues that are many orders of magnitude larger than the macromolecules on which they depend. Therefore, methods that interrogate macromolecular structure in situ provide a means of directly relating structure to function across length scales. Here, we developed several workflows using cryogenic correlated light and electron microscopy (cryoCLEM) and electron tomography (cryoET) that can bridge this gap to reveal the molecular infrastructure that underlies higher order functions within cells and tissues. We also describe experimental design considerations, including cryoCLEM labelling, sample preparation, and quality control, for determining the in situ molecular architectures within native, hydrated cells and tissues.


Conflict of interest statement

There are no conflicts of interest to declare.

Figures
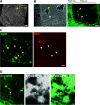
Fig. 1
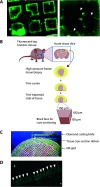
Fig. 1. CryoCLEM of plunge-frozen synaptosome samples prepared from Psd95GFP/GFP knockin mouse forebrain. (A and B) Using cryoFM to gauge ice thickness on EM grids. (A) Brightfield image showing the EM grid square. Yellow arrowhead, ice cracks indicative of non-vitreous sample. Scalebar, 6 μm. (B) Grid square with regions of thin ice. Left and right panels correspond to brightfield and GFP fluorescence channels, respectively. Regions of the grid square with thick ice are evident from increased autofluorescence of the holey carbon foil. White and yellow arrowheads, fluorescence region of interest within a hole of the carbon foil suitable for cryoET and surface ice contamination, respectively. Scalebar, 6 μm. (C) Detection of non-specific cryoFM signals by fluorescence in multiple different channels. Left and right panels, GFP and RFP channels, respectively. White and yellow arrowheads, GFP only puncta and non-specific autofluorescence or plastic contaminant, respectively. Scalebar, 6 μm. (D) CryoCLEM mapping of PSD95-GFP. Left, middle and right panels, GFP fluorescence channel, medium magnification montage electron micrograph, and merged channels, respectively. Images were aligned using holes evident from autofluorescence of the carbon foil as fiducial markers. White arrowhead indicates PSD95-GFP puncta mapped from cryoFM to the cryoEM image. Scalebar, 1 μm.
Fig. 2
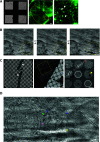
Fig. 2. Sample preparation of cells and tissues on EM grids. (A) Dorsal root ganglion primary neurons grown on the EM grid and incubated with Alexa fluor 488-conjugated isolectin-B4 before plunge-freezing. Left panel, neurites grew across multiple grid squares. Scalebar, 20 μm. Yellow hatched box shown enlarged in right panel. White arrowheads, thin neurites traversing holes in the carbon foil. Scalebar, 1 μm. (B) Schematic indicating the workflow for preparing fresh adult mammalian brain for cryo-sections from high pressure-frozen brain tissue. Mouse brains were dissected and 100 μm thick acute slices were collected on a vibratome. 2 mm diameter biopsy samples were transferred to gold carriers and high-pressure frozen. Carriers were trimmed to prepare a trapezoid block of tissue, from which 150 nm thick cryo-sections were collected. (C) Image showing transfer of 150 nm thick cryo-section tissue ribbon from the diamond cutting knife to an EM grid. (D) CryoFM image of mouse brain cryo-section tissue ribbon. White arrowheads, individual cryo-sections within the tissue ribbon. Scalebar, 20 μm.
Fig. 3
Fig. 3. CryoCLEM and cryoET of tissue cryo-sections. (A) CryoFM of Psd95GFP/GFP knockin mouse brain cortex cryo-sections on an EM grid. Left panel, brightfield image. Middle panel, GFP fluorescence. Yellow lariat, regions with good attachment of the tissue cryo-section to the EM grid indicated by GFP puncta in the same focal plane as the carbon foil. Scalebar, 20 μm. The dashed box shows the region enlarged in the right panel. Submicron sized puncta indicate the location of synapses within the tissue cryosection. Scalebar, 1 μm. (B) Electron micrographs showing partial devitrification of tissue cryo-sections. Each panel is related by a 2° tilt. Yellow circles, devitrified regions of ice evident from ice reflections appearing and disappearing from one tilt to the next. Scalebar, 100 nm. (C) Electron micrographs of cryo-section tissue ribbons from mouse brain. Left panel, low magnification montage of the EM grid showing tissue spanning multiple grid squares. Scalebar, 200 μm. Middle panel, medium magnification montage of grid squares on holey carbon foil. Scalebar, 20 μm. Yellow box, the region enlarged in the right panel. Yellow and red arrowheads indicate ice contamination and cutting damage from the knife, respectively. White circles, regions suitable for cryoET with minimal knife damage. Scalebar, 2 μm. (D) Tomographic slice of a mouse brain cryo-section showing in-tissue molecular architecture, including membranes, organelles and macromolecular complexes with light green, dark blue, pink, and purple arrowheads indicating a putative ribosome, the endoplasmic reticulum, an autophagosome intermediate, and a mitochondrion, respectively. Yellow arrowhead, low intensity voxels correspond to the tip of a ‘crevasse’ within the tissue caused by knife cutting damage. Scalebar, 50 nm.
Fig. 4
Fig. 4. Molecular architecture within an ultra-fresh adult mouse forebrain sample by cryoET. The tomographic slice shows subcellular compartments containing organelles and macromolecular complexes, including: purple, green, light blue, gold, red, magenta, and brown arrowheads indicating a mitochondrion, a vesicle, a multivesicular body, the cytoskeleton, the plasma membrane, 25 nm membrane-associated protein, and a cluster of small proteins on the plasma membrane, respectively. Scalebar, 100 nm.

Similar articles

Cited by

References

    1. Squire L. R. Dede A. J. O. Cold Spring Harbor Perspect. Biol. 2015;7:a021667. doi: 10.1101/cshperspect.a021667. - DOI - PMC - PubMed
    1. Miesenböck G. Kevrekidis I. G. Neuroscience. 2005;28:533–563. - PubMed
    1. Rajasethupathy P. Ferenczi E. Deisseroth K. Cell. 2016;165:524–534. doi: 10.1016/j.cell.2016.03.047. - DOI - PMC - PubMed
    1. Mayford M. Siegelbaum S. A. Kandel E. R. Cold Spring Harbor Perspect. Biol. 2012;4:a005751. - PMC - PubMed
    1. Webb R. H. Rep. Prog. Phys. 1996;59:427. doi: 10.1088/0034-4885/59/3/003. - DOI

Publication types

MeSH terms

Substances