Regional variations and temporal trends of childhood myopia prevalence in Africa: A systematic review and meta-analysis
- PMID: 35959749
- PMCID: PMC9804554
- DOI: 10.1111/opo.13035
Regional variations and temporal trends of childhood myopia prevalence in Africa: A systematic review and meta-analysis
Abstract
Purpose: To provide contemporary and future estimates of childhood myopia prevalence in Africa.
Methods: A systematic online literature search was conducted for articles on childhood (≤18 years) myopia (spherical equivalent [SE] ≤ -0.50D; high myopia: SE ≤ -6.00D) in Africa. Population- or school-based cross-sectional studies published from 1 Jan 2000 to 30 May 2021 were included. Meta-analysis using Freeman-Tukey double arcsine transformation was performed to estimate the prevalence of childhood myopia and high myopia. Myopia prevalence from subgroup analyses for age groups and settings were used as baseline for generating a prediction model using linear regression.
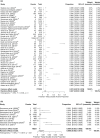
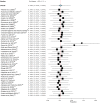
Results: Forty-two studies from 19 (of 54) African countries were included in the meta-analysis (N = 737,859). Overall prevalence of childhood myopia and high myopia were 4.7% (95% CI: 3.3%-6.5%) and 0.6% (95% CI: 0.2%-1.1%), respectively. Estimated prevalence across the African regions was highest in the North (6.8% [95% CI: 4.0%-10.2%]), followed by Southern (6.3% [95% CI: 3.9%-9.1%]), East (4.7% [95% CI: 3.1%-6.7%]) and West (3.5% [95% CI: 1.9%-6.3%]) Africa. Prevalence from 2011 to 2021 was approximately double that from 2000 to 2010 for all studies combined, and between 1.5 and 2.5 times higher for ages 5-11 and 12-18 years, for boys and girls and for urban and rural settings, separately. Childhood myopia prevalence is projected to increase in urban settings and older children to 11.1% and 10.8% by 2030, 14.4% and 14.1% by 2040 and 17.7% and 17.4% by 2050, respectively; marginally higher than projected in the overall population (16.4% by 2050).
Conclusions: Childhood myopia prevalence has approximately doubled since 2010, with a further threefold increase predicted by 2050. Given this trajectory and the specific public health challenges in Africa, it is imperative to implement basic myopia prevention programmes, enhance spectacle coverage and ophthalmic services and generate more data to understand the changing myopia epidemiology to mitigate the expanding risk of the African population.
Keywords: Africa; childhood; myopia; prevalence; systematic review and meta-analysis; time trends.
© 2022 The Authors. Ophthalmic and Physiological Optics published by John Wiley & Sons Ltd on behalf of College of Optometrists.
Conflict of interest statement
JL has received research grant funding support from Health Research Board (Ireland), Nevakar and CooperVision; has consultancy relationships with Dopavision, Kubota Vision, Ocuco and Ebiga Vision; has received honoraria from Thea Pharmaceuticals and Ocuco for lectures; has received equipment on loan from Topcon and CooperVision; has two patents pending (one in myopia management data analytics and one in biomonitoring for low‐dose atropine treatment in myopia) and is Director of Ocumetra, all in the field of myopia management. DIF has received research grant funding support from Health Research Board (Ireland), Nevakar and CooperVision; has consultancy or other relationships with Dopavision, Kubota Vision, Essilor, Johnson & Johnson, Thea Pharmaceuticals and Vivior; has received equipment on loan from Topcon and CooperVision; has two patents pending (one in myopia management data analytics and one in biomonitoring for low‐dose atropine treatment in myopia) and is Director of Ocumetra, all in the field of myopia management.
Figures


References
-
- Flaxman SR, Bourne RRA, Resnikoff S, Ackland P, Braithwaite T, Cicinelli MV, et al. Global causes of blindness and distance vision impairment 1990–2020: a systematic review and meta‐analysis. Lancet Glob Health. 2017;5:e1221–34. - PubMed
-
- Flitcroft DI. The complex interactions of retinal, optical and environmental factors in myopia aetiology. Prog Retin Eye Res. 2012;31:622–60. - PubMed
-
- Yokoi T, Ohno‐Matsui K. Diagnosis and treatment of myopic maculopathy. Asia Pacific J Ophthalmol. 2019;7:415–21. - PubMed
Publication types
MeSH terms
LinkOut - more resources
Full Text Sources

