. 2022 Oct;130(5):e12890.
doi: 10.1111/eos.12890. Epub 2022 Aug 12.

Effect of dentine site on resin and cement adaptation tested using X-ray and electron microscopy to evaluate bond durability and adhesive interfaces

Affiliations

Effect of dentine site on resin and cement adaptation tested using X-ray and electron microscopy to evaluate bond durability and adhesive interfaces

Arosha Tania Weerakoon et al. Eur J Oral Sci. 2022 Oct.

Abstract

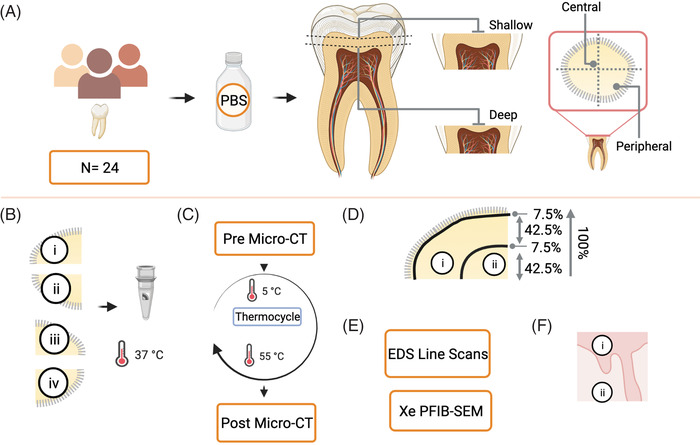
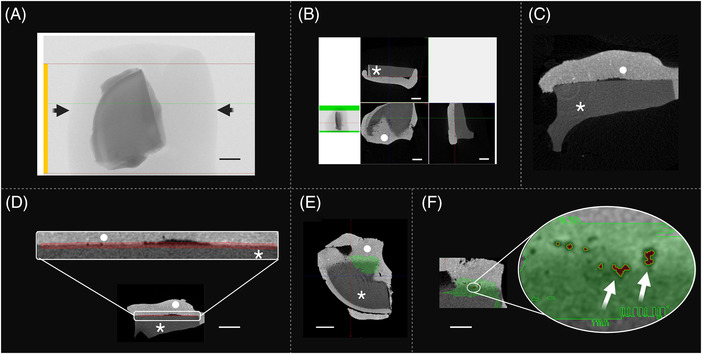
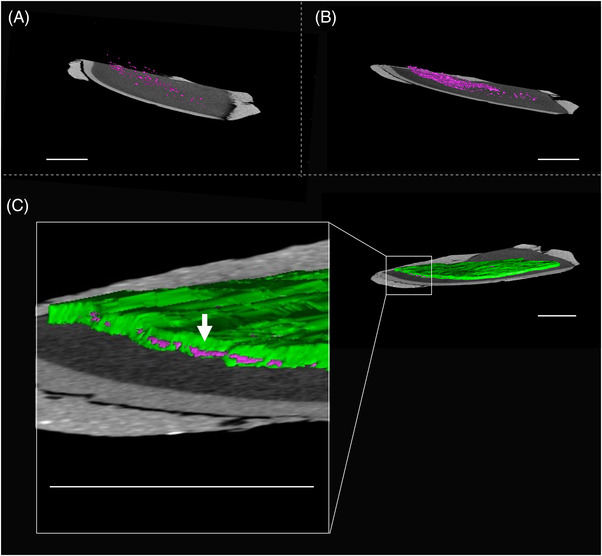
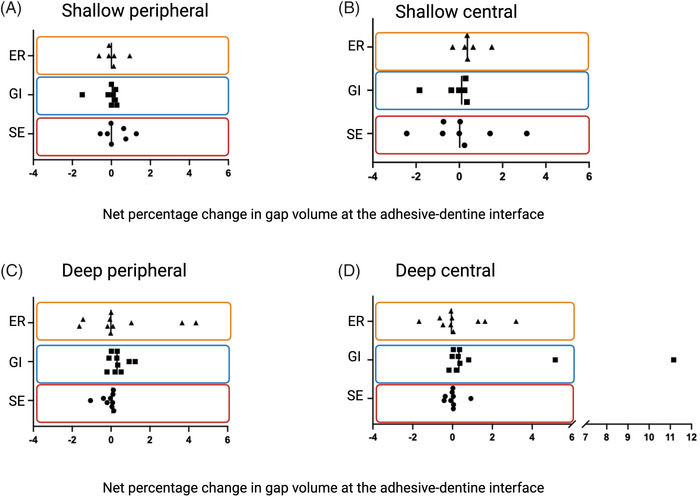
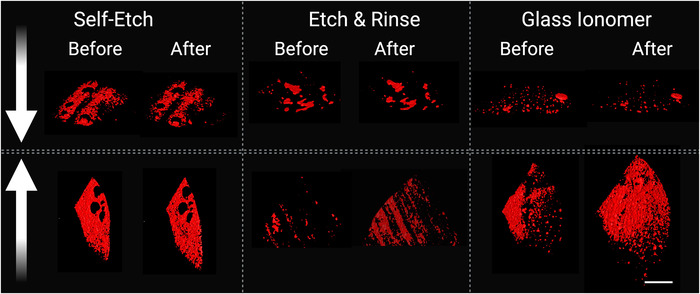
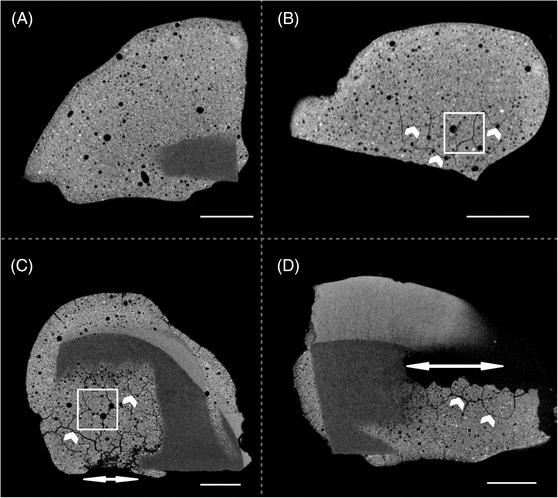
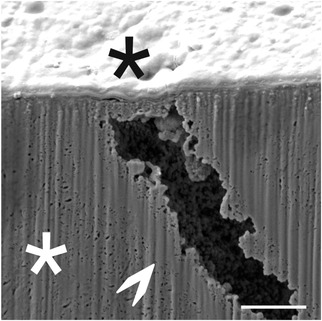
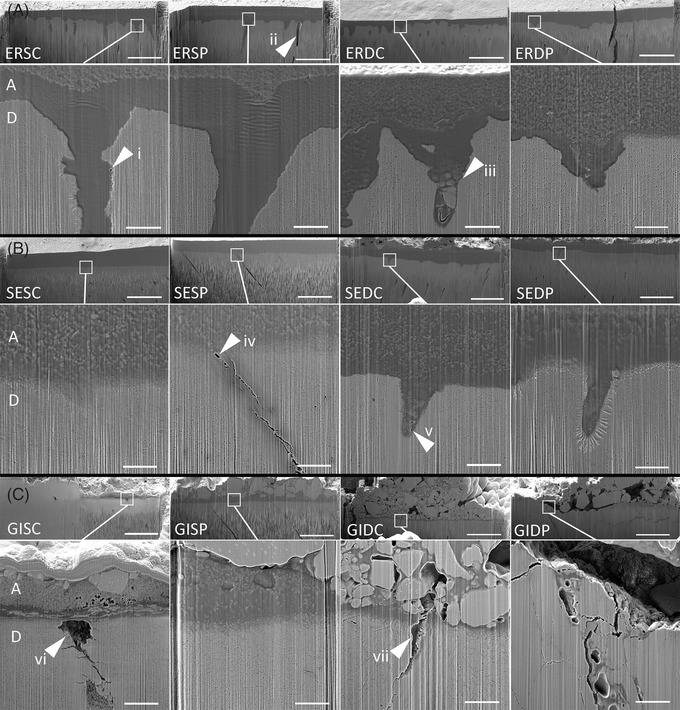
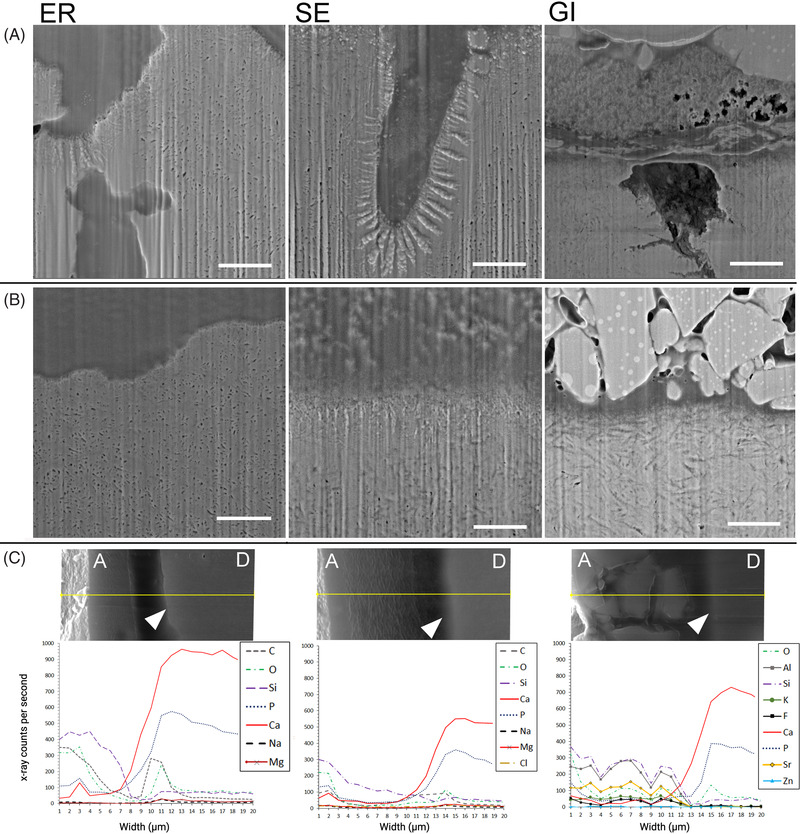
Glass ionomer (GI) cements and self-etch (SE) or universal adhesives after etching (ER) adapt variably with dentine. Dentine characteristics vary with depth (deep/shallow), location (central/peripheral), and microscopic site (intertubular/peritubular). To directly compare adhesion to dentine, non-destructive imaging and testing are required. Here, GI, ER, and SE adapted at different dentine depths, locations, and sites were investigated using micro-CT, xenon plasma focused ion beam scanning electron microscopy (Xe PFIB-SEM), and energy dispersive X-ray spectroscopy (EDS). Extracted molars were prepared to deep or shallow slices and treated with the three adhesives. Micro-CT was used to compare changes to air volume gaps, following thermocycling, and statistically analysed using a quantile regression model and Fisher's exact test. The three adhesives performed similarly across dentine depths and locations, yet no change or overall increases and decreases in gaps at all dentine depths and locations were measured. The Xe PFIB-SEM-milled dentine-adhesive interfaces facilitated high-resolution characterization, and element profiling revealed variations across the tooth-material interfaces. Dentine depth and location had no impact on adhesive durability, although microscopic differences were observed. Here we demonstrate how micro-CT and Xe PFIB-SEM can be used to compare variable dental materials without complex multi-stage specimen preparation to minimize artefacts.

Keywords: focused ion beam; humans; in vitro techniques; materials testing; surface properties.


Conflict of interest statement

All authors declare no conflict of interest.

Figures

FIGURE 1
FIGURE 1
Methods. (A) Sound human molars were collected and stored in phosphate buffered saline (PBS). Teeth were hemisectioned to locate the dentine‐enamel junction and pulp roof, and prepared to shallow (0.5–0.75 mm < dentine‐enamel junction) or deep (0.5–0.75 mm > pulp roof) segments. (B) Shallow and deep segments were quartered and restored with either (i) etch and rinse adhesive, (ii) self‐etch adhesive, or (iii) glass ionomer, or (iv) were left untreated as controls. Restored segments were stored in PBS‐filled Eppendorf tubes at 37°C. (C) At 1 wk post‐restoration, segments were micro‐CT‐scanned, thermocycled, and re‐scanned. (D) Horizontal representation of the regions of interest where 42% of the dentine radius was used to measure (i) peripheral and (ii) central dentine delineated by 7.5% inter‐area gaps (excluded from analysis). (E) Treated and control dentine segments were milled at the dentine (control) or dentine‐adhesive interface using a xenon plasma focused ion beam scanning electron microscope (Xe‐PFIB SEM) and energy dispersive X‐ray spectroscopy (EDS) line scans were collected across the dentine‐adhesive interface. (F) The dentine‐adhesive interface analysed in this study, formed between the (i) adhesive and (ii) dentine (intertubular and peritubular) layers
FIGURE 2
FIGURE 2
Stages of micro‐CT data processing. Asterisks identify dentine and white dots indicate resin composite. (A) Raw data were reconstructed using InstaRecon (InstaRecon) and NRecon (Bruker) by applying a back projection algorithm with reduced ring artefact reduction and correction for beam hardening. The tooth segment is enveloped in wax (black arrows). Scale bar = 1 mm. (B) The data sets were aligned using DataViewer (Bruker). Scale bar = 800 μm. (C) Data sets were converted to DICOM format using Dicomvertor (Bruker). (D) The DICOM slices were viewed using Inveon Research Workplace (Siemens). A 66 μm diameter round paintbrush tool delineated two‐dimensional regions of interest along the dentine‐adhesive interface (red line). Scale = 1mm. (E) Example of a ‘central’ dentine data set (green region). Scale bar = 1 mm. (F) Example of the set ‘air threshold’ used to determine the gaps (white arrows) at the interface. Scale bar = 500 μm
FIGURE 3
FIGURE 3
Surface renders of micro‐CT scanned teeth sections exhibiting etch and rinse adhesive adapted to deep outer dentine. Scale bars = 1 mm. (A) A surface render of a micro‐CT scan shows the volume of air (pink) at the interface before thermocycling. (B) A surface render of a micro‐CT scan shows the volume of air (pink) at the interface post‐thermocycling. (C) The magnified surface render of the volume of air (pink, white arrow) visualized within the entire volume of interest (green) in peripheral dentine
FIGURE 4
FIGURE 4
Strip plots of raw micro‐CT data before adjusting for baseline, show net percentage changes in air gap volume at the adhesive interfaces for dentine at different depths and locations treated with etch and rinse (ER), glass ionomer (GI), and self‐etch (SE). Each graph shows the vertical line proximal to 0, which is the average baseline measure. Data points located close to the baseline represent no change between pre‐ and post‐thermocycling data. Data points that sit on the left‐hand side of the baseline represent an overall negative change (reduced interface gaps). Data points that sit on the right‐hand side of the baseline represent an overall increase in the air volume gap. The coloured boxes (yellow for ER, blue for GI, and red for SE) enclose the raw data included in the final statistical analyses; data points outside the boxes were excluded. (A) Shallow peripheral. (B) Shallow central. (C) Deep peripheral. (D) Deep central
FIGURE 5
FIGURE 5
Surface render of air gap changes scanned using micro‐CT that compares the same sites at the interfaces of the three adhesives before and after thermocycling. The top row of images represents regions of interest where the air gap decreased from baseline after thermocycling (white downward arrow). The lower row shows an overall increase in the air gaps at the interface when compared with baseline (white upward arrow). Scale bar = 600 μm
FIGURE 6
FIGURE 6
Representative images of post‐thermocycling micro‐CT scans of glass ionomer (GI)‐restored tooth segments that depict varying outcomes. Scale bars = 1 mm. (A) Normal GI appearance. (B) Small cracks (white arrows) extending through the voids in GI appear to form a network that unites at larger low density voids (within the white square). (C) Moderate cracking within the material with multiple networks of cracks that unite. (D) Severe cracking where the GI has separated from dentine (double‐ended arrow).
FIGURE 7
FIGURE 7
Scanning electron microscopic image of an untreated dentine tubule prepared using a xenon plasma focused ion beam. A smear layer and plug obstruct the tubule entrance (black asterisk). Intertubular dentine (white asterisk) separates peritubular dentine that borders the tubule wall interface (white arrowhead). Scale bar = 1 μm
FIGURE 8
FIGURE 8
Xenon plasma focused ion beam scanning electron microscopy of prepared cross‐sections from shallow and deep dentine treated with either (A) etch and rinse (ER) adhesive, (B) self‐etch (SE) adhesive, or (C) glass ionomer (GI). In each panel, lower magnification cross‐section is shown in the top micrograph. A white box locates the high magnification micrograph to show the adhesive (labelled ‘A’) and dentine (labelled ‘D’) interface. The dentine sites treated with the adhesives are represented as shallow central (ERSC, SESC, GISC), shallow peripheral (ERSP, ERSP, GISP), deep central (ERDC, SEDC, GIDC), and deep peripheral (ERDP, SEDP, GIDP). White arrowheads point to (i) a gap at the ERSC tubule interface; (ii) incomplete ERSP resin penetration within a tubule; (iii) incomplete ERDC smear layer removal; (iv and v) gaps within the adhesive in ERSP and SEDC; and (vi and viii) incomplete smear plug removal for GISC and GIDC. Lower magnification cross‐section scale bars = 20 μm. Higher magnification dentine‐adhesive interface scale bars = 2 μm
FIGURE 9
FIGURE 9
Dentine‐adhesive interfaces prepared using a xenon plasma focused ion beam scanning electron microscope at the peritubular and intertubular interfaces. Columns indicate dentine treated with etch and rinse (ER), self‐etch (SE), or glass ionomer (GI), shown in rows for the (A) peritubular interface, (B) intertubular interface, and (C) energy dispersive X‐ray spectroscopy line scan results showing counts per second at discrete intervals every 1 μm for 20 μm across the adhesive‐dentine interface (white arrowheads in upper row of images), comprised of layers marked as adhesive (‘A’) and dentine (‘D’). Scale bars = 1 μm.

Similar articles

Cited by

References

    1. Chiba Y, Sunada N, Inoue N, Kawamoto R, Tonegawa M, Iwasa M, et al. Effect of operator variability on dentin bond strength of two‐step adhesive system. Adhes. Dent. 2007;25:239‐43.
    1. Perdigão J. Dentin bonding‐variables related to the clinical situation and the substrate treatment. Dent Mater 2010;26:e24‐37. - PubMed
    1. Perdigão J. Current perspectives on dental adhesion:(1) Dentin adhesion–not there yet. Jpn Dent Sci Rev. 2020;56:190‐207. - PMC - PubMed
    1. Nicholson JW, Sidhu SK, Czarnecka B. Enhancing the mechanical properties of glass‐ionomer dental cements: a review. Materials 2020;13:2510. 10.3390/ma13112510 - DOI - PMC - PubMed
    1. Tsujimoto A, Shimatani Y, Nojiri K, Barkmeier WW, Markham MD, Takamizawa T, et al. Influence of surface wetness on bonding effectiveness of universal adhesives in etch‐and‐rinse mode. Eur J Oral Sci 2019;127:162‐9. - PubMed