

Clean environment index: A new approach for litter assessment
- PMID: 35959868
- PMCID: PMC9925890
- DOI: 10.1177/0734242X221117093
Clean environment index: A new approach for litter assessment
Abstract
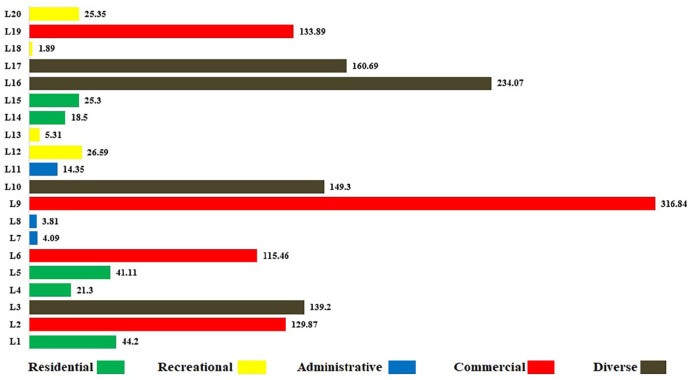
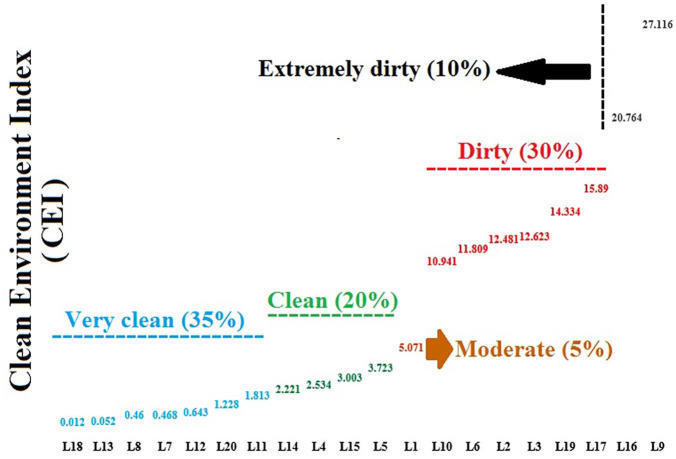
Littered waste is one of the ubiquitous problems in urban environments. In this study, urban environmental pollution was evaluated for the first time using a new developed index. The findings indicated that cigarette butts with an average 58% are the largest share in the composition of littered waste. In addition, the numbers of littered wastes throughout the study area had a spatial variation. According to clean environment index (CEI), the entire study area was found to be in a moderate status. However, 40% of the study areas were classified in a dirty and extremely dirty status. Comparison of the studied urban land-uses showed that residential land use with CEI equal to 3.38 is interpreted in the clean status, while commercial land use with CEI equal to 15.05 can be classified in the dirty status. The application of CEI has a good capability to assess littered waste; this index can be employed to evaluate the pollution of urban sidewalks and other environments such as beaches.
Keywords: Littered waste; clean environment index; environmental status; waste management.
Conflict of interest statement
Figures
Similar articles
-
Development a new index for littered waste assessment in different environments: A study on coastal and urban areas of northern Iran (Caspian Sea).Mar Pollut Bull. 2021 Oct;171:112684. doi: 10.1016/j.marpolbul.2021.112684. Epub 2021 Jul 13. Mar Pollut Bull. 2021. PMID: 34271504
-
Study of littered wastes in different urban land-uses: An 6 environmental status assessment.J Environ Health Sci Eng. 2020 Aug 31;18(2):915-924. doi: 10.1007/s40201-020-00515-7. eCollection 2020 Dec. J Environ Health Sci Eng. 2020. PMID: 33312612 Free PMC article.
-
Cigarette butt littering consequences: a study of pollution rate on beaches and urban environments.Environ Sci Pollut Res Int. 2022 Jun;29(30):45396-45403. doi: 10.1007/s11356-022-19155-5. Epub 2022 Feb 10. Environ Sci Pollut Res Int. 2022. PMID: 35143006
-
A critical review of the issue of cigarette butt pollution in coastal environments.Environ Res. 2019 May;172:137-149. doi: 10.1016/j.envres.2019.02.005. Epub 2019 Feb 4. Environ Res. 2019. PMID: 30782533 Review.
-
Cigarette butts in Vietnam's marine environments: From pollution to solutions and prospects.Sci Total Environ. 2024 Dec 20;957:177484. doi: 10.1016/j.scitotenv.2024.177484. Epub 2024 Nov 17. Sci Total Environ. 2024. PMID: 39528218 Review.
Cited by
-
A comparative study of indexes used for litter pollution assessment in urban and public environments.Heliyon. 2024 Jan 19;10(3):e24954. doi: 10.1016/j.heliyon.2024.e24954. eCollection 2024 Feb 15. Heliyon. 2024. PMID: 38317978 Free PMC article. Review.
-
Study of the litter in the urban environment as primary and secondary microplastics sources.Sci Rep. 2024 Dec 30;14(1):31645. doi: 10.1038/s41598-024-80611-y. Sci Rep. 2024. PMID: 39738160 Free PMC article.
-
The fate of leaked heavy metals in the urban environment under different persistence and precipitation scenarios.Sci Rep. 2024 Apr 9;14(1):8343. doi: 10.1038/s41598-024-59057-9. Sci Rep. 2024. PMID: 38594514 Free PMC article.
-
The first using developed clean environment index for assessment of the environment pollution caused by littering behavior.Sci Rep. 2025 May 30;15(1):19102. doi: 10.1038/s41598-025-04145-7. Sci Rep. 2025. PMID: 40447692 Free PMC article.
-
EcoDetect-YOLO: A Lightweight, High-Generalization Methodology for Real-Time Detection of Domestic Waste Exposure in Intricate Environmental Landscapes.Sensors (Basel). 2024 Jul 18;24(14):4666. doi: 10.3390/s24144666. Sensors (Basel). 2024. PMID: 39066064 Free PMC article.
References
-
- Al-Khatib IA. (2009) Children’s perceptions and behaviour with respect to glass littering in developing countries: A case study in Palestine’s Nablus district. Waste Management 29: 1434–1437. - PubMed
-
- Ariza E, Jiménez JA, Sardá R. (2008) Seasonal evolution of beach waste and litter during the bathing season on the Catalan coast. Waste Management 28: 2604–2613. - PubMed
-
- Ariza E, Leatherman SP. (2012) No-smoking policies and their outcomes on US beaches. Journal of Coastal Research 28: 143–147.
-
- Asensio-Montesinos F, Anfuso G, Ramírez MO, et al. (2020) Beach litter composition and distribution on the Atlantic coast of Cádiz (SW Spain). Regional Studies in Marine Science 34: 101050.
-
- Asensio-Montesinos F, Anfuso G, Williams AT. (2019) Beach litter distribution along the western Mediterranean coast of Spain. Marine Pollution Bulletin 141: 119–126. - PubMed
MeSH terms
Substances
LinkOut - more resources
Full Text Sources
