. 2022 Sep;36(9):e22476.
doi: 10.1096/fj.202200045R.

Enhanced development of functional human NK cells in NOD-scid-IL2rgnull mice expressing human IL15

Affiliations

Enhanced development of functional human NK cells in NOD-scid-IL2rgnull mice expressing human IL15

Ken-Edwin Aryee et al. FASEB J. 2022 Sep.

Abstract

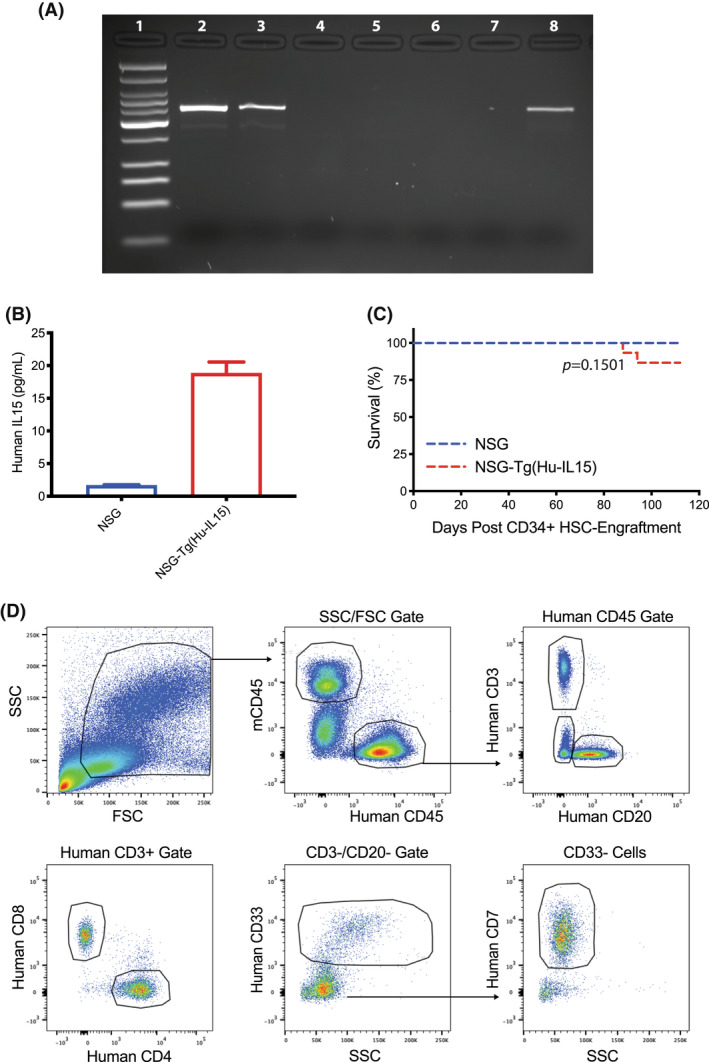
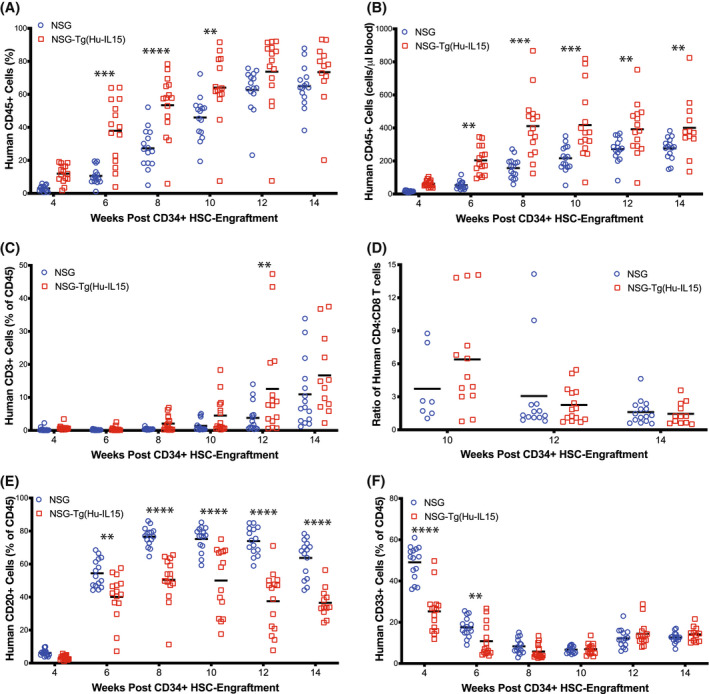
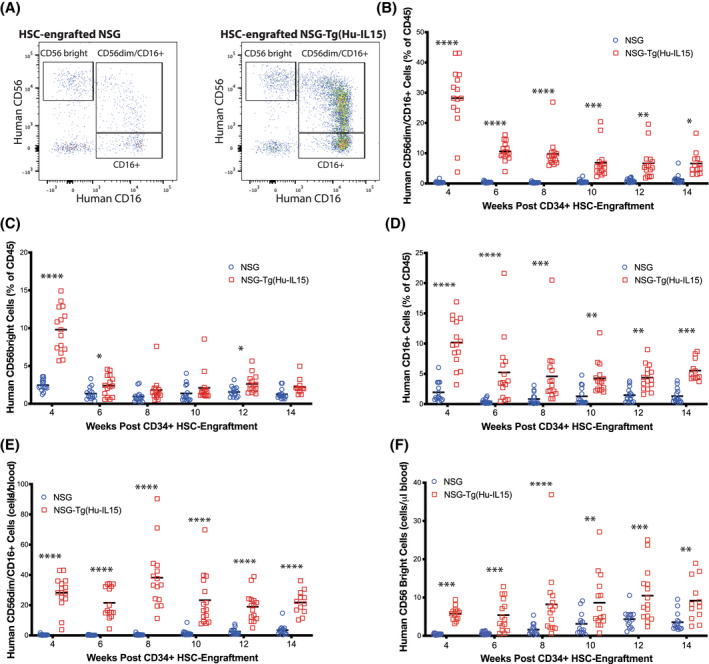
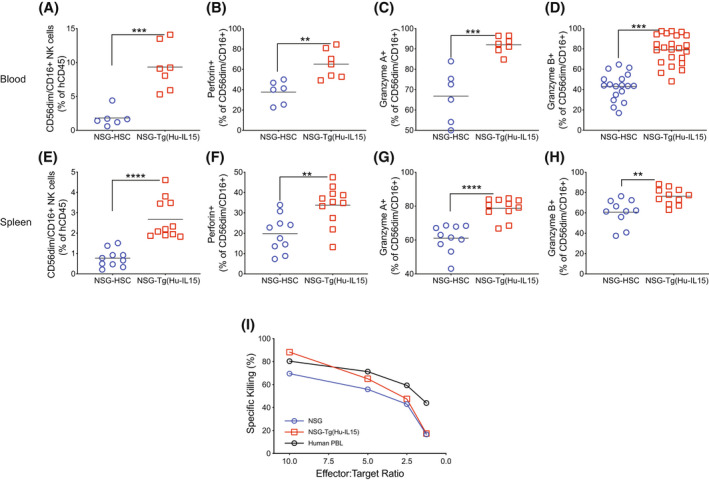
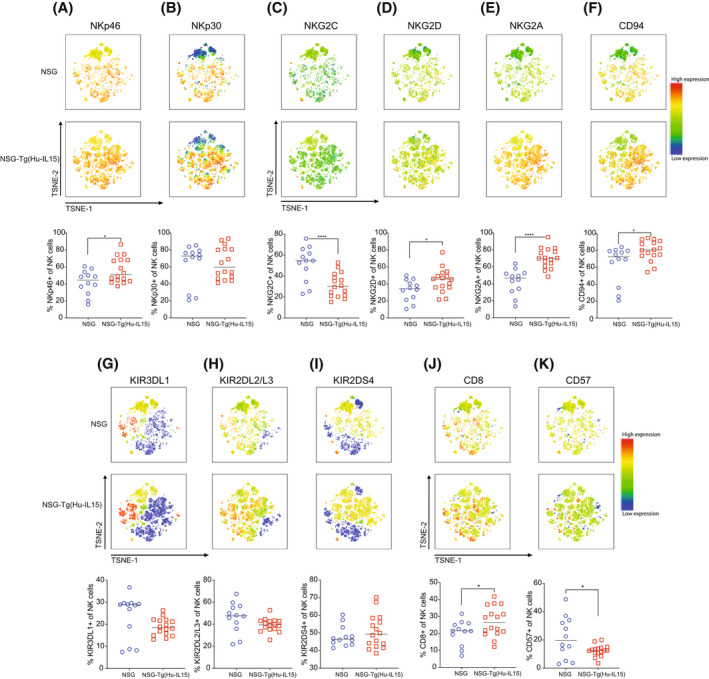
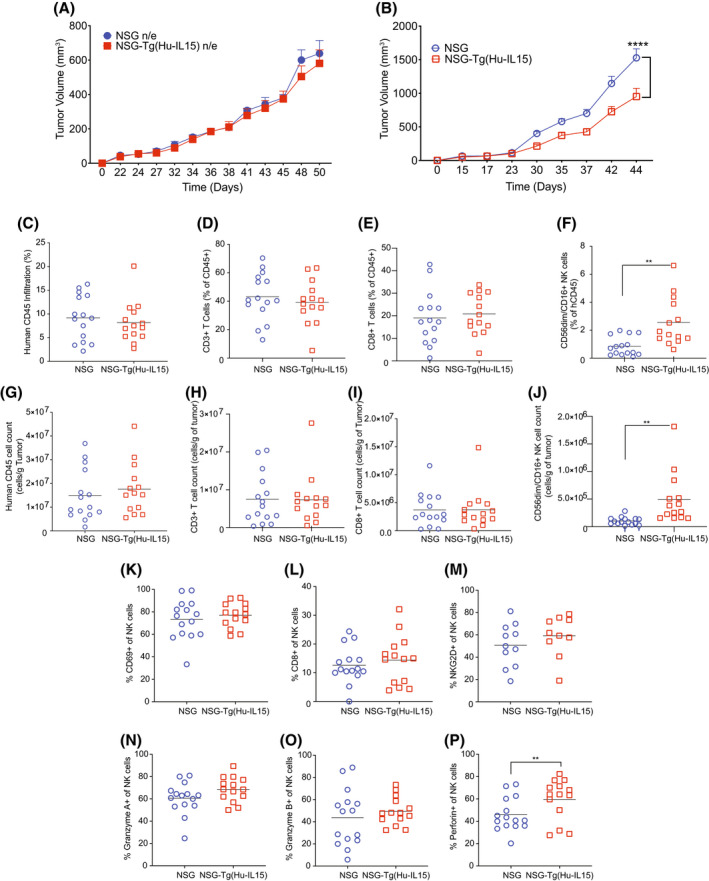
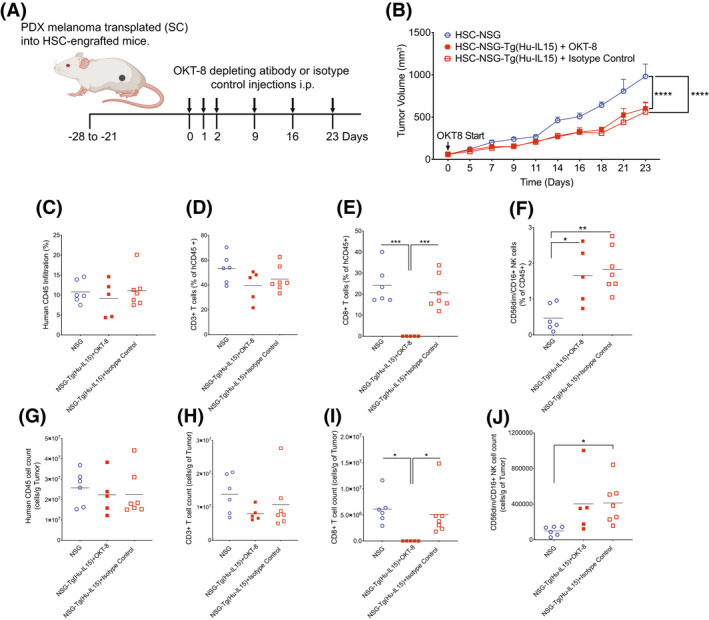
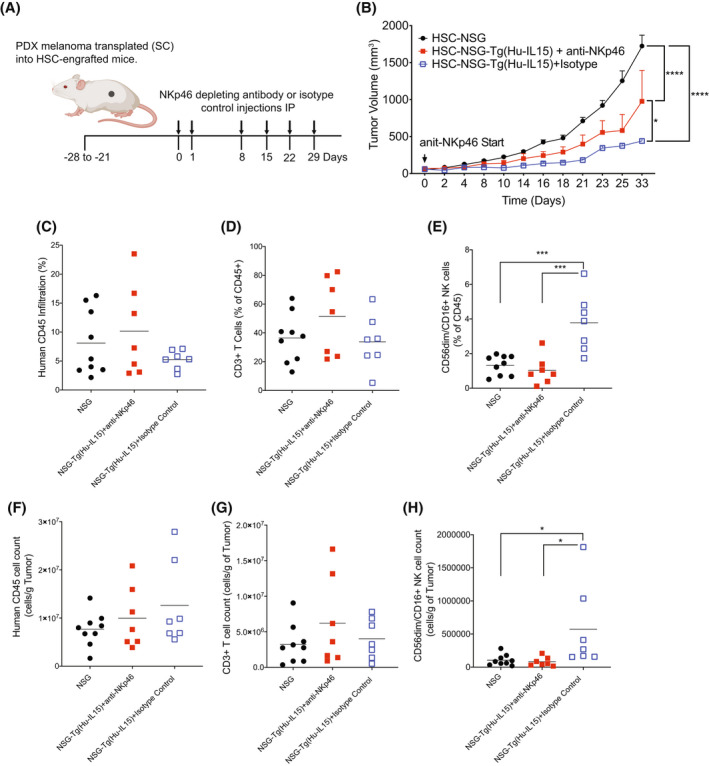
Human innate immunity plays a critical role in tumor surveillance and in immunoregulation within the tumor microenvironment. Natural killer (NK) cells are innate lymphoid cells that have opposing roles in the tumor microenvironment, including NK cell subsets that mediate tumor cell cytotoxicity and subsets with regulatory function that contribute to the tumor immune suppressive environment. The balance between effector and regulatory NK cell subsets has been studied extensively in murine models of cancer, but there is a paucity of models to study human NK cell function in tumorigenesis. Humanized mice are a powerful alternative to syngeneic mouse tumor models for the study of human immuno-oncology and have proven effective tools to test immunotherapies targeting T cells. However, human NK cell development and survival in humanized NOD-scid-IL2rgnull (NSG) mice are severely limited. To enhance NK cell development, we have developed NSG mice that constitutively expresses human Interleukin 15 (IL15), NSG-Tg(Hu-IL15). Following hematopoietic stem cell engraftment of NSG-Tg(Hu-IL15) mice, significantly higher levels of functional human CD56+ NK cells are detectable in blood and spleen, as compared to NSG mice. Hematopoietic stem cell (HSC)-engrafted NSG-Tg(Hu-IL15) mice also supported the development of human CD3+ T cells, CD20+ B cells, and CD33+ myeloid cells. Moreover, the growth kinetics of a patient-derived xenograft (PDX) melanoma were significantly delayed in HSC-engrafted NSG-Tg(Hu-IL15) mice as compared to HSC-engrafted NSG mice demonstrating that human NK cells have a key role in limiting the tumor growth. Together, these data demonstrate that HSC-engrafted NSG-Tg(Hu-IL15) mice support enhanced development of functional human NK cells, which limit the growth of PDX tumors.

Keywords: Hu-IL15; NK cells; NSG; humanized mice; transgenic.


Figures

FIGURE 1
FIGURE 1
Transgenic expression of human interleukin 15 (Hu‐IL15) in NOD‐scid IL2rγ null (NSG)‐Tg(Hu‐IL15) mice. (A) Polymerase chain reactions (PCRs) from NSG‐Tg(Hu‐IL15) mice and NSG mice were visualized on an agarose gel. Lane 1, Low molecular weight DNA ladder; Lanes 2 and 3, (NSG‐Tg(Hu‐IL15) mice; Lanes 4 and 5, NSG mice; Lane 6, loading control; Lane 7, negative DNA control; and Lane 8, human IL15 DNA control. (B) Quantification of human IL15 levels in unengrafted NSG mice (n = 6) and homozygous NSG‐Tg(Hu‐IL15) mice (n = 5) of both genders that were 16 weeks of age. Human IL15 was measured in serum using ELISA and means ± SEM are shown. (C) NSG or NSG‐Tg(Hu‐IL15) mice 6 to 8 weeks of age were irradiated (200 cGy) and injected IV with 100 000 CD34+ hematopoietic stem cell (HSC) derived from human CD3‐depleted umbilical cord blood (n = 15 mice per group). The survival of the mice was then followed over time. (D) Representative flow data from HSC‐engrafted NSG‐Tg(Hu‐IL15) mice are shown and the gating strategy to identify human immune cell subsets is also shown. The results are representative of three independent experiments.
FIGURE 2
FIGURE 2
Human immune cell chimerism in NOD‐scid IL2rγ null (NSG)‐Tg(Hu‐IL15) mice. NSG (n = 15) or NSG‐Tg(Hu‐IL15) mice (n = 15) at 6 to 8 weeks of age were irradiated (200 cGy) and injected IV with 100 000 CD34+ hematopoietic stem cell (HSC) derived from human CD3‐depleted UCB as described in the Materials and Methods. Mice were bled at the indicated time points post‐injection and blood analyzed by flow cytometry for (A) frequencies of human CD45+ cells, (B) total number of human CD45+ cells per μl of blood, (C) frequencies of human CD3+ T cells, (D) ratio of CD4 to CD8 T cells, (E) frequencies of human CD20+ B cells, and (F) frequencies of human CD33+ cells. Each point represents an individual mouse. For statistical analysis, HSC‐engrafted NSG‐Tg(Hu‐IL15) mice were compared with HSC‐engrafted NSG mice; *p < .05, **p < .01, ***p < .001, ****p < .0001. The results are representative of three independent experiments.
FIGURE 3
FIGURE 3
Heightened development of circulating human natural killer (NK) cells in NOD‐scid IL2rγ null (NSG)‐Tg(Hu‐IL15) mice. NSG (n = 15) or NSG‐Tg(Hu‐IL15) (n = 15) mice 6 to 8 weeks of age were irradiated (200 cGy) and injected IV with 100 000 CD34+ hematopoietic stem cell (HSC) derived from CD3‐depleted UCB as described in the Materials and Methods. Mice were bled at the indicated time points post‐injection and blood analyzed by flow cytometry for frequencies of human NK cells. (A) Representative flow plot of NK cells at 12 weeks post‐HSC injection. The human NK cells were gated on hCD45+/CD3−/CD33−/CD20−/CD7+ cells. The proportions of human (B) CD56dim/CD16+, (C) CD56bright/CD16−, and (D) CD16+ human NK cells are shown. (E) Total number of CD56dim/CD16+ NK cells per μl of blood is shown. (F) Total number of CD56‐bright NK cells per μl of blood is shown. Each point represents an individual mouse. For statistical analysis, HSC‐engrafted NSG‐Tg(Hu‐IL15) mice were compared with HSC‐engrafted NSG mice; *p < .05, **p < .01, ***p < .001, ****p < .0001. The results are representative of three independent experiments.
FIGURE 4
FIGURE 4
Functional profiling of natural killer (NK) cells in NOD‐scid IL2rγ null (NSG)‐Tg(Hu‐IL15) mice. NSG or NSG‐Tg(Hu‐IL15) mice 6 to 8 weeks of age were irradiated (200 cGy) and injected IV with 100 000 CD34+ hematopoietic stem cell (HSC) derived from CD3‐depleted UCB as described in the Materials and Methods. At 12 weeks post‐human HSC engraftment, blood (A, B, C, and D) and spleen (E, F, G, and H) were analyzed by flow cytometry for the frequency of (A and E) human CD56dim/CD16+ NK cells, and the proportion of human CD56dim/CD16+ NK cells to produce (B and F) perforin, (C and G) granzyme A, and (D and H) granzyme B. Each point represents an individual mouse, and the data are representative of three independent experiments. (I) Human CD56+ NK cells were purified from NSG‐Tg(Hu‐IL15) mice and from human blood and tested for their ex vivo ability to kill HLA class‐I deficient K562 tumor cells by chromium release as described in the Materials and Methods. NK cells purified from human peripheral blood mononuclear cells (PBMC) were included for comparison. The data are representative of two independent experiments. For statistical analysis, HSC‐engrafted NSG‐Tg(Hu‐Il15) mice were compared with HSC‐engrafted NSG mice; *p < .05, **p < .01, ***p < .001, ****p < .0001.
FIGURE 5
FIGURE 5
Phenotypic profiling of natural killer (NK) cells in NOD‐scid IL2rγ null (NSG)‐Tg(Hu‐IL15) mice. NSG or NSG‐Tg(Hu‐IL15) mice 6 to 8 weeks of age were irradiated (200 cGy) and injected IV with 100 000 CD34+ hematopoietic stem cell (HSC) derived from CD3‐depleted UCB as described in the Materials and Methods. At 12 weeks post‐human HSC engraftment, blood was analyzed for human CD56dim/CD16+ NK cell surface receptors by flow cytometry. Data are displayed as tSNE plots; natural cytotoxicity receptors, including NKp46 (A) and NKp30 (B); NKG family molecules, including NKG2C (C), NKG2D (D), NKG2A (E), and CD94 (F); KIRs, including KIR3DL1 (G), KIR2DL2/L3 (H), and KIR2DS4 (I); and maturation markers CD8 (J) and CD57 (K). The tSNE 2D scatter plots show the flow cytometry analysis of expression levels (red, high; blue, and low) of the surface markers. Each point represents an individual mouse. For statistical analysis, HSC‐engrafted NSG‐Tg(Hu‐IL15) mice were compared with HSC‐engrafted NSG mice; *p < .05, **p < .01, ***p < .001, ****p < .0001. The data are representative of two independent experiments.
FIGURE 6
FIGURE 6
Patient‐derived xenograft (PDX) melanoma grows with reduced kinetics in hematopoietic stem cell (HSC)‐engrafted NOD‐scid IL2rγ null (NSG)‐Tg(Hu‐IL15) mice. Six to eight‐week‐old male and female NSG mice and NSG‐Tg(Hu‐IL15) mice were left unmanipulated or engrafted with human HSC were transplanted subcutaneously with PDX melanoma as described in the Materials and Methods. Tumor growth kinetics were monitored in (A) non‐engrafted (n/e, n = 5 mice per group) and (B) HSC‐engrafted mice (NSG, n = 15 and NSG‐Tg(Hu‐IL15) mice (n = 14). Tumors were recovered from HSC‐engrafted mice and analyzed for the percentage (C–F) and number per gram of tumor (G–J) for human CD45+ cells (C and G), human CD3+ T (D and H) cells, human CD8+ T cells (E and I) and CD56dim/CD16+ NK cells (F and J). The NK cells infiltrating the tumor microenvironment were also monitored for surface production of CD69 (K), CD8 (L), NKG2D (M) and the capacity to produce granzyme A (N), granzyme B (O) and perforin (P). Each point represents an individual animal. For statistical analysis, HSC‐engrafted NSG‐Tg(Hu‐IL15) mice were compared with HSC‐engrafted NSG mice; *p < .05, **p < .01, ***p < .001, ****p < .0001. Representative data of three independent experiments.
FIGURE 7
FIGURE 7
Reduced tumor growth kinetics in NOD‐scid IL2rγ null (NSG)‐Tg(Hu‐IL15) is not driven by CD8+ T cells. Hematopoietic stem cell (HSC)‐engrafted male and female NSG (n = 6) and NSG‐Tg(Hu‐IL15) (n = 12) mice were transplanted subcutaneously with patient‐derived xenograft (PDX) melanoma as described in the Materials and Methods. NSG‐Tg(Hu‐IL15) mice were then depleted of CD8+ T cells using an OKT‐8 antibody (n = 5) or treated with an isotype control antibody (n = 7). (A) Experimental design and treatment schedule for OKT‐8 depletion of CD8 T cells. (B) Tumor growth kinetics were then monitored in the mice. The tumors were harvested from the mice and analyzed for the percentage (C–F) and number per gram of tumor (G–J) for human CD45+ cells (C and G), human CD3+ T (D and H) cells, human CD8+ T cells (E and I), and CD56dim/CD16+ NK cells (F and J). Each point represents an individual animal. For statistical analysis, CD8+ T cell‐depleted NSG‐Tg(Hu‐Il15) mice were compared with NSG‐Tg(Hu‐IL15) and NSG mice; *p < .05, **p < .01, ***p < .001, ****p < .0001. Representative data of two independent experiments.
FIGURE 8
FIGURE 8
Reduced tumor growth kinetics in NOD‐scid IL2rγ null (NSG)‐Tg(Hu‐IL15) partially restored by the depletion of NKp46+ NK cells. Hematopoietic stem cell (HSC)‐engrafted male and female NSG (n = 9) and NSG‐Tg(Hu‐IL15) mice (n = 14) were transplanted subcutaneously with patient‐derived xenograft (PDX) melanoma as described in the Materials and Methods. NSG‐Tg(Hu‐IL15) mice were then depleted of natural killer (NK)p46+ NK cells using an NKp46 depleting antibody (n = 7) or treated with an isotype control antibody (n = 7). (A) Experimental design and treatment schedule for NK cell depletion. (B) Tumor growth kinetics were then monitored in the mice. The tumors were harvested from the mice and analyzed for the percentage (C–E) and number per gram of tumor (F–H) of human CD45+ cells (C and F), human CD3+ T cells (D and G), and CD56dim/CD16+ NK cells (E and H). Each point represents an individual animal. For statistical analysis, NKp46+ NK cell‐depleted NSG‐Tg(Hu‐IL15) mice were compared with NSG‐Tg(Hu‐IL15) and NSG mice; *p < .05, **p < .01, ***p < .001, ****p < .0001. Representative data of two experiments.

Similar articles

Cited by

References

    1. De La Rochere P, Guil‐Luna S, Decaudin D, Azar G, Sidhu SS, Piaggio E. Humanized mice for the study of Immuno‐oncology. Trends Immunol. 2018;39:748‐763. - PubMed
    1. Chen DS, Mellman I. Elements of cancer immunity and the cancer‐immune set point. Nature. 2017;541:321‐330. - PubMed
    1. Koyama S, Akbay EA, Li YY, et al. Adaptive resistance to therapeutic PD‐1 blockade is associated with upregulation of alternative immune checkpoints. Nat Commun. 2016;7:10501. - PMC - PubMed
    1. Bazhin AV, Amedei A, Karakhanova S. Editorial: immune checkpoint molecules and cancer immunotherapy. Front Immunol. 2018;9:2878. - PMC - PubMed
    1. Greppi M, Tabellini G, Patrizi O, et al. Strengthening the AntiTumor NK cell function for the treatment of ovarian cancer. Int J Mol Sci. 2019;20:890. - PMC - PubMed

Publication types

Substances

LinkOut - more resources