. 2022 Nov 2;3(6):516-535.
doi: 10.1158/2643-3230.BCD-22-0011.

Pharmacogenomic Profiling of Pediatric Acute Myeloid Leukemia to Identify Therapeutic Vulnerabilities and Inform Functional Precision Medicine

Affiliations

Pharmacogenomic Profiling of Pediatric Acute Myeloid Leukemia to Identify Therapeutic Vulnerabilities and Inform Functional Precision Medicine

Han Wang et al. Blood Cancer Discov. .

Abstract

Despite the expanding portfolio of targeted therapies for adults with acute myeloid leukemia (AML), direct implementation in children is challenging due to inherent differences in underlying genetics. Here we established the pharmacologic profile of pediatric AML by screening myeloblast sensitivity to approved and investigational agents, revealing candidates of immediate clinical relevance. Drug responses ex vivo correlated with patient characteristics, exhibited age-specific alterations, and concorded with activities in xenograft models. Integration with genomic data uncovered new gene-drug associations, suggesting actionable therapeutic vulnerabilities. Transcriptome profiling further identified gene-expression signatures associated with on- and off-target drug responses. We also demonstrated the feasibility of drug screening-guided treatment for children with high-risk AML, with two evaluable cases achieving remission. Collectively, this study offers a high-dimensional gene-drug clinical data set that could be leveraged to research the unique biology of pediatric AML and sets the stage for realizing functional precision medicine for the clinical management of the disease.

Significance: We conducted integrated drug and genomic profiling of patient biopsies to build the functional genomic landscape of pediatric AML. Age-specific differences in drug response and new gene-drug interactions were identified. The feasibility of functional precision medicine-guided management of children with high-risk AML was successfully demonstrated in two evaluable clinical cases. This article is highlighted in the In This Issue feature, p. 476.


Figures

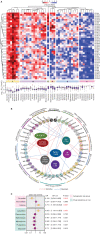
Figure 1. Drug response profile of pediatric AML. A, Heat map indicating the
responses of 42 pediatric AML samples to 45 compounds represented by Z-score–transformed
AUCs. Samples (rows) and drugs (columns) are ordered by unsupervised hierarchical
clustering. Cluster A: highly active drugs with median IC50 values <70 nmol/L.
Cluster B: generally active drugs with median IC50 values <700 nmol/L. Clusters C and
D: drugs with bimodal activities. Cluster E: generally inactive drugs with sporadic
exceptions. Cluster F: completely inactive drugs. The IC50 distribution range for each
compound is shown on the boxplot under the drug clusters, with median IC50 values (white
dots) and Cmax (red dots) depicted.B, Correlation of pretreatment variables with drug
sensitivity for the entire patient cohort (n = 52). Drugs are clustered on drug family.
Significant associations (P < 0.05) are connected by arrows (sensitive) or edges
(resistant). Drug sensitivity was assigned based on median AUCs. C, Forest plot showing
the performance of cytogenetic risk group or ex vivo resistance to chemotherapeutics
(defined by median AUCs) for prediction of clinical outcome. Patients (n = 46) with
>12 months follow-up were included for analyses. Odds ratio of event (relapse or
death), 95% confidence interval, and P values are shown. Statistics: B, two-tailed,
unpaired Student t test; C, logistic regression.
Figure 1.
Drug response profile of pediatric AML. A, Heat map indicating the responses of 42 pediatric AML samples to 45 compounds represented by Z-score–transformed AUCs. Samples (rows) and drugs (columns) are ordered by unsupervised hierarchical clustering. Cluster A: highly active drugs with median IC50 values <70 nmol/L. Cluster B: generally active drugs with median IC50 values <700 nmol/L. Clusters C and D: drugs with bimodal activities. Cluster E: generally inactive drugs with sporadic exceptions. Cluster F: completely inactive drugs. The IC50 distribution range for each compound is shown on the boxplot under the drug clusters, with median IC50 values (white dots) and Cmax (red dots) depicted. B, Correlation of pretreatment variables with drug sensitivity for the entire patient cohort (n = 52). Drugs are clustered on drug family. Significant associations (P < 0.05) are connected by arrows (sensitive) or edges (resistant). Drug sensitivity was assigned based on median AUCs. C, Forest plot showing the performance of cytogenetic risk group or ex vivo resistance to chemotherapeutics (defined by median AUCs) for prediction of clinical outcome. Patients (n = 46) with >12 months follow-up were included for analyses. Odds ratio of event (relapse or death), 95% confidence interval, and P values are shown. Statistics: B, two-tailed, unpaired Student t test; C, logistic regression.
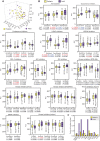
Figure 2. Drug-sensitivity profiles of pediatric and adult AML. A, PCA of the
response parameter (i.e., AUC values of 45 drugs) in pediatric (n = 42) and adult AML (n
= 26) samples. B, Boxplots showing the AUC distributions of individual drugs, ordered by
drug classes. Statistics: two-tailed, unpaired Student t test. P values comparing both
AUCs and IC50 values are indicated. Statistically significant values are shown in red.
Asterisks mark statistically significant differences after correction for multiple
comparison by the Benjamini–Hochberg procedure, with P values after FDR correction shown
in blue. C, Fraction of pediatric (n = 52) and adult (n = 26) samples with major genetic
alterations detected by targeted sequencing.
Figure 2.
Drug-sensitivity profiles of pediatric and adult AML. A, PCA of the response parameter (i.e., AUC values of 45 drugs) in pediatric (n = 42) and adult AML (n = 26) samples. B, Boxplots showing the AUC distributions of individual drugs, ordered by drug classes. Statistics: two-tailed, unpaired Student t test. P values comparing both AUCs and IC50 values are indicated. Statistically significant values are shown in red. Asterisks mark statistically significant differences after correction for multiple comparison by the Benjamini–Hochberg procedure, with P values after FDR correction shown in blue. C, Fraction of pediatric (n = 52) and adult (n = 26) samples with major genetic alterations detected by targeted sequencing.
Figure 3. Ex vivo drug activities capture in vivo responses. A, Dose–response
curves of venetoclax on primary myeloblasts from 54 pediatric AML samples (diagnosis, n
= 42; relapse, n = 12). Samples exhibiting sensitivity (red curves) or resistance (blue
curves) were classified with respect to the median IC50 value (6,674 nmol/L) across the
patient cohort. Arrows mark the samples selected for animal modeling. B, NSG mice were
transplanted with myeloblasts derived from a venetoclax-resistant (LEU280) or a
venetoclax-sensitive (LEU350) sample to generate PDXs. Animals (4–5 mice/group) were
randomized to receive vehicle or oral venetoclax (100 mg/kg, once daily, 5 days/week for
2 weeks). Treatments commenced on day 3 after transplantation. Circulating leukemic
blasts were monitored serially by flow-cytometric detection of human CD45+CD33+CD19−
cells. Statistics: two-tailed, unpaired Student t test. P values are indicated. C, BM
samples were collected on day 45 (LEU280) and day 89 (LEU350) posttransplantation for
the enumeration of medullary leukemia. D, Fish plots showing the evolution of subclonal
architecture for samples LEU280 and LEU350 before (P0) and after (P1) leukemia
engraftment in the BM of control NSG mice at the overt disease stage (i.e., day 45 for
LEU280 and day 89 for LEU350).
Figure 3.
Ex vivo drug activities capture in vivo responses. A, Dose–response curves of venetoclax on primary myeloblasts from 54 pediatric AML samples (diagnosis, n = 42; relapse, n = 12). Samples exhibiting sensitivity (red curves) or resistance (blue curves) were classified with respect to the median IC50 value (6,674 nmol/L) across the patient cohort. Arrows mark the samples selected for animal modeling. B, NSG mice were transplanted with myeloblasts derived from a venetoclax-resistant (LEU280) or a venetoclax-sensitive (LEU350) sample to generate PDXs. Animals (4–5 mice/group) were randomized to receive vehicle or oral venetoclax (100 mg/kg, once daily, 5 days/week for 2 weeks). Treatments commenced on day 3 after transplantation. Circulating leukemic blasts were monitored serially by flow-cytometric detection of human CD45+CD33+CD19 cells. Statistics: two-tailed, unpaired Student t test. P values are indicated. C, BM samples were collected on day 45 (LEU280) and day 89 (LEU350) posttransplantation for the enumeration of medullary leukemia. D, Fish plots showing the evolution of subclonal architecture for samples LEU280 and LEU350 before (P0) and after (P1) leukemia engraftment in the BM of control NSG mice at the overt disease stage (i.e., day 45 for LEU280 and day 89 for LEU350).
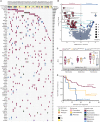
Figure 4. Integration of genomic alterations with drug sensitivity. A, Mosaic
plot showing the mutational landscape of 52 pediatric patients with AML. The earliest
specimen was included for analyses for individuals with consecutive sampling. Recurrent
mutations occurring in ≥2 patients are shown and ranked by their frequencies in the
cohort illustrated by the bar chart. Patients are annotated with clinical features and
mutations with types. Asterisks mark pathogenic or likely pathogenic variants. B,
Gene–drug associations represented by a volcano plot showing their significance and
effects between wild-type and mutant samples. Pathogenic or likely pathogenic variants
with VAF >10% were included for the analysis. A P value cutoff of 0.05 (horizontal
line) was applied to detect statistically significant associations. A Z score cutoff of
0 (vertical line) defines relative drug sensitivity (red circles) and resistance (blue
circles). The size of circles represents the number of patients harboring the mutations.
Circles annotated with green and black texts denote known and novel associations,
respectively. C, Box plots showing the activities of BCL-2 inhibitors in pediatric AML
stratified by KMT2C mutation status: wild-type (n = 29–35), benign or likely benign
mutants (n = 8), pathogenic or likely pathogenic mutants (n = 3–4). Median IC50 values
are shown. D, Kaplan–Meier estimates of 3-year event-free survival (period from
diagnosis to first relapse or death from any cause) in patients with wild-type (n = 40),
benign (n = 8), and pathogenic KMT2C (n = 4). Statistics: B, one-way ANOVA; C,
two-tailed, unpaired Student t test with correction for multiple comparison by the
Benjamini–Hochberg method; D, log-rank test. *, P < 0.05; **, P < 0.01.
Figure 4.
Integration of genomic alterations with drug sensitivity. A, Mosaic plot showing the mutational landscape of 52 pediatric patients with AML. The earliest specimen was included for analyses for individuals with consecutive sampling. Recurrent mutations occurring in ≥2 patients are shown and ranked by their frequencies in the cohort illustrated by the bar chart. Patients are annotated with clinical features and mutations with types. Asterisks mark pathogenic or likely pathogenic variants. B, Gene–drug associations represented by a volcano plot showing their significance and effects between wild-type and mutant samples. Pathogenic or likely pathogenic variants with VAF >10% were included for the analysis. A P value cutoff of 0.05 (horizontal line) was applied to detect statistically significant associations. A Z score cutoff of 0 (vertical line) defines relative drug sensitivity (red circles) and resistance (blue circles). The size of circles represents the number of patients harboring the mutations. Circles annotated with green and black texts denote known and novel associations, respectively. C, Box plots showing the activities of BCL-2 inhibitors in pediatric AML stratified by KMT2C mutation status: wild-type (n = 29–35), benign or likely benign mutants (n = 8), pathogenic or likely pathogenic mutants (n = 3–4). Median IC50 values are shown. D, Kaplan–Meier estimates of 3-year event-free survival (period from diagnosis to first relapse or death from any cause) in patients with wild-type (n = 40), benign (n = 8), and pathogenic KMT2C (n = 4). Statistics: B, one-way ANOVA; C, two-tailed, unpaired Student t test with correction for multiple comparison by the Benjamini–Hochberg method; D, log-rank test. *, P < 0.05; **, P < 0.01.
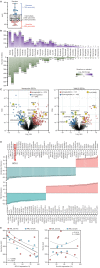
Figure 5. Predictors of drug response. A, AML specimens were stratified by drug
activities: (i) sensitive samples with AUC <25th percentile; (ii) intermediate
samples with AUC between the 25th and 75th percentiles; and (iii) resistant samples with
AUC >75th percentile. B, RNA-seq was performed on 48 specimens. DEGs in sensitive
over resistant samples were identified for 36 drugs using FDR <0.05 and log2 fold
change >2 as the cutoffs. Drugs are ranked according to the total number of DEGs.
Purple and green bars represent upregulated and downregulated DEGs, and the color
intensity denotes fold changes. C, Volcano plots showing DEGs of venetoclax (n = 610)
and YM155 (n = 245). Suppressed DEGs in sensitive samples are indicated by blue circles
and augmented DEGs by red circles. The top 10 DEGs with the highest correlation with AUC
values are marked with yellow frames with gene symbols listed.D, Correlation analyses
between DEG (CPM) and drug sensitivity (AUC). DEGs of venetoclax (n = 98) and YM155 (n =
91) with correlation coefficients of < −0.5 or >0.5 are shown and ranked according
to the magnitude of correlation. Positively correlated DEGs are indicated by pink bars,
and negatively correlated DEGs by green bars. Arrow indicates the venetoclax target
BCL-2. E, Intracellular BCL-2 and survivin expression in AML cell lines (n = 10) and
samples (n = 8–9) was measured by flow cytometry and correlated with venetoclax and
YM155 sensitivity, respectively. Statistics: B, C, DESeq2; D, E, Pearson correlation. *,
P < 0.05; **, P < 0.01; ***, P < 0.001; ****, P < 0.0001.
Figure 5.
Predictors of drug response. A, AML specimens were stratified by drug activities: (i) sensitive samples with AUC <25th percentile; (ii) intermediate samples with AUC between the 25th and 75th percentiles; and (iii) resistant samples with AUC >75th percentile. B, RNA-seq was performed on 48 specimens. DEGs in sensitive over resistant samples were identified for 36 drugs using FDR <0.05 and log2 fold change >2 as the cutoffs. Drugs are ranked according to the total number of DEGs. Purple and green bars represent upregulated and downregulated DEGs, and the color intensity denotes fold changes. C, Volcano plots showing DEGs of venetoclax (n = 610) and YM155 (n = 245). Suppressed DEGs in sensitive samples are indicated by blue circles and augmented DEGs by red circles. The top 10 DEGs with the highest correlation with AUC values are marked with yellow frames with gene symbols listed. D, Correlation analyses between DEG (CPM) and drug sensitivity (AUC). DEGs of venetoclax (n = 98) and YM155 (n = 91) with correlation coefficients of < −0.5 or >0.5 are shown and ranked according to the magnitude of correlation. Positively correlated DEGs are indicated by pink bars, and negatively correlated DEGs by green bars. Arrow indicates the venetoclax target BCL-2. E, Intracellular BCL-2 and survivin expression in AML cell lines (n = 10) and samples (n = 8–9) was measured by flow cytometry and correlated with venetoclax and YM155 sensitivity, respectively. Statistics: B, C, DESeq2; D, E, Pearson correlation. *, P < 0.05; **, P < 0.01; ***, P < 0.001; ****, P < 0.0001.
Figure 6. Precision medicine for high-risk pediatric AML. A, Flowchart showing
the workflow of this pilot clinical trial, including patient numbers at each stage and
reasons for dropping out of the study. B, Clinical progression of a child with relapsed
AML receiving drug profiling-guided treatment. The disease course, treatment landscape,
and laboratory investigations are depicted. C, Drug profiling results at first AML
relapse. The bar chart shows the activities of 45 screened drugs ranked in descending
IC50 values. The horizontal line at 15 nmol/L was arbitrarily set to indicate highly
active drugs. The table shows the top-hit drugs annotated with respective IC50 values,
AUC, Cmax, and FDA-approval status. The drug recommended by the tumor board is indicated
by an arrow in the bar chart and highlighted in yellow in the table. D and E, Clinical
progression, drug testing results, and therapy recommendation for another case with
relapsed MPAL. Abbreviations: BMT, bone marrow transplantation; DLI, donor leukocyte
infusion; FLA, fludarabine and cytarabine; FLAD, fludarabine, cytarabine, and
daunorubicin; HIC, high-intensity consolidation.
Figure 6.
Precision medicine for high-risk pediatric AML. A, Flowchart showing the workflow of this pilot clinical trial, including patient numbers at each stage and reasons for dropping out of the study. B, Clinical progression of a child with relapsed AML receiving drug profiling-guided treatment. The disease course, treatment landscape, and laboratory investigations are depicted. C, Drug profiling results at first AML relapse. The bar chart shows the activities of 45 screened drugs ranked in descending IC50 values. The horizontal line at 15 nmol/L was arbitrarily set to indicate highly active drugs. The table shows the top-hit drugs annotated with respective IC50 values, AUC, Cmax, and FDA-approval status. The drug recommended by the tumor board is indicated by an arrow in the bar chart and highlighted in yellow in the table. D and E, Clinical progression, drug testing results, and therapy recommendation for another case with relapsed MPAL. Abbreviations: BMT, bone marrow transplantation; DLI, donor leukocyte infusion; FLA, fludarabine and cytarabine; FLAD, fludarabine, cytarabine, and daunorubicin; HIC, high-intensity consolidation.

Similar articles

Cited by

References

    1. Miranda-Filho A, Piñeros M, Ferlay J, Soerjomataram I, Monnereau A, Bray F. Epidemiological patterns of leukaemia in 184 countries: a population-based study. Lancet Haematol 2018;5:e14–24. - PubMed
    1. Rubnitz JE, Kaspers GJ. How I treat pediatric acute myeloid leukemia. Blood 2021;138:1009–18. - PubMed
    1. Zwaan CM, Kolb EA, Reinhardt D, Abrahamsson J, Adachi S, Aplenc R, et al. . Collaborative efforts driving progress in pediatric acute myeloid leukemia. J Clin Oncol 2015;33:2949–62. - PMC - PubMed
    1. Rasche M, Zimmermann M, Borschel L, Bourquin JP, Dworzak M, Klingebiel T, et al. . Successes and challenges in the treatment of pediatric acute myeloid leukemia : a retrospective analysis of the AML-BFM trials from 1987 to 2012. Leukemia 2018;32:2167–77. - PMC - PubMed
    1. Kaspers GJ, Zimmermann M, Reinhardt D, Gibson BE, Tamminga RY, Aleinikova O, et al. . Improved outcome in pediatric relapsed acute myeloid leukemia: results of a randomized trial on liposomal daunorubicin by the International BFM Study Group. J Clin Oncol 2013;31:599–607. - PubMed

Publication types