. 2022 Aug 12;18(8):e1010731.
doi: 10.1371/journal.ppat.1010731. eCollection 2022 Aug.

Malnutrition and maternal vaccination against typhoid toxin

Affiliations

Malnutrition and maternal vaccination against typhoid toxin

Durga P Neupane et al. PLoS Pathog. .

Abstract

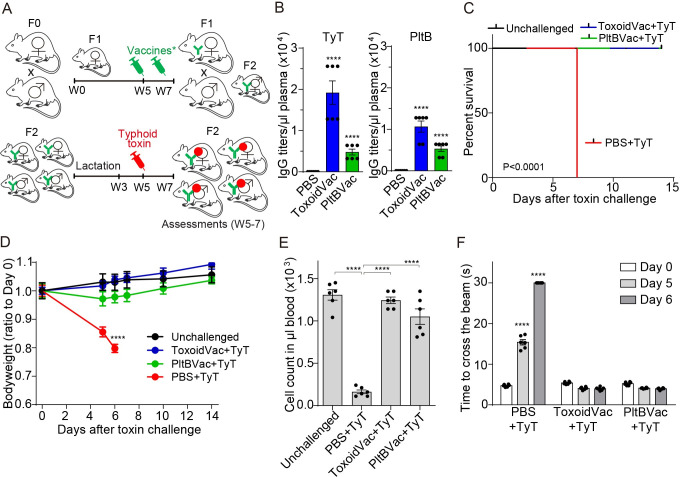
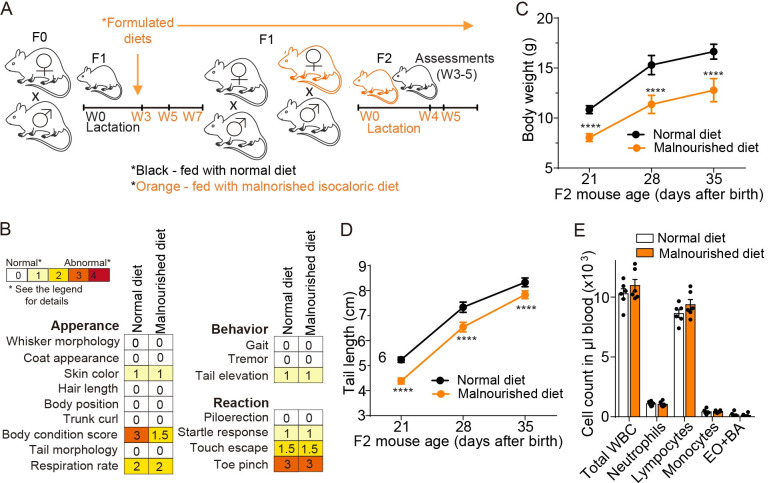
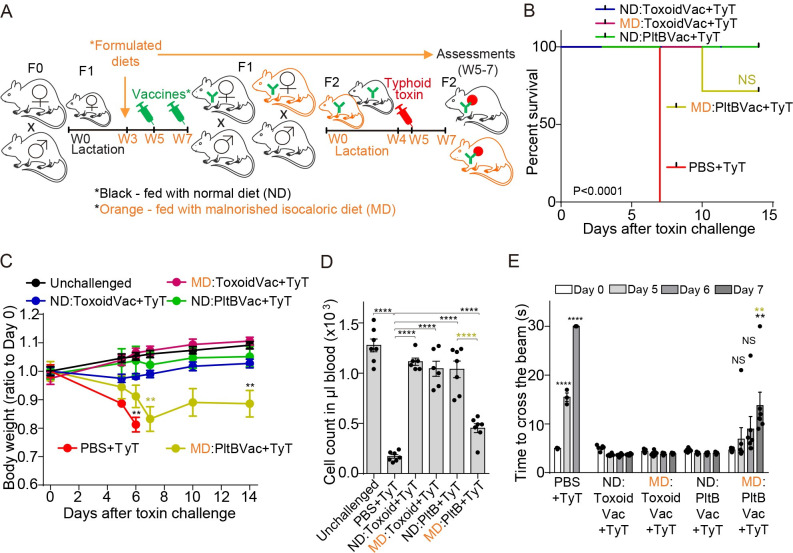
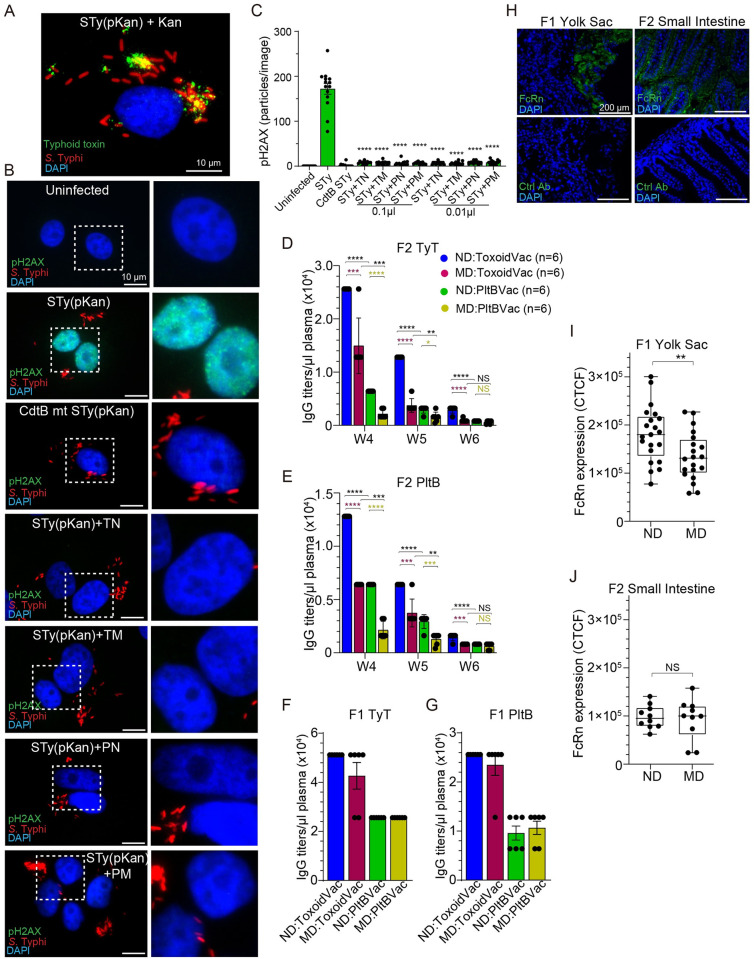
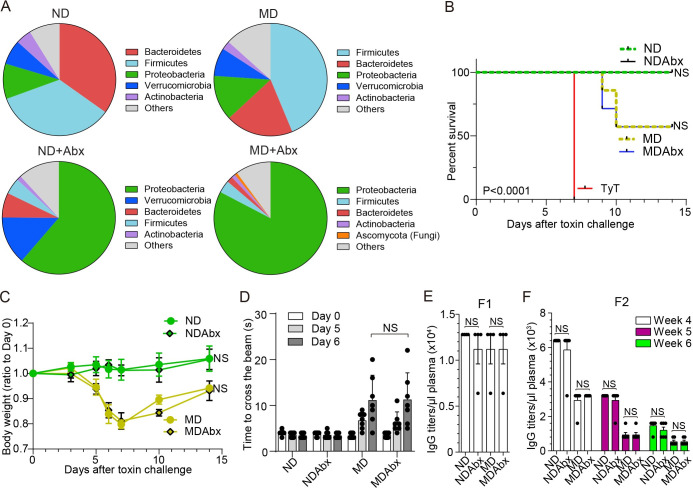
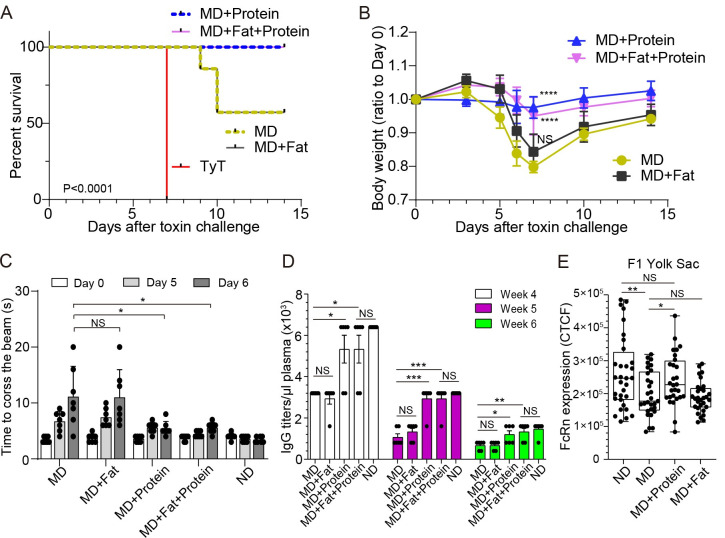
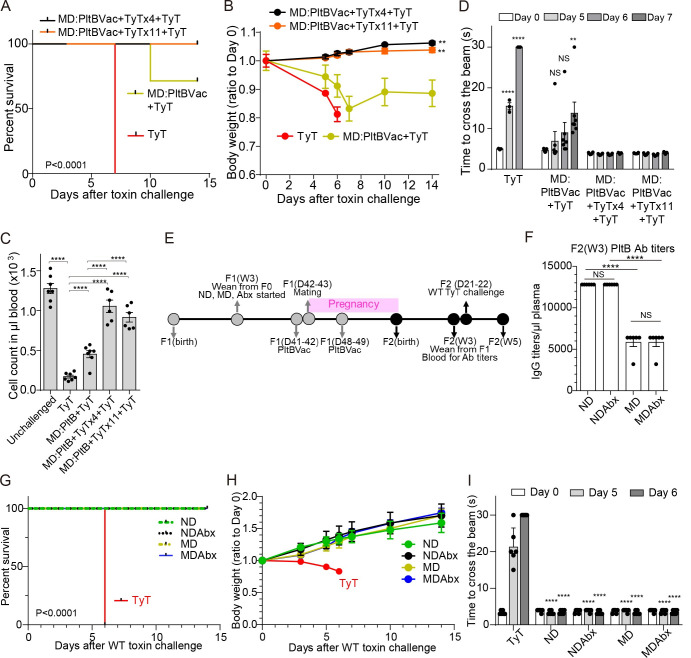
Children are particularly susceptible to typhoid fever caused by the bacterial pathogen Salmonella Typhi. Typhoid fever is prevalent in developing countries where diets can be less well-balanced. Here, using a murine model, we investigated the role of the macronutrient composition of the diet in maternal vaccination efficacies of two subunit vaccines targeting typhoid toxin: ToxoidVac and PltBVac. We found that maternal vaccinations protected all offspring against a lethal-dose typhoid toxin challenge in a balanced, normal diet (ND) condition, but the declined protection in a malnourished diet (MD) condition was observed in the PltBVac group. Despite the comparable antibody titers in both MD and ND mothers, MD offspring had a significantly lower level of typhoid toxin neutralizing antibodies than their ND counterparts. We observed a lower expression of the neonatal Fc receptor on the yolk sac of MD mothers than in ND mothers, agreeing with the observed lower antibody titers in MD offspring. Protein supplementation to MD diets, but not fat supplementation, increased FcRn expression and protected all MD offspring from the toxin challenge. Similarly, providing additional typhoid toxin-neutralizing antibodies to MD offspring was sufficient to protect all MD offspring from the toxin challenge. These results emphasize the significance of balanced/normal diets for a more effective maternal vaccination transfer to their offspring.


Conflict of interest statement

The authors have declared that no competing interests exist.

Figures

Fig 1
Fig 1. Maternal antibodies protected their progenies from a lethal-dose typhoid toxin challenge.
A, Schematic cartoon describing the timelines for maternal vaccinations, 2 μg typhoid toxin challenge, and assessments for protection. F1 mothers received two doses (2 μg each) of inactive typhoid toxoid (ToxoidVac) or PltB pentamer (PltBVac) at weeks 5 and 7 (W5 and W7). The vaccinated F1 female mice were mated with unvaccinated F1 male mice, resulting in F2 progenies. Five-week-old F2 mice were challenged with a lethal-dose active typhoid toxin and evaluated for survival, body weight changes, peripheral immune cell counts, and upper motor functions. B, Titers of maternal antibodies specific to typhoid toxin (TyT) and PltB pentamer (PltB) available in 1 μl of the indicated F2 mouse plasma collected at week 5. Standard end-point titration methods were used. PBS (black bars), F2 mice from F1 mothers received PBS. ToxoidVac (blue bars), F2 mice maternally vaccinated with ToxoidVac. PltBVac (green bars), F2 mice maternally vaccinated with PltBVac. C, Percent survival of the maternally-vaccinated F2 mice challenged with 2 μg typhoid toxin (TyT). D, Body weight changes of these F2 mice. E, Circulating neutrophil counts in mouse peripheral blood on day 6 after the typhoid toxin challenge. F, Balance beam walking results of these F2 mice on days 0, 5, and 6 after typhoid toxin challenge. Bars represent the mean values of two independent experiments ± standard error of the mean (SEM). The total of n = 6 per group. ****, p<0.0001, relative to the PBS group for B, to the unchallenged group for D, to the unchallenged group or the TyT group for E as indicated in the graph, and to the day 0 value for F. The log-rank test was performed for C and two-tailed unpaired t-tests for B, D, E, and F.
Fig 2
Fig 2. The establishment of a malnourished maternal vaccination model.
A, Timelines of normal- and malnourished isocaloric diet-feeding and mating that were used in this study. Both F1 and F2 mice were fed normal and malnourished diets. See Table 1 for details. B, SHIRPAs on the 5 weeks-old F2 mice. See Table 2 for details. C, Bodyweight changes of normal and malnourished diet-fed F2 mice from week 3 to 5. D, Tail length changes of these F2 mice. E, Circulating leukocyte counts available in 1 μl of peripheral blood of 5 weeks-old F2 mice. WBC, white blood cells. EO, eosinophils. BA, basophils. Lines and bars in C and D represent the mean ± standard deviation (SD), while the mean ± SEM is used for E. n = 13–14 F2 mice per group for B-D. n = 6 F2 mice per group for E. ****, p<0.0001, relative to normal diet-fed F2 for C and D. Two-tailed unpaired t-tests.
Fig 3
Fig 3. Maternal antibodies protected some but not all progenies against typhoid toxin in malnutrition.
A, Timelines of indicated diet-feeding, maternal vaccinations, toxin challenge, and assessments for protection. Both F1 and F2 mice were fed with indicated diets, which were started when F1 mice were 3 weeks old and continued throughout the experimental timeframe. B, Survival of the maternally-vaccinated F2 mice challenged with 2 μg typhoid toxin (TyT). ND:ToxoidVac (blue), normal diet-fed F2 mice maternally vaccinated with ToxoidVac. MD:ToxoidVac (plum), malnourished diet-fed F2 mice maternally vaccinated with ToxoidVac. ND:PltBVac (green), normal diet-fed F2 mice maternally vaccinated with PltBVac. MD:PltBVac (olive), malnourished diet-fed F2 mice maternally vaccinated with PltBVac. C, Body weight changes of these F2 mice after receiving 2 μg typhoid toxin for the 14 day-experimental period. D, Circulating neutrophil counts in peripheral blood of these F2 mice on day 6 after the toxin challenge. E, Balance beam walking results of these F2 mice on days 0, 5, 6, and 7 after the toxin challenge. Bars represent the mean ± SEM. n = 6–7 F2 mice per group. NS, not significant; **, p<0.01; ****, p<0.0001, relative to the unchallenged group for C, to the unchallenged group or the TyT group for D as indicated in the graph, and to the day 0 value for E. Green symbols are used to indicate the statistic analysis results between MD:PltB+TyT group and ND:PltB+TyT group in B-E. The log-rank test was performed for B and two-tailed unpaired t-tests for C, D, and E.
Fig 4
Fig 4. Unlike F1 mothers, MD progenies had a significantly lower level of typhoid toxin neutralizing antibodies.
A, Representative fluorescence microscope image showing typhoid toxin (green) secreted by S. Typhi (red) in kanamycin-resistant S. Typhi-infected host cells (blue for host cell DNA). STy(pKan), S. Typhi carrying the pKan plasmid. Kan, 50 μg/mL kanamycin treatment. Scale bar, 10 μm. B, Representative fluorescence microscope images showing pH2AX (green, reflecting host cell DNA damage repair response), S. Typhi(pKan) (red), and host cell DNA (blue). Zoom-in images (right panels) correspond to the dotted boxes in the overall images (left panels). Scale bar, 10 μm. C, pH2AX signal quantification of microscopy images obtained from three independent experiments. Bars represent average ± SEM. **** p<0.0001, relative to the STy(pKan) group. Two-tailed unpaired t-tests. D-E, Maternal antibody titers specific to typhoid toxin (TyT) (D) and PltB pentamer (PltB) (E) available in 1 μl plasma samples of indicated F2 mice from weeks 4 to 6. ND:ToxoidVac (blue), normal diet-fed F2 mice maternally vaccinated with ToxoidVac. MD:ToxoidVac (plum), malnourished diet-fed F2 mice maternally vaccinated with ToxoidVac. ND:PltBVac (green), normal diet-fed F2 mice maternally vaccinated with PltBVac. MD:PltBVac (olive), malnourished diet-fed F2 mice maternally vaccinated with PltBVac. n = 6 per group. F-G, IgG titers specific to typhoid toxin (TyT) (F) and PltB pentamer (PltB) (G) that were available in 1 μl plasma samples of the indicated F1 mothers (7 weeks old). n = 6 per group. H, Verification of the specificity of an anti-FcRn antibody used. Blue, DAPI to stain the nuclei of host cells, Green, FcRn, or isotype control IgG. Scale bar, 200 μm. The placenta and yolk sac tissue were harvested from ND-fed F1 on pregnancy/gestation day (GD)17. The small intestine of F2 was harvested on day 7. I, The expression of FcRn on the yolk sac of ND and MD F1 mice. J, The expression of FcRn on the small intestine of ND and MD F2 mice. Data from three independent experiments. Boxes and whiskers in I and J represent average, min, and max with all data points. NS; not significant; **, p<0.01. Two-tailed unpaired t-tests.
Fig 5
Fig 5. MD-induced gut microbiome alterations had no effects on maternal vaccination outcomes against typhoid toxin.
A, The small intestine microbiome compositions of ND (n = 3), MD (n = 3), ND+Abx (n = 2), and MD+Abx (n = 2). See also Table 3. B, Survival of the maternally vaccinated (PltBVac) F2 mice challenged with 2 μg typhoid toxin (TyT). ND (green dotted), normal diet-fed F2 mice. NDAbx (black solid), normal diet-fed F2 mice obtained from corresponding antibiotics treated F1. MD (olive dotted), malnourished diet-fed F2 mice. MDAbx (blue solid), malnourished diet-fed F2 mice obtained from corresponding antibiotics treated F1. TyT (red solid), standard regular food-fed F2 mice derived from unvaccinated mothers. C. Relative body weight changes of these F2 mice after receiving 2 μg typhoid toxin for the 14 day-experimental period. D. Balance beam walking results of these F2 mice on days 0, 5, and 6 after the toxin challenge. E. IgG titers specific to PltB pentamer available in 1 μl plasma samples of the indicated F1 mothers (19 days of pregnancy). F. Maternal antibody titers specific to PltB pentamer available in 1 μl plasma samples of indicated F2 mice from weeks 4 to 6. The typhoid toxin challenge was conducted in week 5. Lines and bars represent the mean ± SEM. n = 4 (F1) and 6-7 (F2) mice per group. NS, not significant. The log-rank test was performed for B and two-tailed unpaired t-tests for C-F.
Fig 6
Fig 6. Providing additional protein, but not fat, to MD mothers protected all MD progenies from a lethal dose of typhoid toxin challenge.
A, Survival of the maternally vaccinated (PltBVac) F2 mice challenged with 2 μg typhoid toxin. All these F2 mice were fed a malnourished diet ± protein/fat supplementation. MD (olive dotted), a malnourished diet alone. MD+Fat (black solid), a malnourished diet supplemented with fat. MD+Protein (blue dotted), a malnourished diet supplemented with protein. MD+Fat+Protein (pink solid), a malnourished diet supplemented with fat and protein. TyT (red solid), standard regular food fed F2 mice derived from unvaccinated mothers. B. Relative body weight changes of these F2 mice after receiving 2 μg typhoid toxin for the 14 day-experimental period. C. Balance beam walking results of these F2 mice on days 0, 5, and 6 after the toxin challenge. ND (normal diet) fed mice values have been added for reference. D. Maternal antibody titers specific to PltB pentamer available in 1 μl plasma samples of indicated F2 mice from weeks 4 to 6. The typhoid toxin challenge was conducted in week 5. Lines and bars represent the mean ± SEM. n = 6-7 F2 mice per group. E, The expression of FcRn on the yolk sac of ND, MD, MD+Protein, and MD+Fat F1 mice. Data from three independent experiments. Boxes and whiskers in E represent average, min, and max with all data points. NS; not significant. *, p<0.05; **, p<0.01; ***, p<0.001; ****, p<0.0001 as indicated. The log-rank test was performed for A and two-tailed unpaired t-tests for B-E. See also Table 4.
Fig 7
Fig 7. Providing additional toxin-neutralizing antibodies to MD progenies protected all MD F2 mice from a lethal dose of typhoid toxin challenge.
A, Survival of the F2 mice received 2 μg typhoid toxin (TyT). MD:PltBVac (olive), malnourished diet-fed F2 mice maternally vaccinated with PltBVac. MD:PltBVac+TyTx4 (black), malnourished diet-fed F2 mice maternally vaccinated with PltBVac and administered with TyTx4 (monoclonal antibody recognizing the PltB subunits) 30 min before the typhoid toxin challenge. MD:PltBVac+TyTx11 (orange), malnourished diet-fed F2 mice maternally vaccinated with PltBVac and administered with TyTx11 (monoclonal antibody recognizing the CdtB subunit). n = 6–7 F2 mice per group. B, Body weight changes of these F2 mice for the 14 day-experimental period after the typhoid toxin challenge. C, Circulating neutrophil counts in peripheral blood of these F2 mice on day 6 after the typhoid toxin challenge. D, Balance beam walking results of these F2 mice on days 0, 5, 6, and 7 after the typhoid toxin challenge. E-I, Maternal antibody titers available in MD-PltBVac F2 mice at W3 were above the threshold antibody level required for full protection. E, Timelines of indicated diet-feeding, maternal vaccinations, toxin challenge, and assessments for protection. Both F1 and F2 mice were fed with indicated diets, which were started when F1 mice were 3 weeks old and continued throughout the experimental timeframe. F. Maternal antibody titers specific to PltB pentamer available in 1 μl plasma samples of indicated F2 mice at week 3 (W3). The typhoid toxin challenge was conducted 1-day after harvesting blood samples for antibody measurement. G, Survival of the maternally vaccinated (PltBVac) F2 mice challenged with 2 μg typhoid toxin (TyT). ND (green dotted), normal diet-fed F2 mice. NDAbx (black dotted), normal diet-fed F2 mice obtained from corresponding antibiotics treated F1. MD (olive dotted), malnourished diet-fed F2 mice. MDAbx (blue solid), malnourished diet-fed F2 mice obtained from corresponding antibiotics treated F1, TyT (red solid), standard regular food-fed F2 mice derived from unvaccinated mothers. H. Relative body weight changes of these F2 mice after receiving 2 μg typhoid toxin for the 14 day-experimental period. I. Balance beam walking results of these F2 mice on days 0, 5, and 6 after the toxin challenge. Lines and bars represent the mean ± SEM. n = 6 (F2) mice per group. NS, not significant. Bars represent the mean ± SEM. NS, not significant; **, p<0.01; ****, p<0.0001, relative to MD:PltBVac+TyT for B, to the group as indicated in the graph for C and F, to the day 0 values for D, and to the corresponding TyT group for I. The log-rank test was performed for A and G, while two-tailed unpaired t-test was conducted for B-D, F, and I.

Similar articles

Cited by

References

    1. Stanaway JD RR, Blacker BF, Goldberg EM, Khalil IA, Troeger CE, Andrews JR, et al.. The global burden of typhoid and paratyphoid fevers: a systematic analysis for the Global Burden of Disease Study 2017. Lancet Infect Dis. 2019;19(4):369–81. doi: 10.1016/S1473-3099(18)30685-6 . - DOI - PMC - PubMed
    1. Feasey NA, Gaskell K, Wong V, Msefula C, Selemani G, Kumwenda S, et al.. Rapid emergence of multidrug resistant, H58-lineage Salmonella typhi in Blantyre, Malawi. PLoS Negl Trop Dis. 2015;9(4):e0003748. doi: 10.1371/journal.pntd.0003748 . - DOI - PMC - PubMed
    1. Klemm EJ, Shakoor S, Page AJ, Qamar FN, Judge K, Saeed DK, et al.. Emergence of an Extensively Drug-Resistant Salmonella enterica Serovar Typhi Clone Harboring a Promiscuous Plasmid Encoding Resistance to Fluoroquinolones and Third-Generation Cephalosporins. MBio. 2018;9(1):e00105–18. doi: 10.1128/mBio.00105-18 . - DOI - PMC - PubMed
    1. Qamar FN, Yousafzai MT, Sultana S, Baig A, Shakoor S, Hirani F, et al.. A Retrospective Study of Laboratory-Based Enteric Fever Surveillance, Pakistan, 2012–2014. J Infect Dis. 2018;218(suppl_4):S201–S5. doi: 10.1093/infdis/jiy205 . - DOI - PMC - PubMed
    1. Kim C, Latif I, Neupane DP, Lee GY, Kwon RS, Batool A, et al.. The molecular basis of extensively drug-resistant Salmonella Typhi isolates from pediatric septicemia patients. PLoS One. 2021;16(9):e0257744. Epub 2021/09/29. doi: 10.1371/journal.pone.0257744 ; PubMed Central PMCID: PMC8478237. - DOI - PMC - PubMed

Publication types

Substances

LinkOut - more resources