

Uncovering the universality of self-replication in protein aggregation and its link to disease
- PMID: 35960802
- PMCID: PMC9374340
- DOI: 10.1126/sciadv.abn6831
Uncovering the universality of self-replication in protein aggregation and its link to disease
Abstract
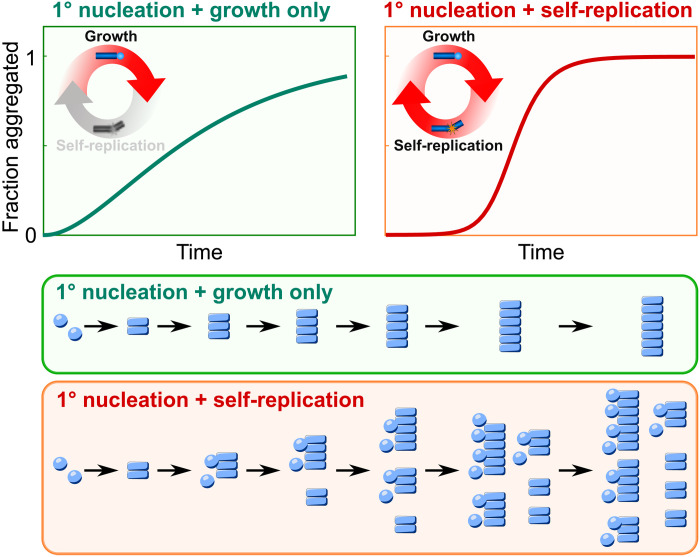
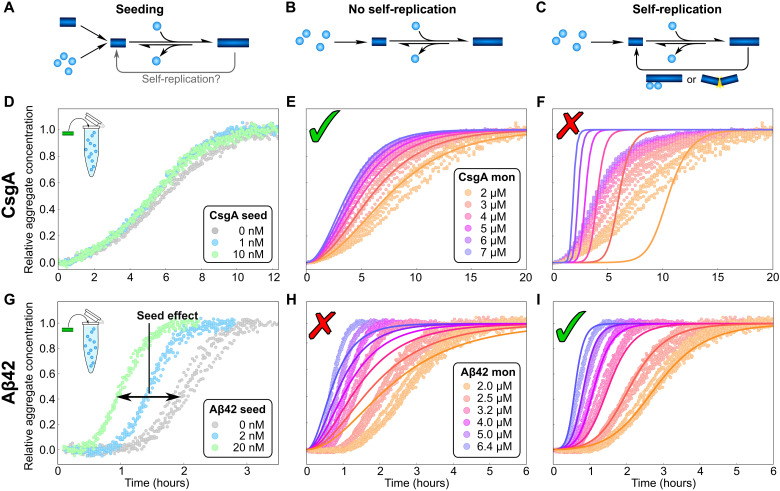
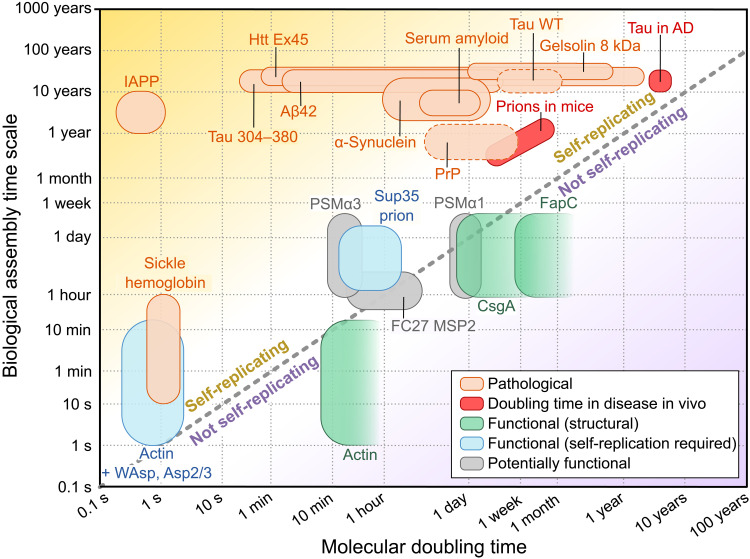
Fibrillar protein aggregates are a hallmark of a range of human disorders, from prion diseases to dementias, but are also encountered in several functional contexts. Yet, the fundamental links between protein assembly mechanisms and their functional or pathological roles have remained elusive. Here, we analyze the aggregation kinetics of a large set of proteins that self-assemble by a nucleated-growth mechanism, from those associated with disease, over those whose aggregates fulfill functional roles in biology, to those that aggregate only under artificial conditions. We find that, essentially, all such systems, regardless of their biological role, are capable of self-replication. However, for aggregates that have evolved to fulfill a structural role, the rate of self-replication is too low to be significant on the biologically relevant time scale. By contrast, all disease-related proteins are able to self-replicate quickly compared to the time scale of the associated disease. Our findings establish the ubiquity of self-replication and point to its potential importance across aggregation-related disorders.
Figures

Similar articles
-
Direct Observation of Oligomerization by Single Molecule Fluorescence Reveals a Multistep Aggregation Mechanism for the Yeast Prion Protein Ure2.J Am Chem Soc. 2018 Feb 21;140(7):2493-2503. doi: 10.1021/jacs.7b10439. Epub 2018 Feb 7. J Am Chem Soc. 2018. PMID: 29357227 Free PMC article.
-
Self-Replication of Prion Protein Fragment 89-230 Amyloid Fibrils Accelerated by Prion Protein Fragment 107-143 Aggregates.Int J Mol Sci. 2020 Oct 8;21(19):7410. doi: 10.3390/ijms21197410. Int J Mol Sci. 2020. PMID: 33049945 Free PMC article.
-
Effect of electrostatics on aggregation of prion protein Sup35 peptide.J Phys Condens Matter. 2012 Apr 25;24(16):164205. doi: 10.1088/0953-8984/24/16/164205. Epub 2012 Mar 30. J Phys Condens Matter. 2012. PMID: 22466073 Free PMC article.
-
The molecular processes underpinning prion-like spreading and seed amplification in protein aggregation.Curr Opin Neurobiol. 2020 Apr;61:58-64. doi: 10.1016/j.conb.2020.01.010. Epub 2020 Feb 21. Curr Opin Neurobiol. 2020. PMID: 32092527 Review.
-
Prion-like Mechanism in Amyotrophic Lateral Sclerosis: are Protein Aggregates the Key?Exp Neurobiol. 2015 Mar;24(1):1-7. doi: 10.5607/en.2015.24.1.1. Epub 2014 Dec 17. Exp Neurobiol. 2015. PMID: 25792864 Free PMC article. Review.
Cited by
-
α-Synuclein oligomers form by secondary nucleation.Nat Commun. 2024 Aug 17;15(1):7083. doi: 10.1038/s41467-024-50692-4. Nat Commun. 2024. PMID: 39153989 Free PMC article.
-
Current understanding of metal-dependent amyloid-β aggregation and toxicity.RSC Chem Biol. 2022 Nov 22;4(2):121-131. doi: 10.1039/d2cb00208f. eCollection 2023 Feb 8. RSC Chem Biol. 2022. PMID: 36794021 Free PMC article. Review.
-
Mechanistic Models of Protein Aggregation Across Length-Scales and Time-Scales: From the Test Tube to Neurodegenerative Disease.Front Neurosci. 2022 Jun 30;16:909861. doi: 10.3389/fnins.2022.909861. eCollection 2022. Front Neurosci. 2022. PMID: 35844223 Free PMC article. Review.
-
Aβ Oligomer Dissociation Is Catalyzed by Fibril Surfaces.ACS Chem Neurosci. 2024 Jun 5;15(11):2296-2307. doi: 10.1021/acschemneuro.4c00127. Epub 2024 May 24. ACS Chem Neurosci. 2024. PMID: 38785363 Free PMC article.
-
The bacterial chaperone CsgC inhibits functional amyloid CsgA formation by promoting the intrinsically disordered pre-nuclear state.J Biol Chem. 2025 Jun;301(6):110217. doi: 10.1016/j.jbc.2025.110217. Epub 2025 May 8. J Biol Chem. 2025. PMID: 40348191 Free PMC article.
References
-
- Chiti F., Dobson C. M., Protein misfolding, functional amyloid, and human disease. Annu. Rev. Biochem. 75, 333–366 (2006). - PubMed
-
- Chiti F., Dobson C. M., Protein misfolding, amyloid formation, and human disease: A summary of progress over the last decade. Annu. Rev. Biochem. 86, 27–68 (2017). - PubMed
-
- Oosawa F., Asakura S., Hotta K., Imai N., Ooi T., G-F transformation of actin as a fibrous condensation. Aust. J. Polit. Sci. 37, 323–336 (1959).
-
- Fowler D. M., Koulov A. V., Balch W. E., Kelly J. W., Functional amyloid–from bacteria to humans. Trends Biochem. Sci. 32, 217–224 (2007). - PubMed
-
- Knowles T. P. J., Vendruscolo M., Dobson C. M., The amyloid state and its association with protein misfolding diseases. Nat. Rev. Mol. Cell Biol. 15, 384–396 (2014). - PubMed
LinkOut - more resources
Full Text Sources
