. 2022 Aug 12;8(32):eabo3289.
doi: 10.1126/sciadv.abo3289. Epub 2022 Aug 12.

Bioinspired large Stokes shift small molecular dyes for biomedical fluorescence imaging

Affiliations

Bioinspired large Stokes shift small molecular dyes for biomedical fluorescence imaging

Hao Chen et al. Sci Adv. .

Abstract

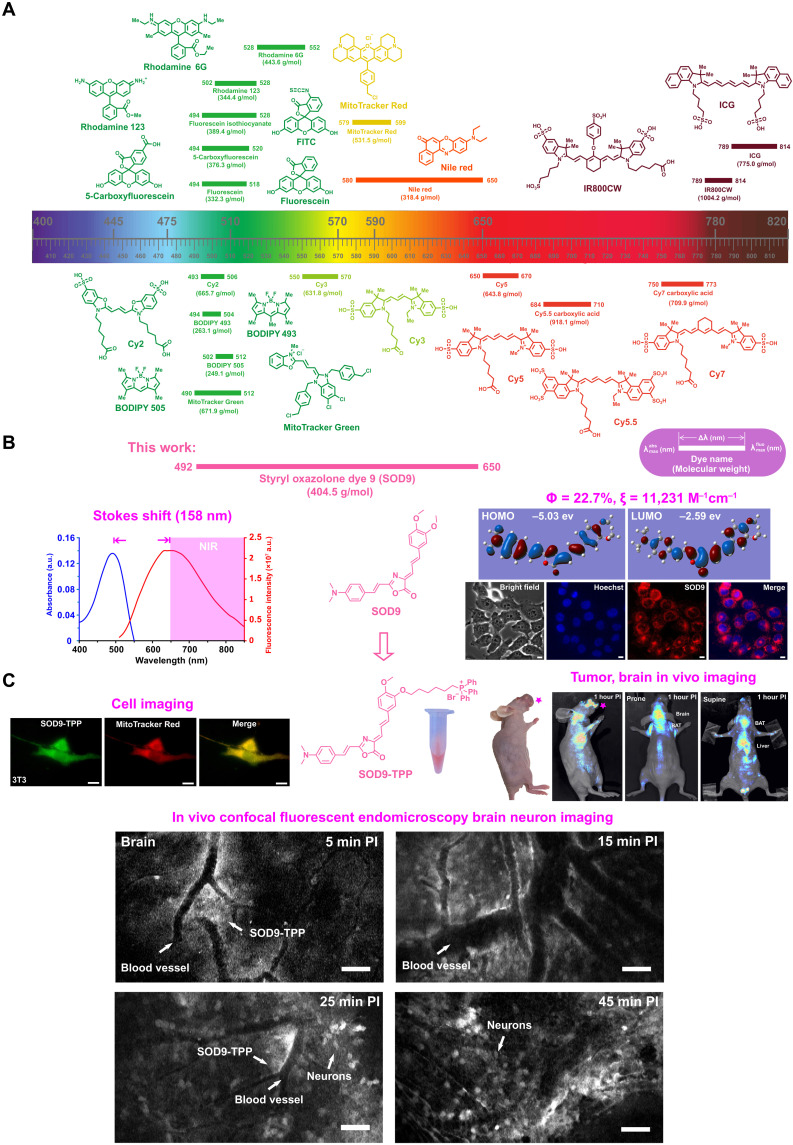
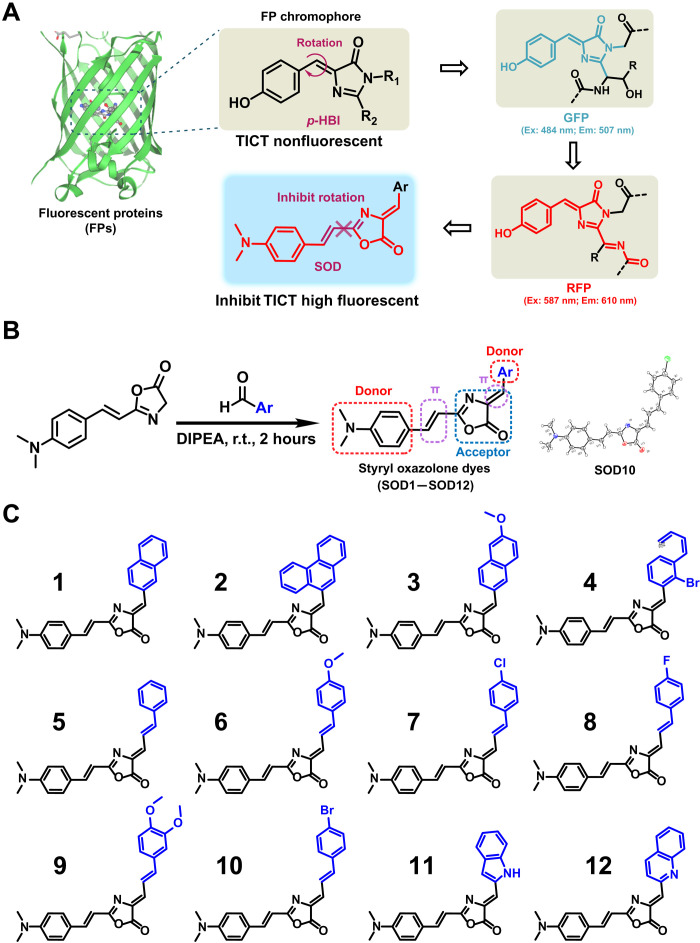
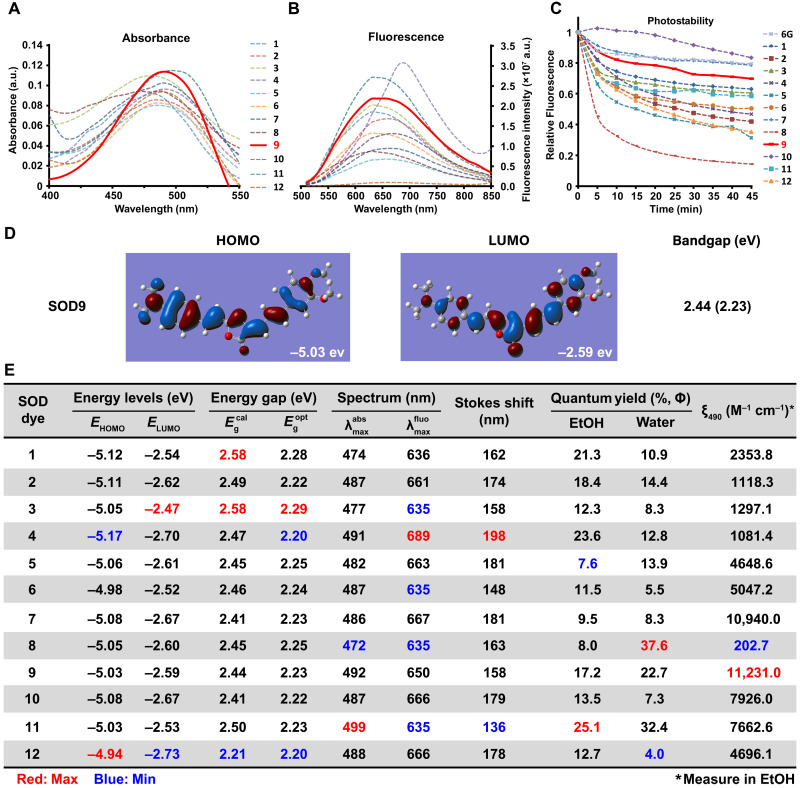
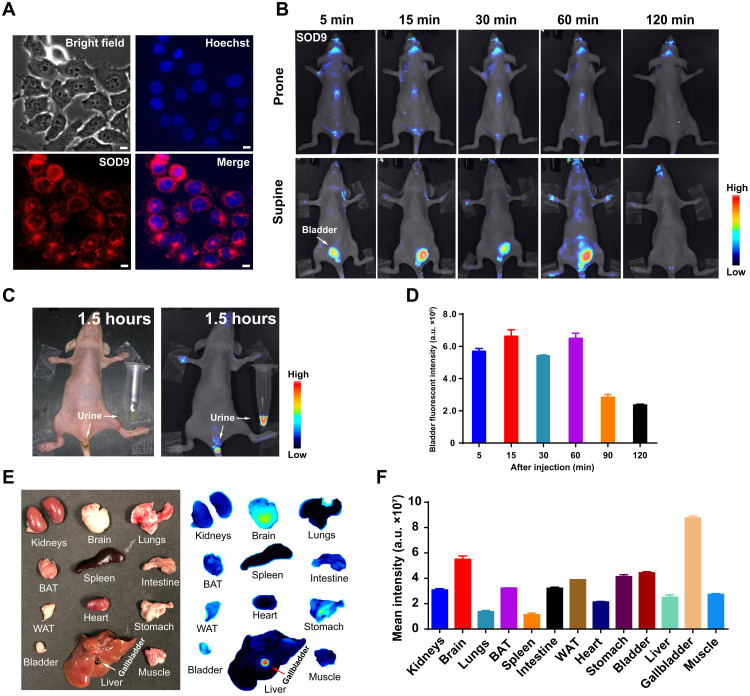
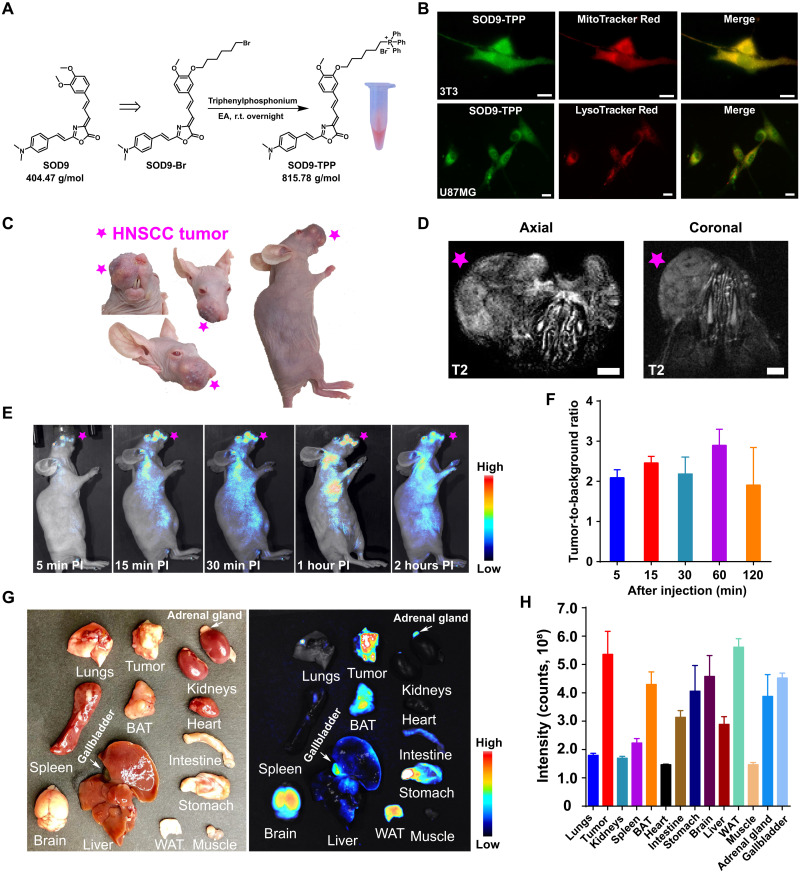
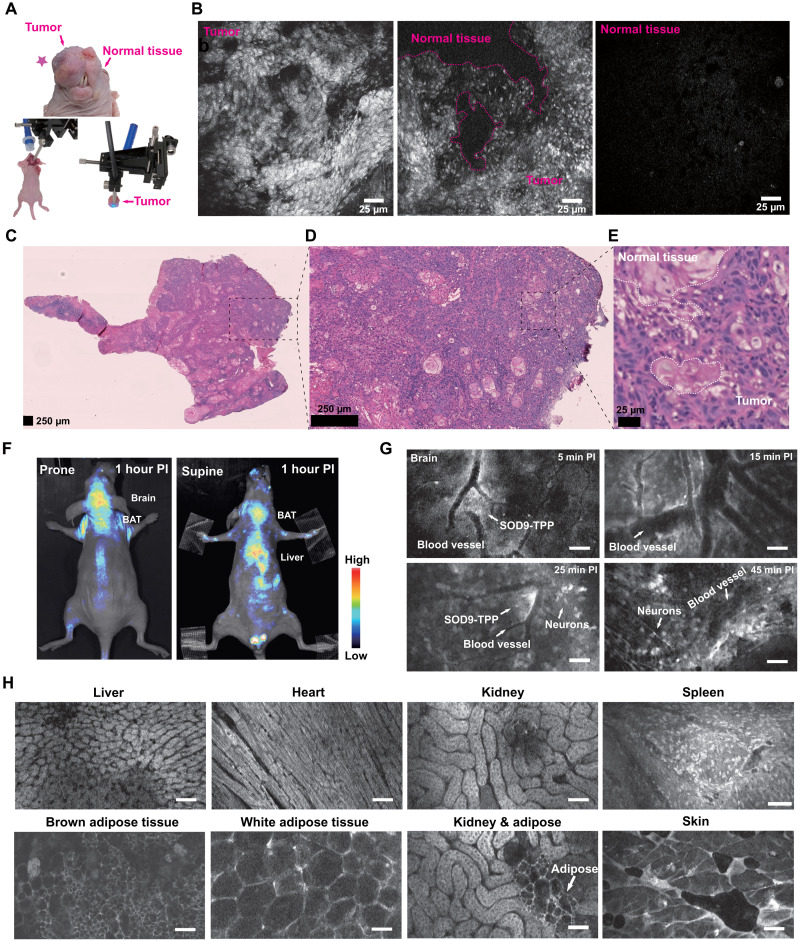
Long Stokes shift dyes that minimize cross-talk between the excitation source and fluorescent emission to improve the signal-to-background ratio are highly desired for fluorescence imaging. However, simple small molecular dyes with large Stokes shift (more than 120 nanometers) and near-infrared (NIR) emissions have been rarely reported so far. Here, inspired by the chromophore chemical structure of fluorescent proteins, we designed and synthesized a series of styrene oxazolone dyes (SODs) with simple synthetic methods, which show NIR emissions (>650 nanometers) with long Stokes shift (ranged from 136 to 198 nanometers) and small molecular weight (<450 daltons). The most promising SOD9 shows rapid renal excretion and blood-brain barrier passing properties. After functioning with the mitochondrial-targeted triphenylphosphonium (TPP) group, the resulting SOD9-TPP can be engineered for head-neck tumor imaging, fluorescence image-guided surgery, brain neuroimaging, and on-site pathologic analysis. In summary, our findings add an essential small molecular dye category to the classical dyes.


Figures

Fig. 1.
Fig. 1.. Long Stokes shift SOD for biomedical fluorescence imaging.
(A) Chemical structure, molecular weight, max absorption, and emission wavelength, Stokes shift of typical commercial fluorescent dyes. (B) The absorption, fluorescence spectrum (left), chemical structure (middle), quantum yield, molar extinction coefficient (in water), computed isodensity surfaces of highest occupied molecular orbital (HOMO) and lowest unoccupied molecular orbital (LUMO), and cell imaging of the represent styrene oxazolone dye 9 (SOD9). (C) Triphenylphosphonium (TPP)–modified SOD9 for cell mitochondrial, in vivo head-neck cancer, and brain neuron imaging. a.u., arbitrary units; PI, post injection.
Fig. 2.
Fig. 2.. Design and synthesis of SODs.
(A) The chromophore chemical structures of GFP and RFP. (B) Synthesis of SODs (left) and the crystal structure of SOD10 (right). DIPEA, N,N-Diisopropylethylamine. (C) The chemical structures of SOD dyes. Ex., excitation; Em., emission; TICT, twisted intramolecular charge transfer; r.t., room temperature.
Fig. 3.
Fig. 3.. Optical characteristics of SODs.
The absorbance (A), fluorescence spectrum (B), and photostabilities (C) of SODs were measured in water with the concentration of 20, 12, and 10 μM, respectively (6G represents rhodamine 6G). (D) Density functional theory (DFT) optimized molecular orbital plots (HOMO and LUMO) of SOD9. (E) The optical properties summary of SOD dyes. Red is the maximum value, and blue is the minimum value of the same column. EtOH, ethanol.
Fig. 4.
Fig. 4.. SOD9’s in vivo pharmacokinetics by fluorescence imaging.
(A) SOD9 fluorescence imaging in NIH-3T3 cell (red) and merge with the nuclear stains Hoechst (blue). Scale bars, 10 μm. (B) Whole-body NIR imaging of nude mice (n = 3, prone and supine positions) after intravenous injection of SOD9 (2.5 mg/kg, 6.18 μmol/kg). The signal was collected in the 650- to 800-nm channel with an excitation at 500 nm. (C) The colored imaging (top) and fluorescence imaging of the nude mice with urine excretion 1.5 hours after intravenous injection of SOD9. (D) Comparison of bladder fluorescent intensities at different time points after intravenous injection of SOD9. Error bars, means ± SD (n = 3). (E) Ex vivo imaging of the major organs dissected after euthanizing animals at 2 hours after intravenous injection of SOD9 (10 mg/kg). Left: colored picture; right: fluorescence imaging. (F) Comparison of mean intensities for the major organs at 2 hours after intravenous injection of SOD9. Error bars, means ± SD (n = 3).
Fig. 5.
Fig. 5.. SOD9-TPP for orthotopic HNSCC tumor imaging.
(A) The synthesis of SOD9-TPP and the colored pictures of SOD9-TPP dissolved in water. EA, ethyl acetate. (B) Colocalization of SOD-TPP, mitochondrial-specific probe (MitoTracker Red), and lysosome-specific probe (LysoTracker Red) in NIH-3T3 and U87MG cell lines. Scale bars, 10 μm. (C) The colored picture of the orthotopic HNSCC mouse (SCC090; tumor marked with the red pentagram, the same applies hereinafter). (D) 3T magnetic resonance imaging T2 imaging of the mouth of the orthotopic HNSCC mouse. Scale bars, 2 mm. (E) Whole-body NIR imaging of the orthotopic HNSCC nude mice (n = 3, left lateral position) after intravenous injection of SOD9-TPP (5.0 mg/kg, 6.13 μmol/kg). (F) Comparison of the tumor-to-background ratio (TBR) at different time points after intravenous injection of SOD9-TPP. Error bars, means ± SD (n = 3). (G) Ex vivo imaging of the major organs dissected after euthanizing mice at 48 hours after intravenous injection of SOD9-TPP. Left: Colored picture. Right: Fluorescence imaging. (H) Comparison of mean intensities for the HNSCC tumor and the major organs at 48 hours after intravenous injection of SOD9-TPP. Error bars, means ± SD (n = 3).
Fig. 6.
Fig. 6.. SOD9-TPP for fluorescence image–guided surgery, brain neuroimaging, and on-site pathologic analysis.
(A) Top: The colored picture of the orthotopic HNSCC mouse (SCC090; tumor marked with the red pentagram). Bottom left: The setup’s color photo of the confocal fluorescent endomicroscopy imaging–guided surgery. Bottom right: The setup’s colored photo of the confocal fluorescent endomicroscopy imaging of the resected tissue. (B) Confocal fluorescent endomicroscopy imaging of the dissected HNSCC tumor during fluorescence image–guided surgery of the mice 2 hours after intravenous injection of SOD9-TPP (5.0 mg/kg, 6.13 μmol/kg). Right, tumor; middle, tumor and normal tissue; left, normal tissue. (C) H&E staining of HNSCC tumor tissue sections. (D) The zoomed picture of (C). (E) The zoomed picture of (D). (F) Whole-body NIR imaging of nude mice (n = 3, prone and supine positions) after intravenous injection of SOD9-TPP (5.0 mg/kg, 6.13 μmol/kg); SOD9-TPP was found accumulated in the brain, BAT, and liver. (G) Different time points in vivo confocal fluorescent endomicroscopy imaging of brain neurons with the skull opened. Scale bars, 25 μm. (H) In vivo confocal fluorescent endomicroscopy imaging of major organs with abdomen and chest opened. Scale bars, 25 μm.

References

    1. Huang J., Pu K., Activatable molecular probes for second near-infrared fluorescence, chemiluminescence, and photoacoustic imaging. Angew. Chem. Int. Ed. Engl. 59, 11717–11731 (2020). - PubMed
    1. Hong G., Antaris A. L., Dai H., Near-infrared fluorophores for biomedical imaging. Nat. Biomed. Eng. 1, 0010 (2017).
    1. Huang J., Xie C., Zhang X., Jiang Y., Li J., Fan Q., Pu K., Renal-clearable molecular semiconductor for second near-infrared fluorescence imaging of kidney dysfunction. Angew. Chem. Int. Ed. Engl. 58, 15120–15127 (2019). - PubMed
    1. Zhang J., Campbell R. E., Ting A. Y., Tsien R. Y., Creating new fluorescent probes for cell biology. Nat. Rev. Mol. Cell Biol. 3, 906–918 (2002). - PubMed
    1. Cheng P., Pu K., Molecular imaging and disease theranostics with renal-clearable optical agents. Nat. Rev. Mater. 6, 1095–1113 (2021).