

Virtual particle Monte Carlo: A new concept to avoid simulating secondary particles in proton therapy dose calculation
- PMID: 35960865
- PMCID: PMC9588716
- DOI: 10.1002/mp.15913
Virtual particle Monte Carlo: A new concept to avoid simulating secondary particles in proton therapy dose calculation
Abstract
Background: In proton therapy dose calculation, Monte Carlo (MC) simulations are superior in accuracy but more time consuming, compared to analytical calculations. Graphic processing units (GPUs) are effective in accelerating MC simulations but may suffer thread divergence and racing condition in GPU threads that degrades the computing performance due to the generation of secondary particles during nuclear reactions.
Purpose: A novel concept of virtual particle (VP) MC (VPMC) is proposed to avoid simulating secondary particles in GPU-accelerated proton MC dose calculation and take full advantage of the computing power of GPU.
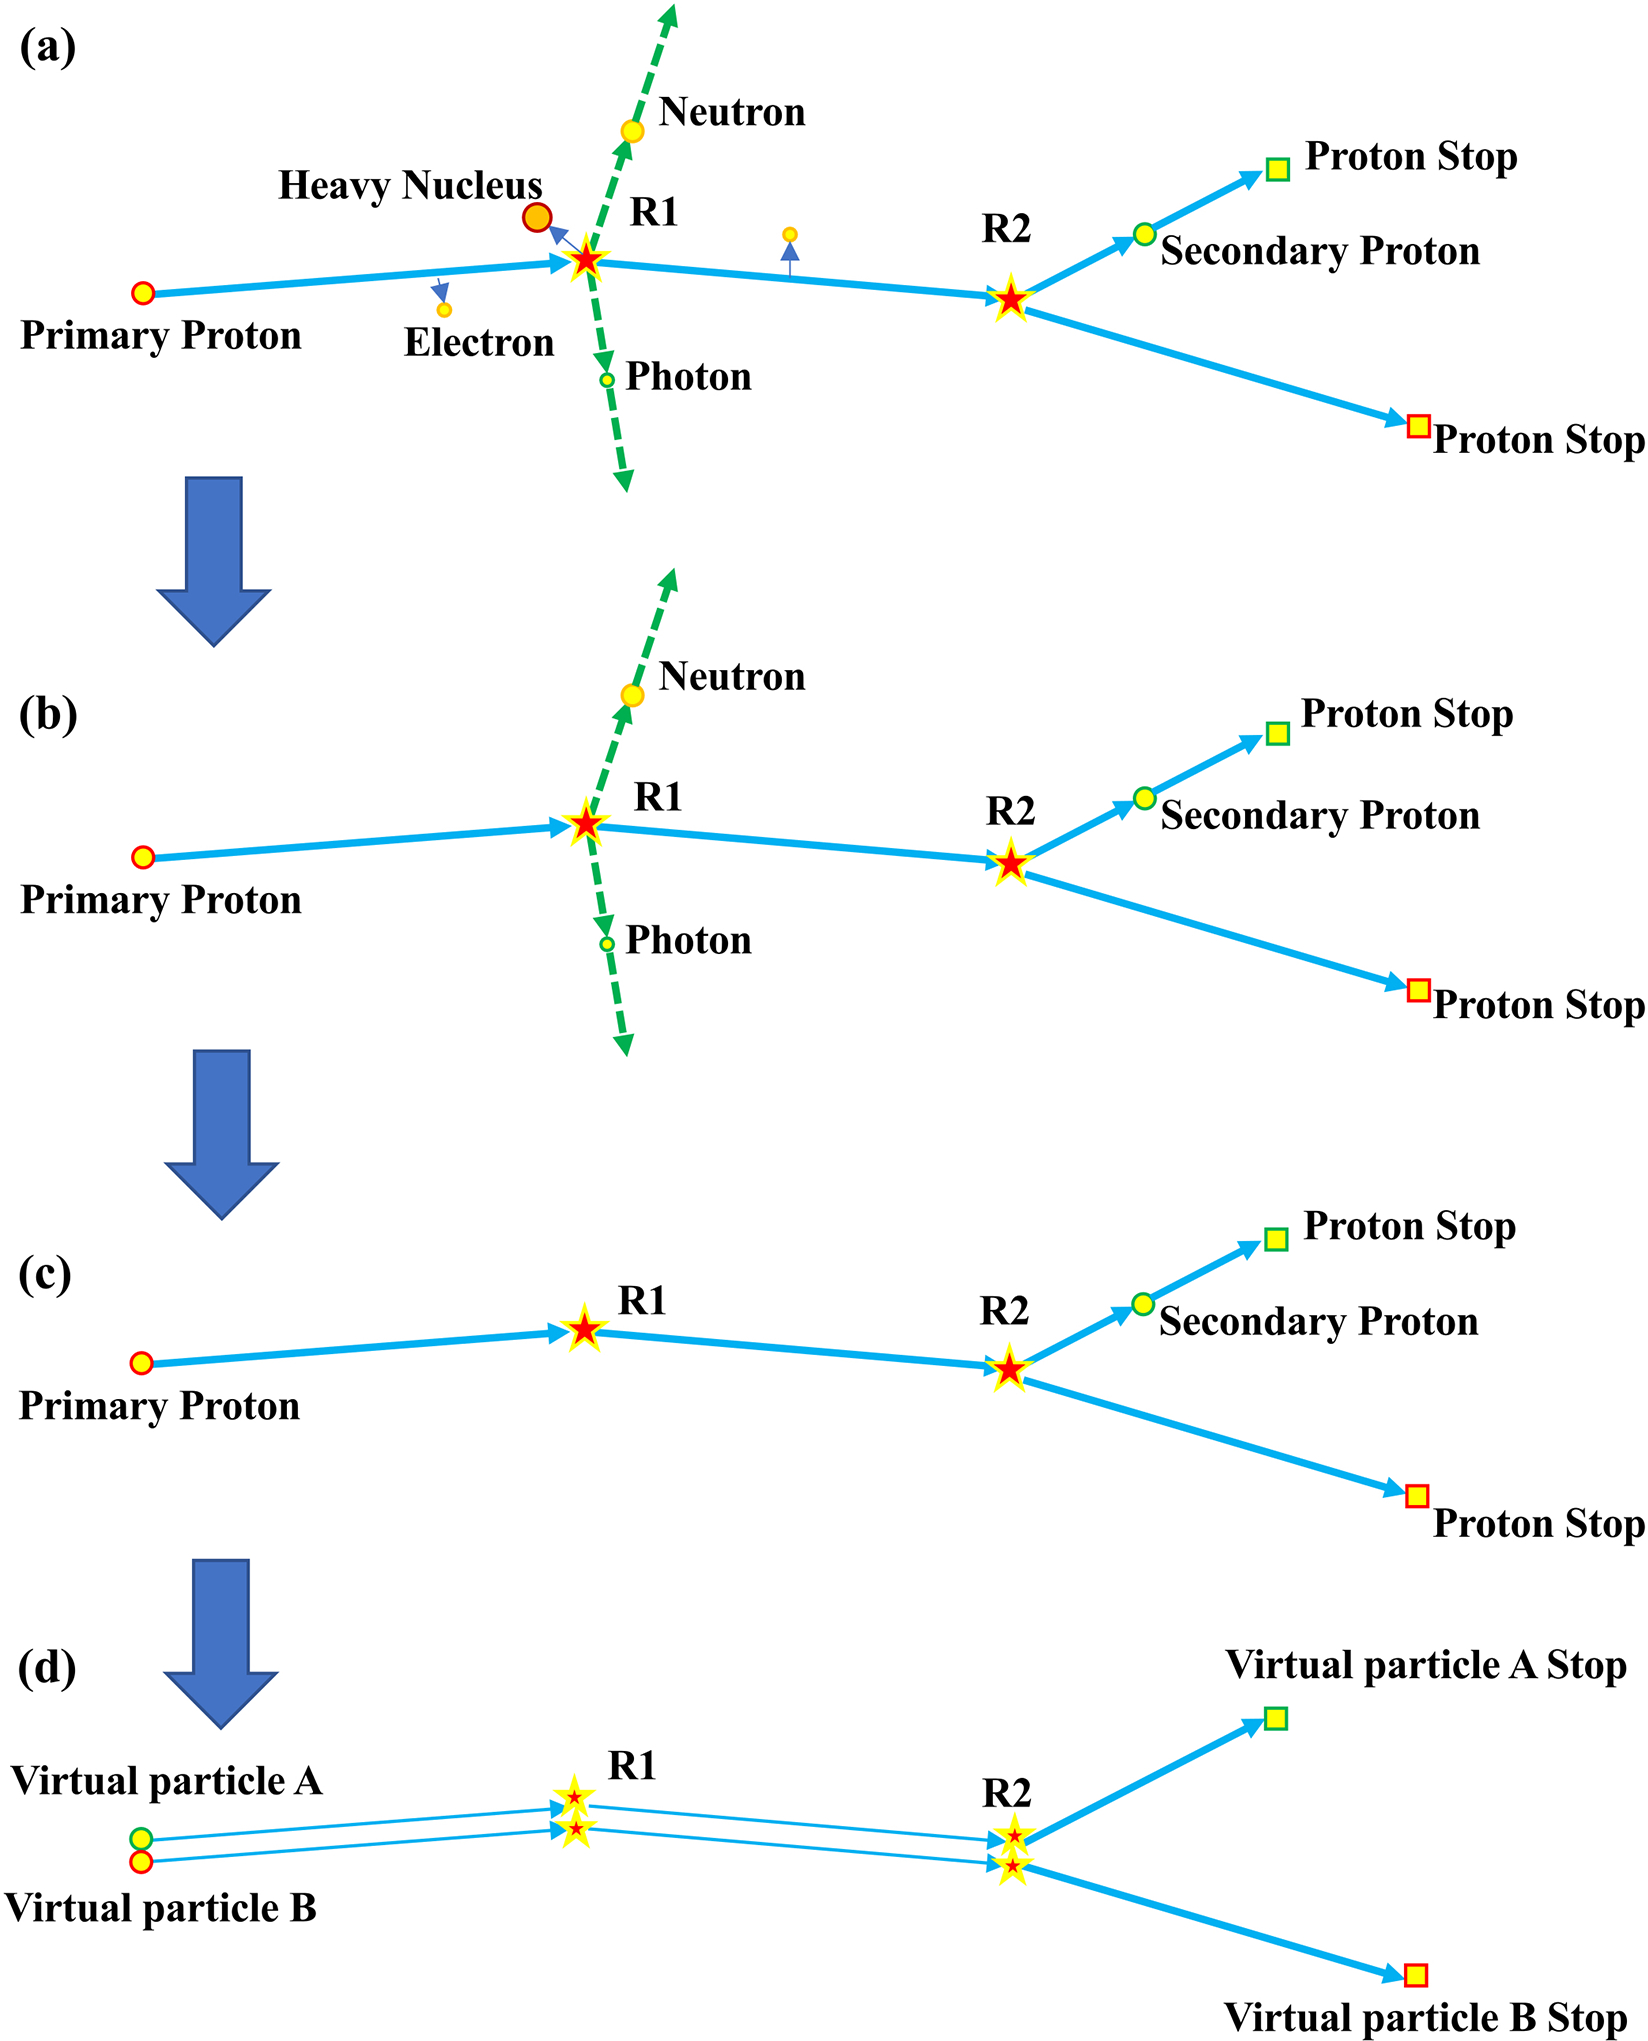
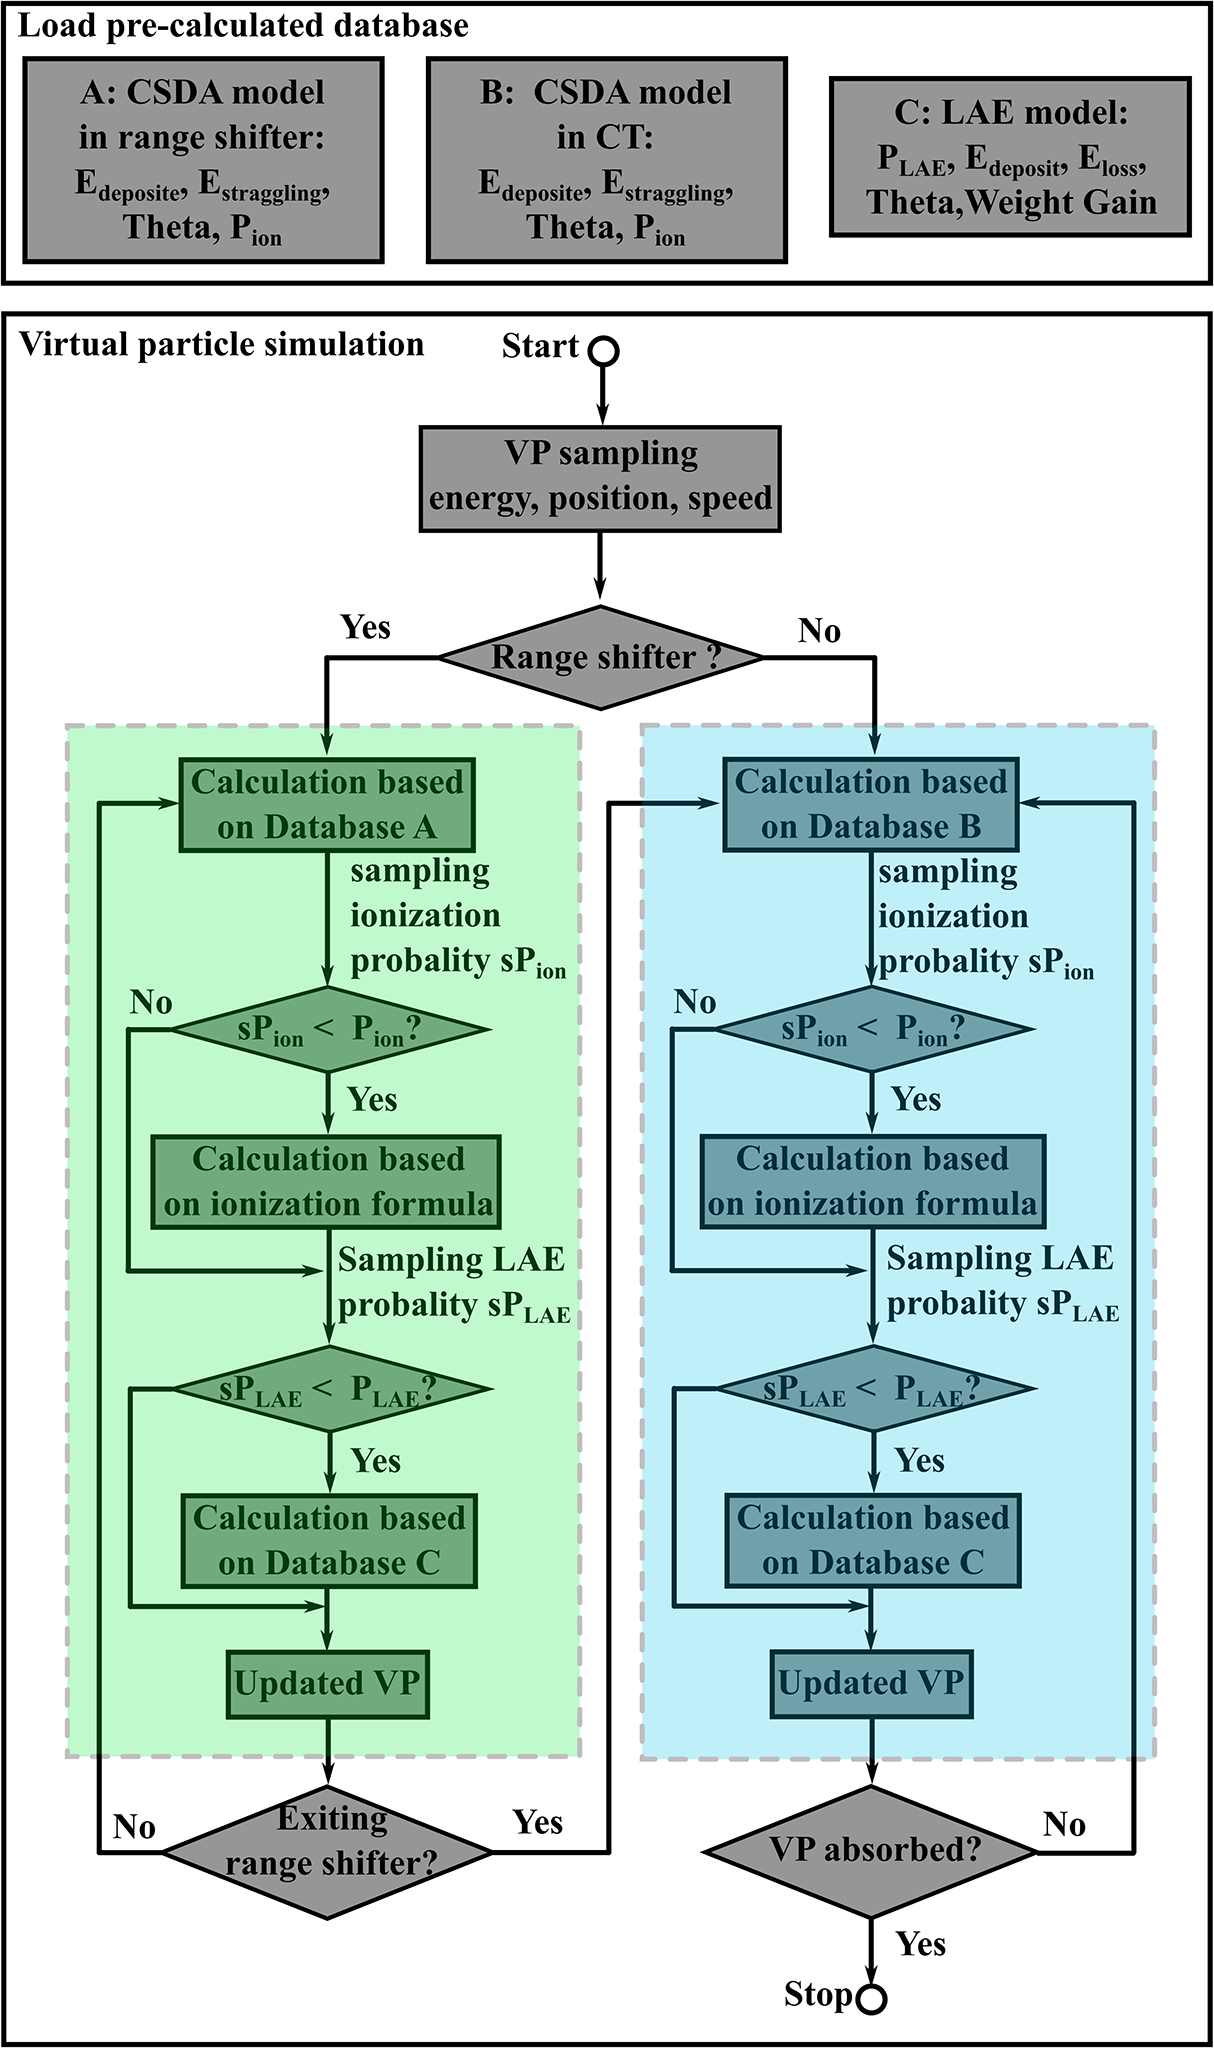
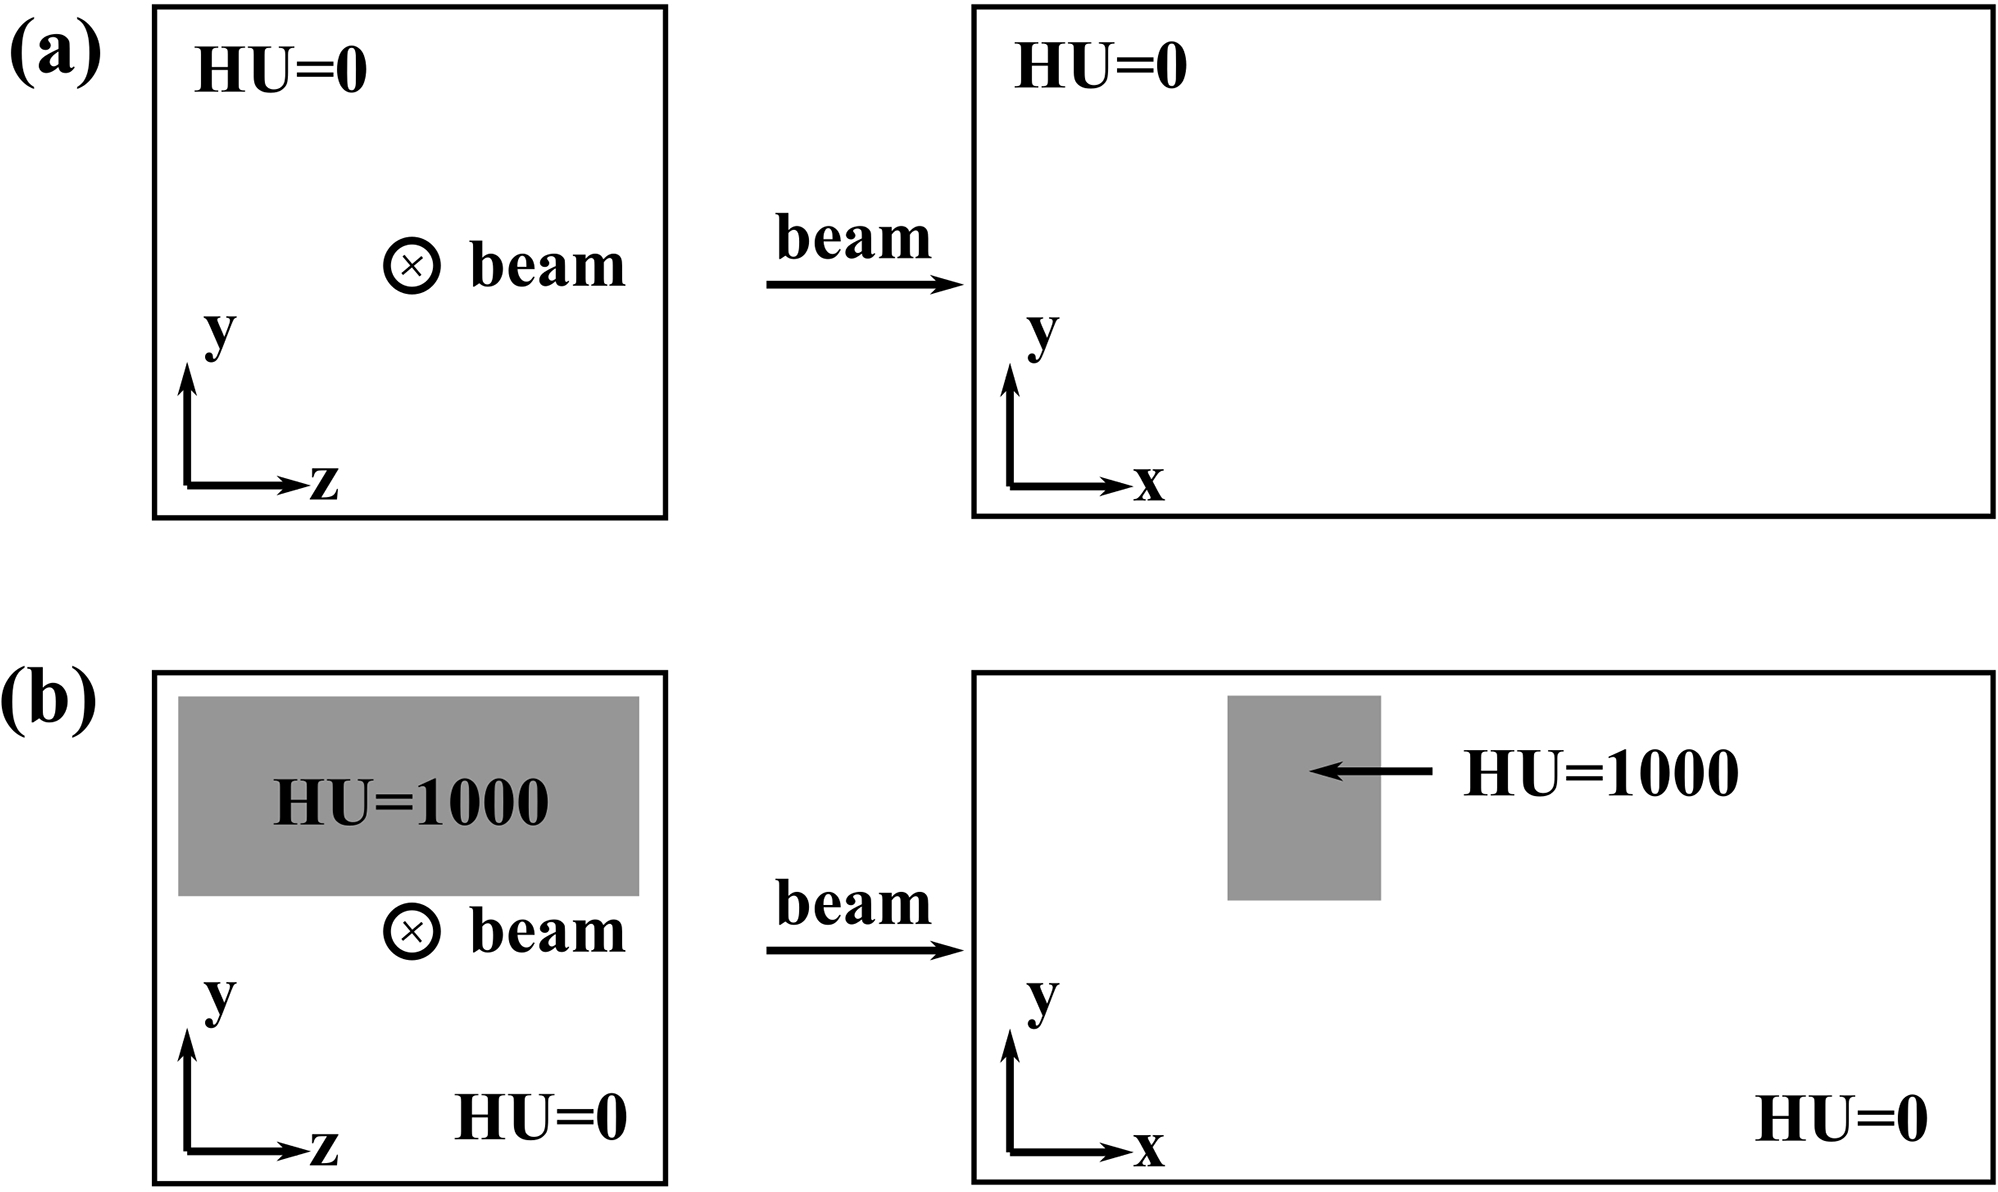
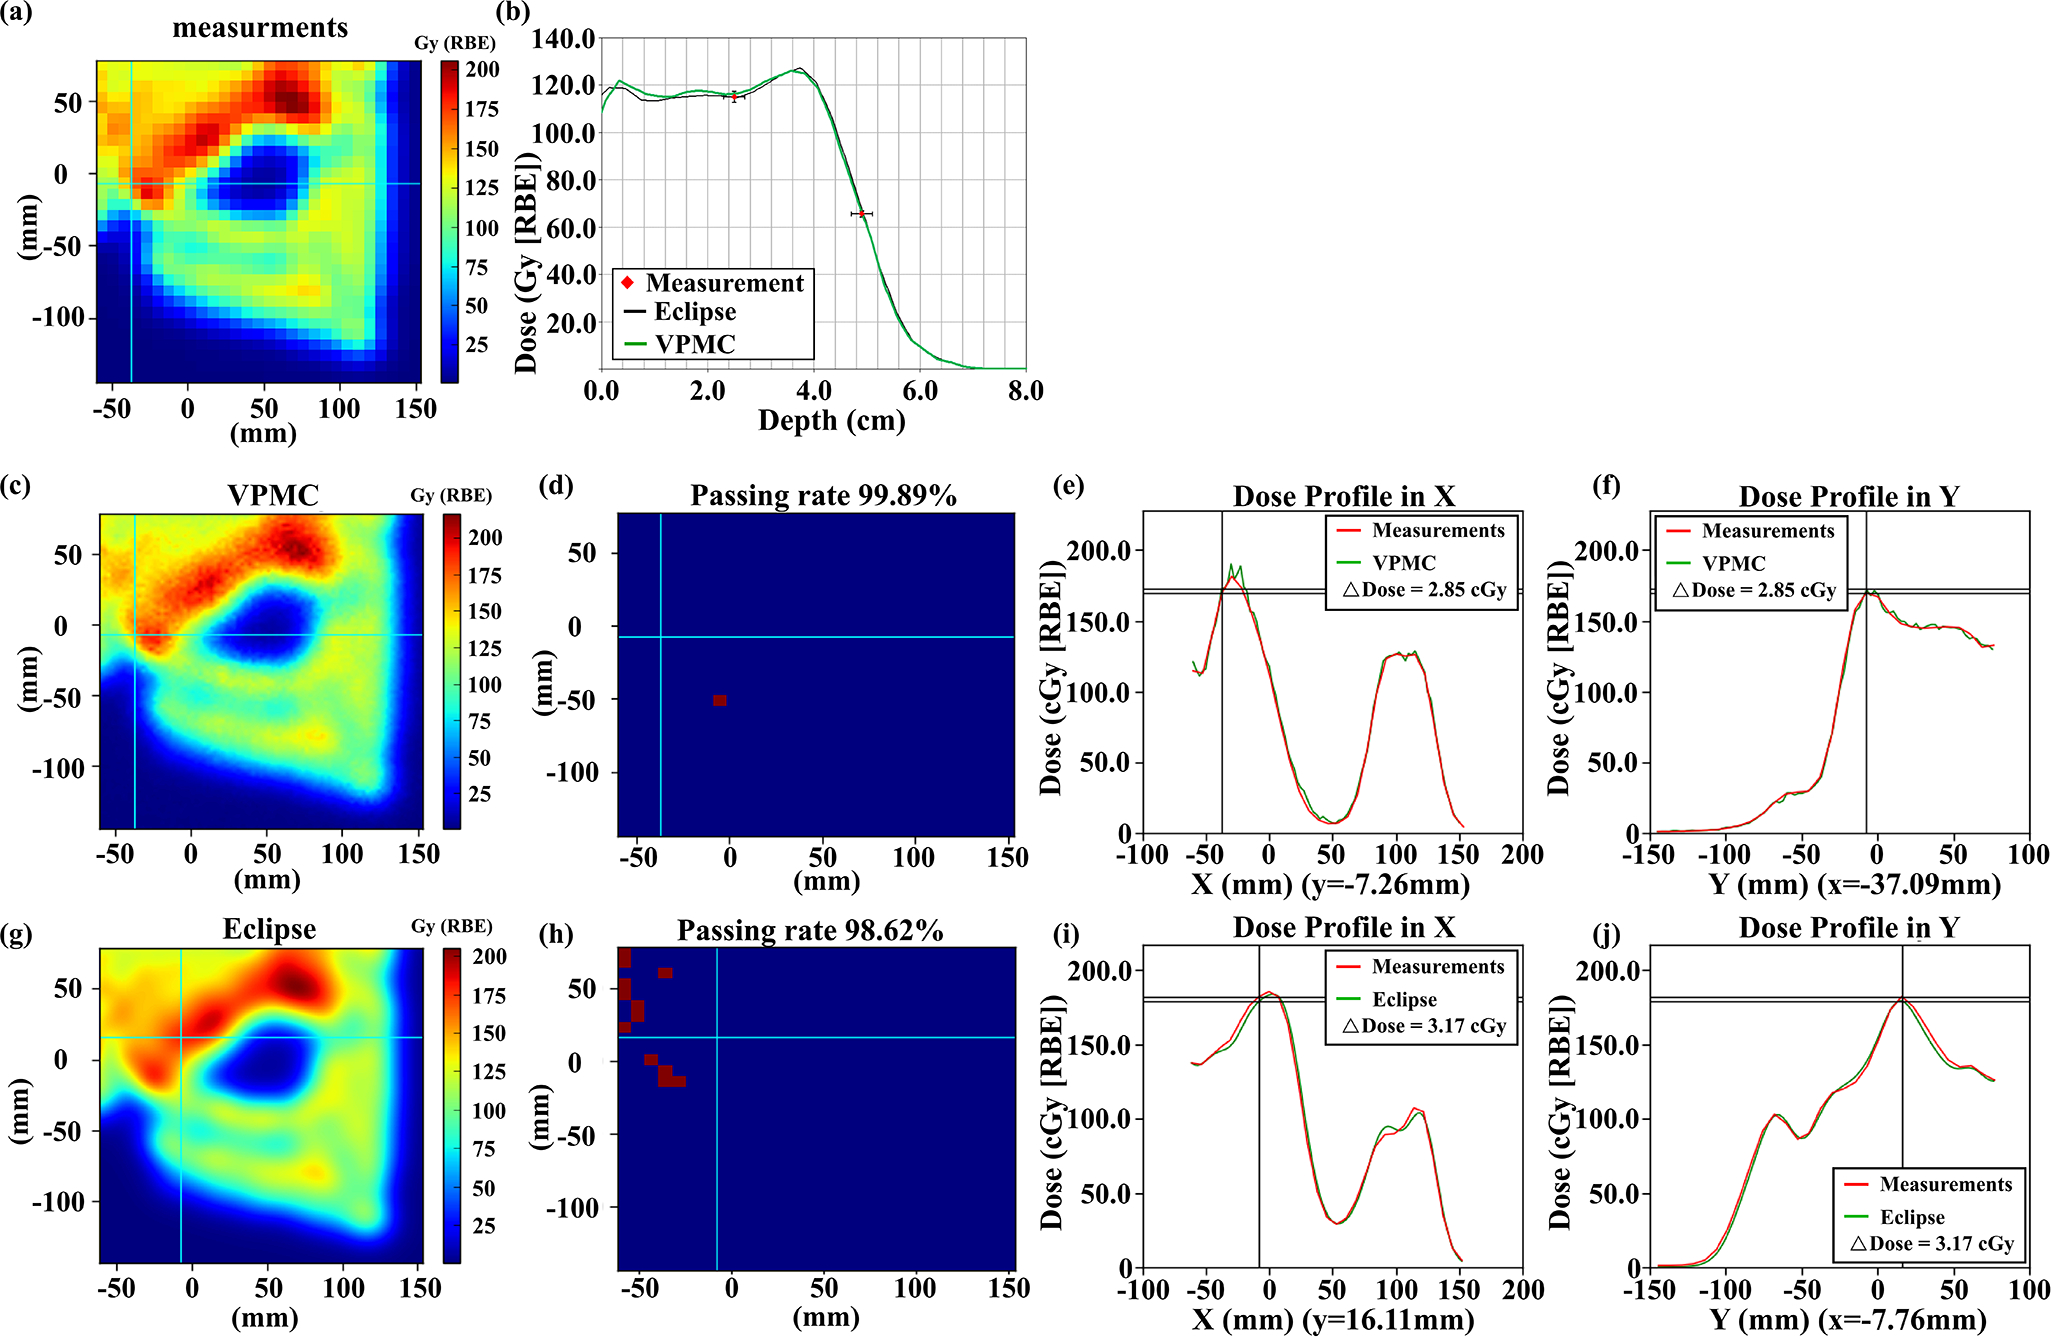
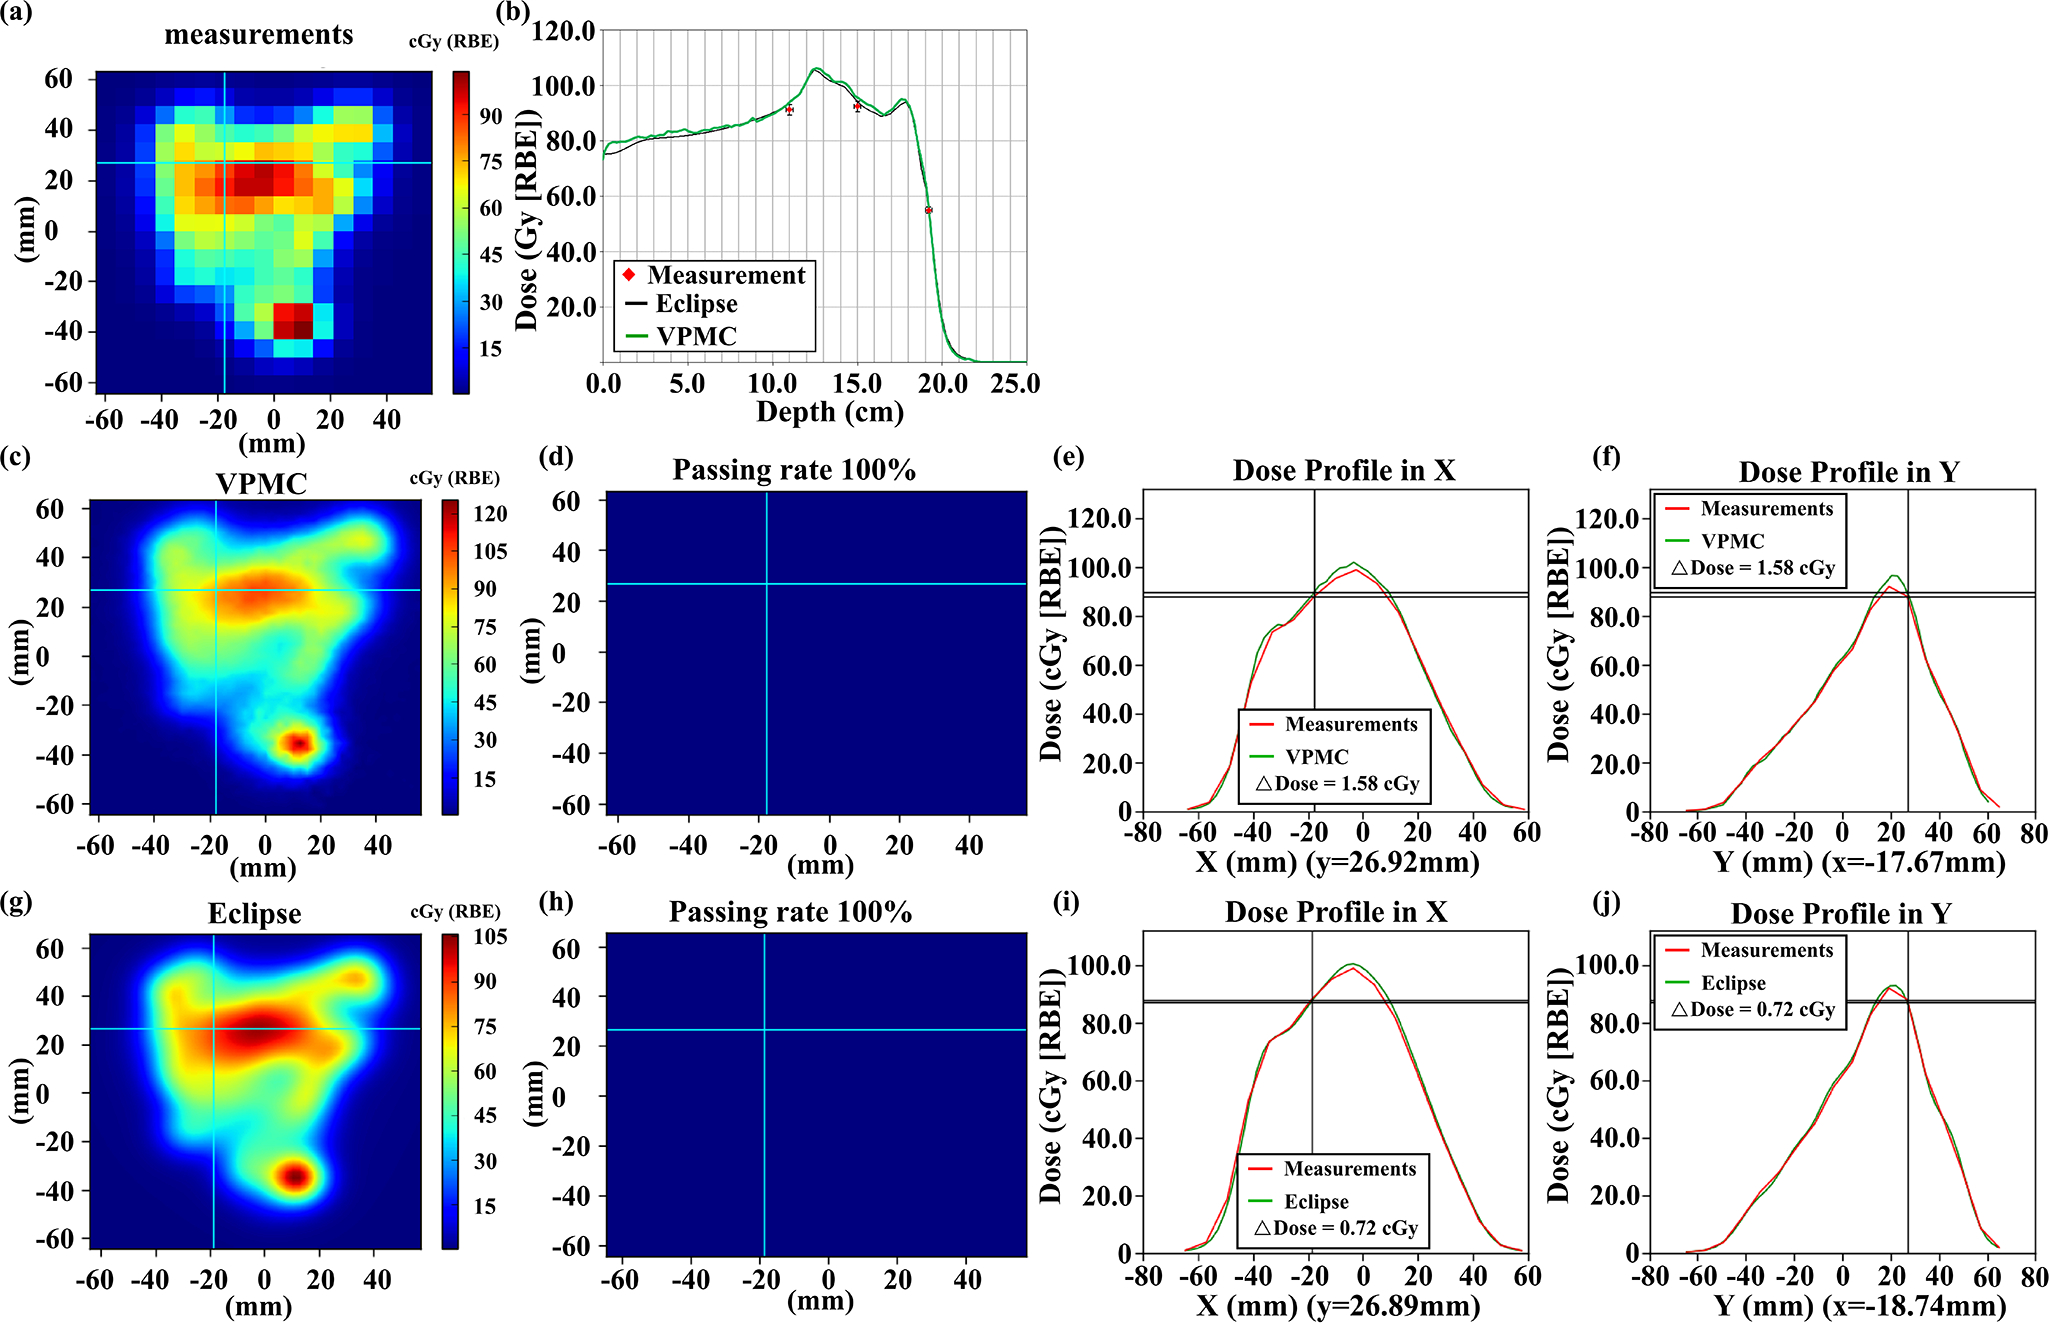
Methods: Neutrons and gamma rays were ignored as escaping from the human body; doses of electrons, heavy ions, and nuclear fragments were locally deposited; the tracks of deuterons were converted into tracks of protons. These particles, together with primary and secondary protons, are considered to be the realistic particles. Histories of primary and secondary protons were replaced by histories of multiple VPs. Each VP corresponded to one proton (either primary or secondary). A continuous-slowing-down-approximation model, an ionization model, and a large angle scattering event model corresponding to nuclear interactions were developed for VPs by generating probability distribution functions (PDFs) based on simulation results of realistic particles using MCsquare. For efficient calculations, these PDFs were stored in the Compute Unified Device Architecture textures. VPMC was benchmarked with TOPAS and MCsquare in phantoms and with MCsquare in 13 representative patient geometries. Comparisons between the VPMC calculated dose and dose measured in water during patient-specific quality assurance (PSQA) of the selected 13 patients were also carried out. Gamma analysis was used to compare the doses derived from different methods and calculation efficiencies were also compared.
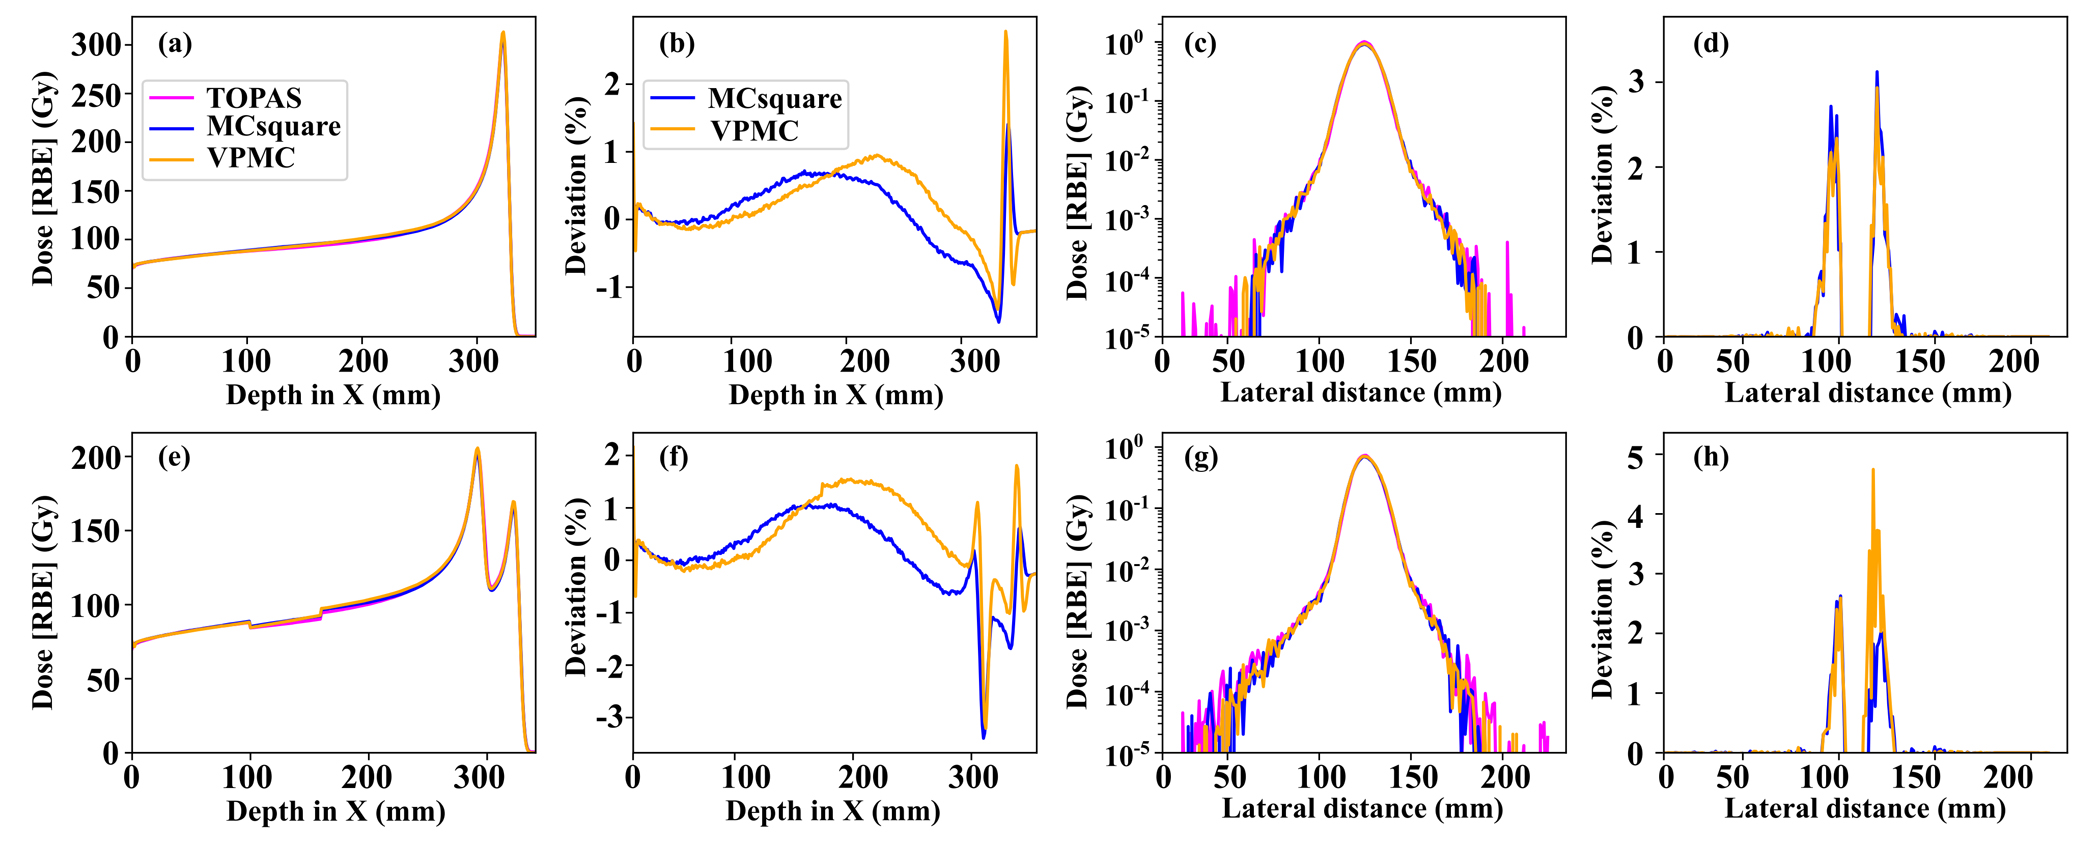
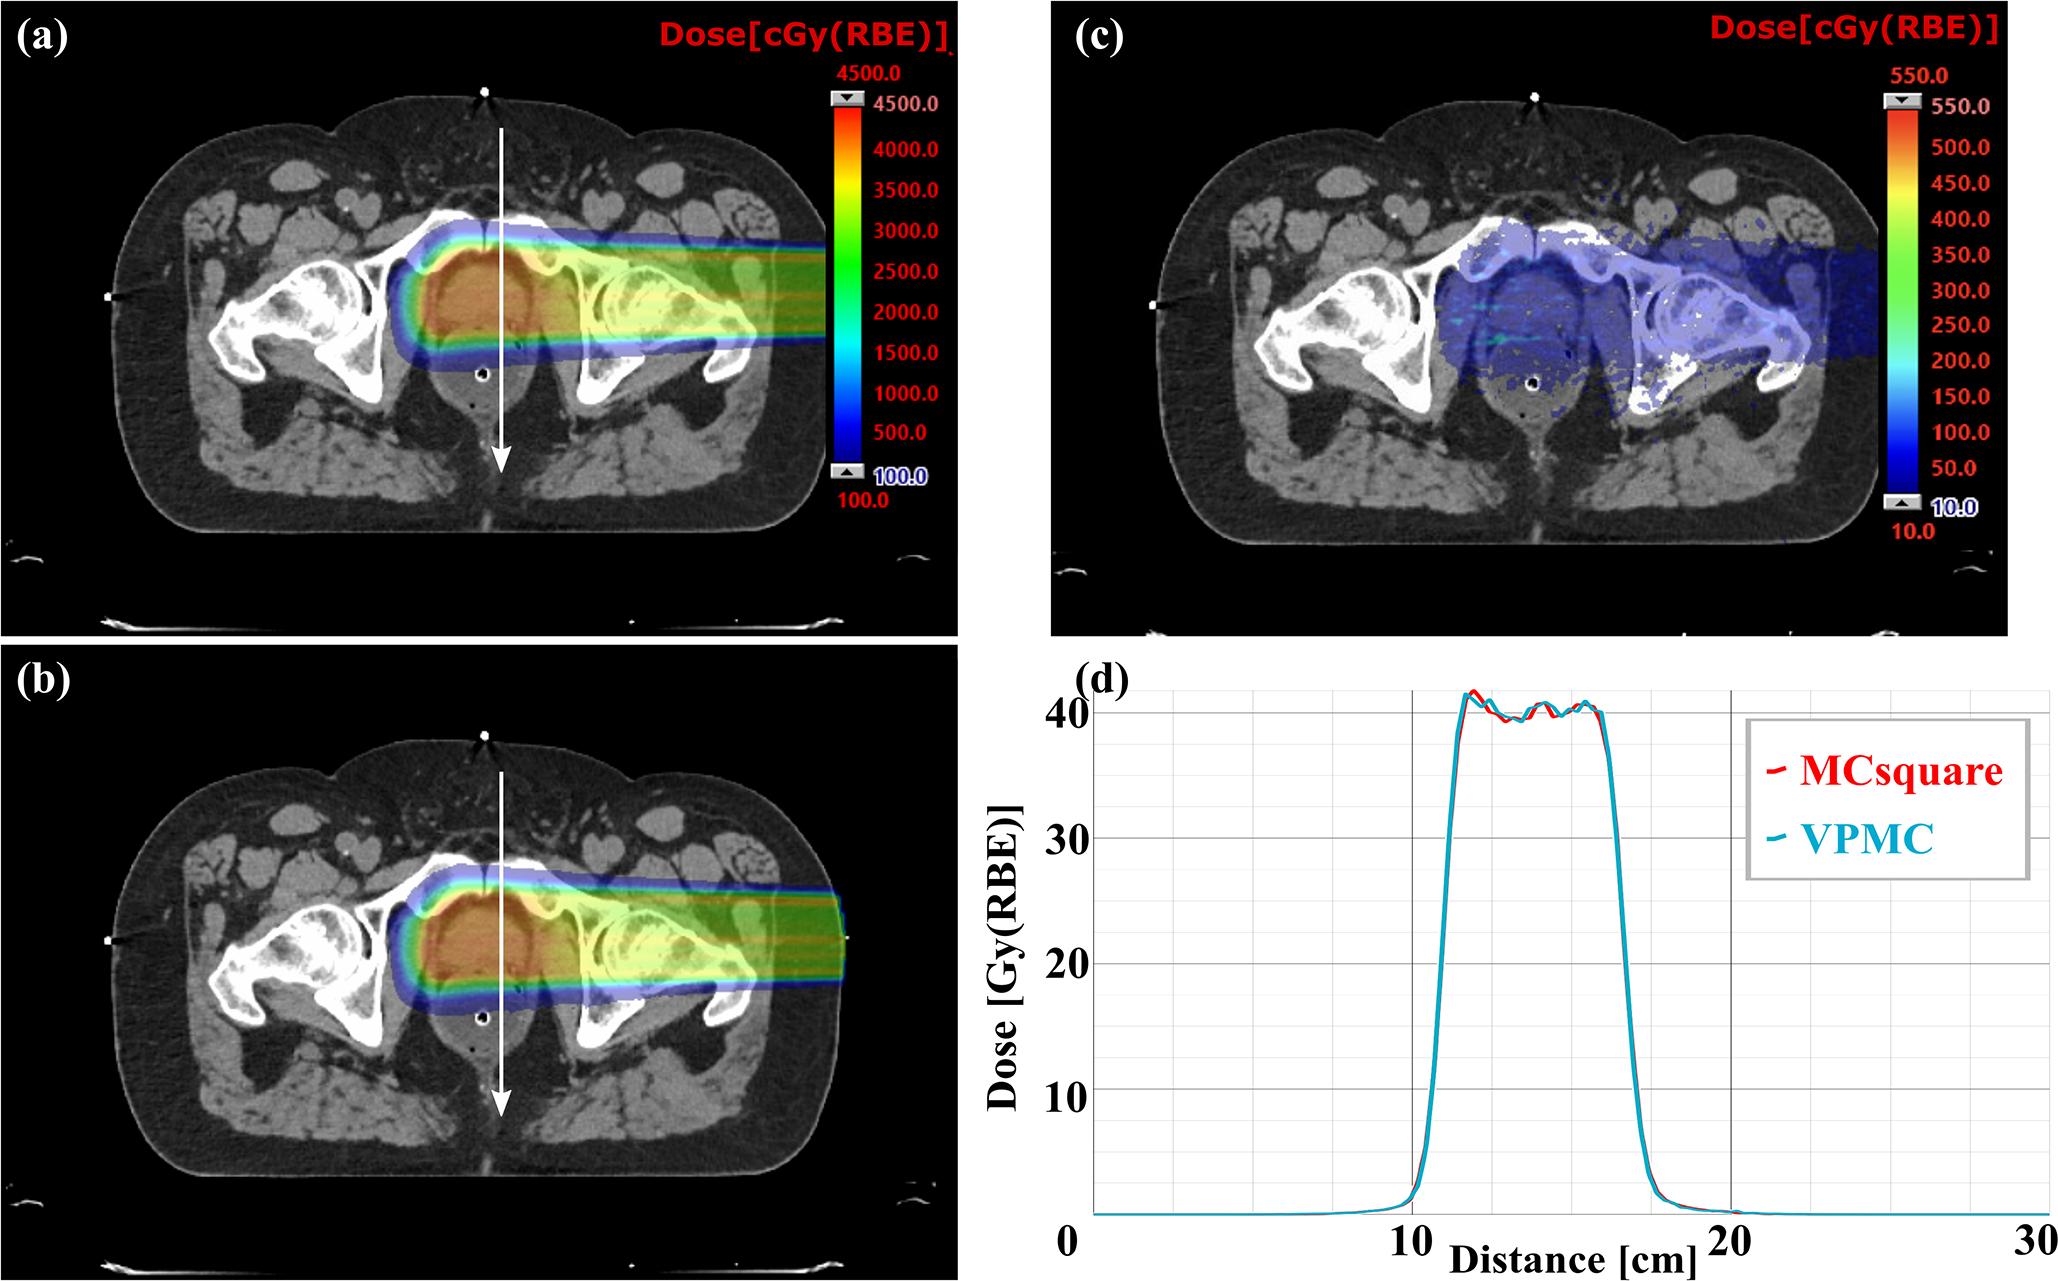
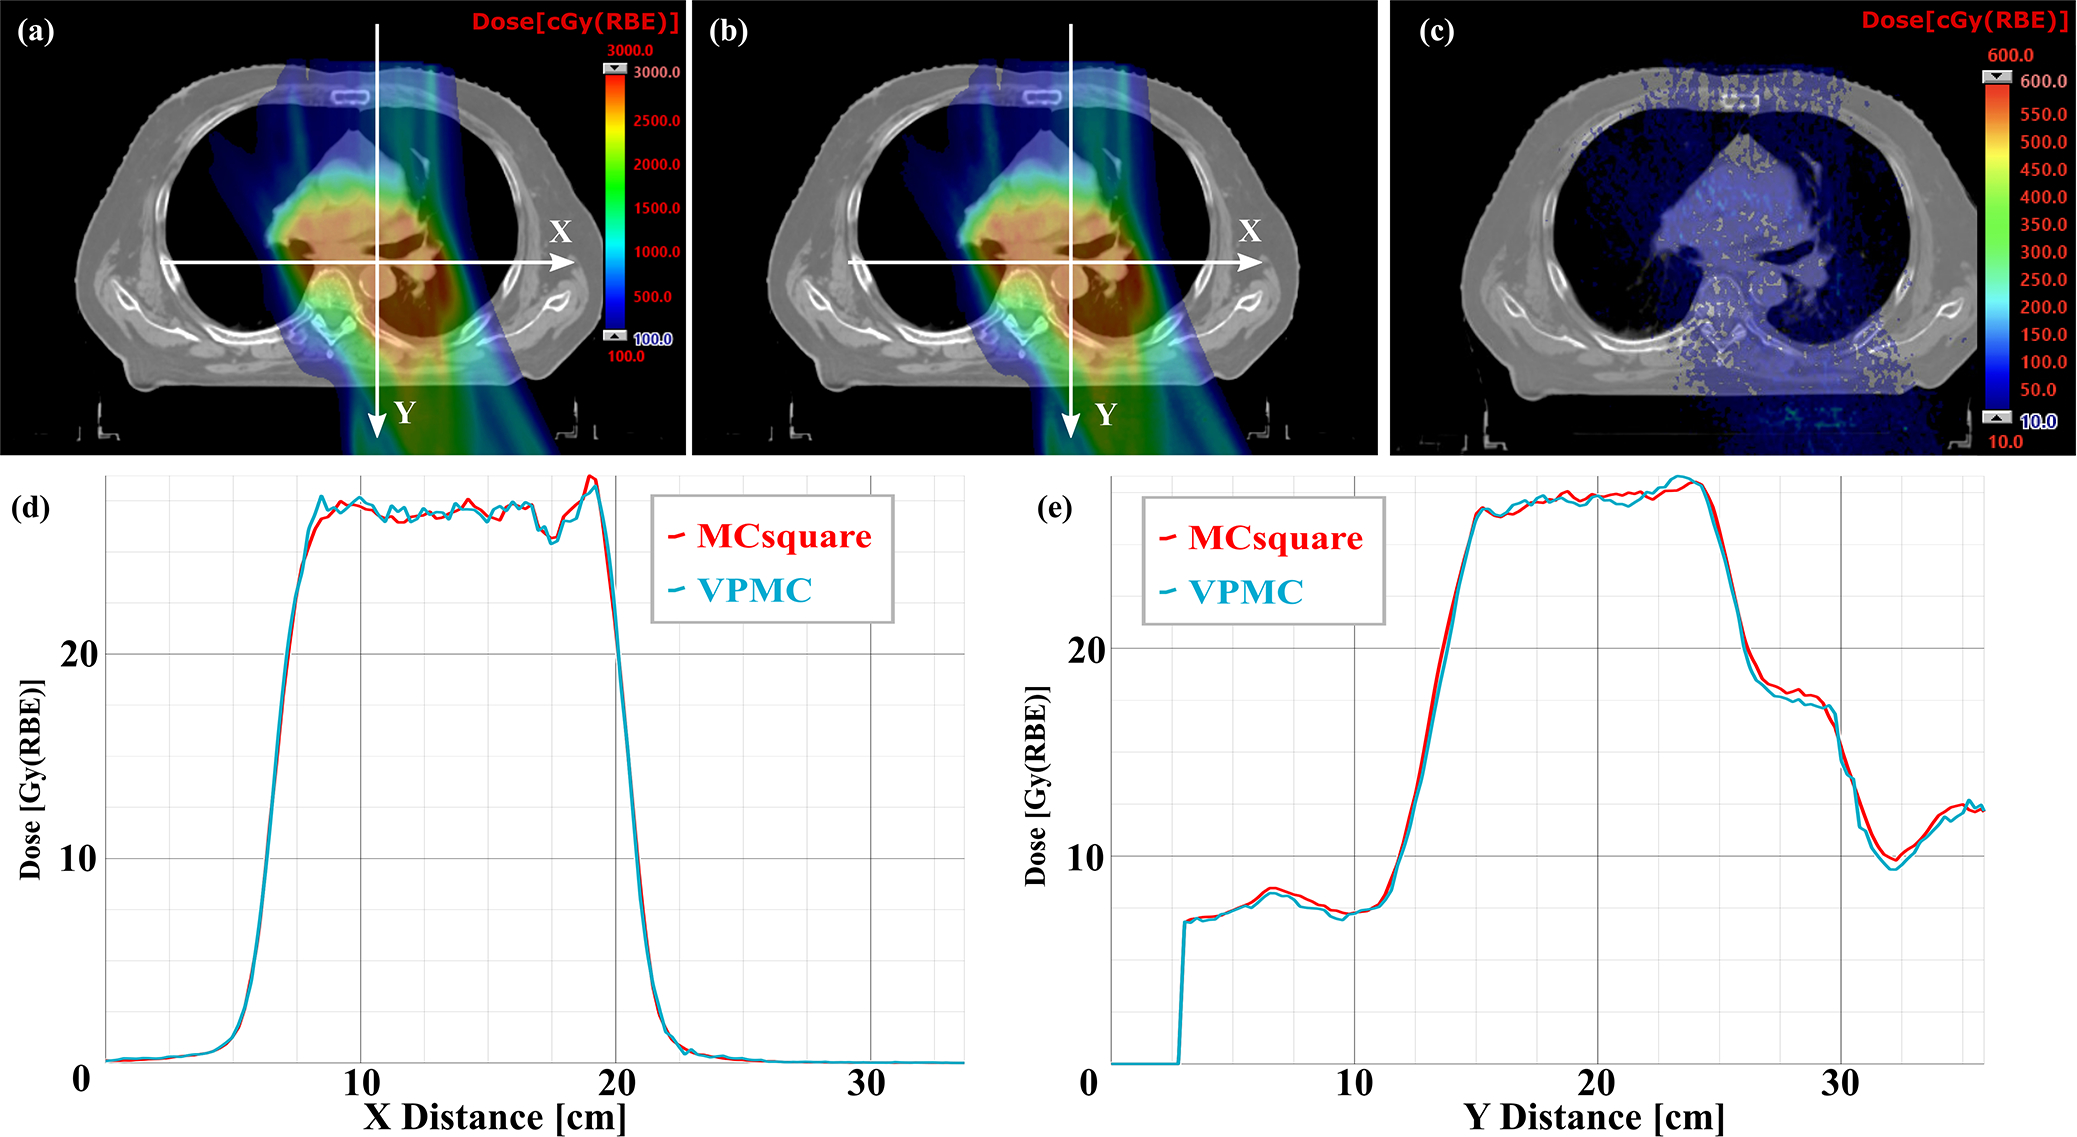
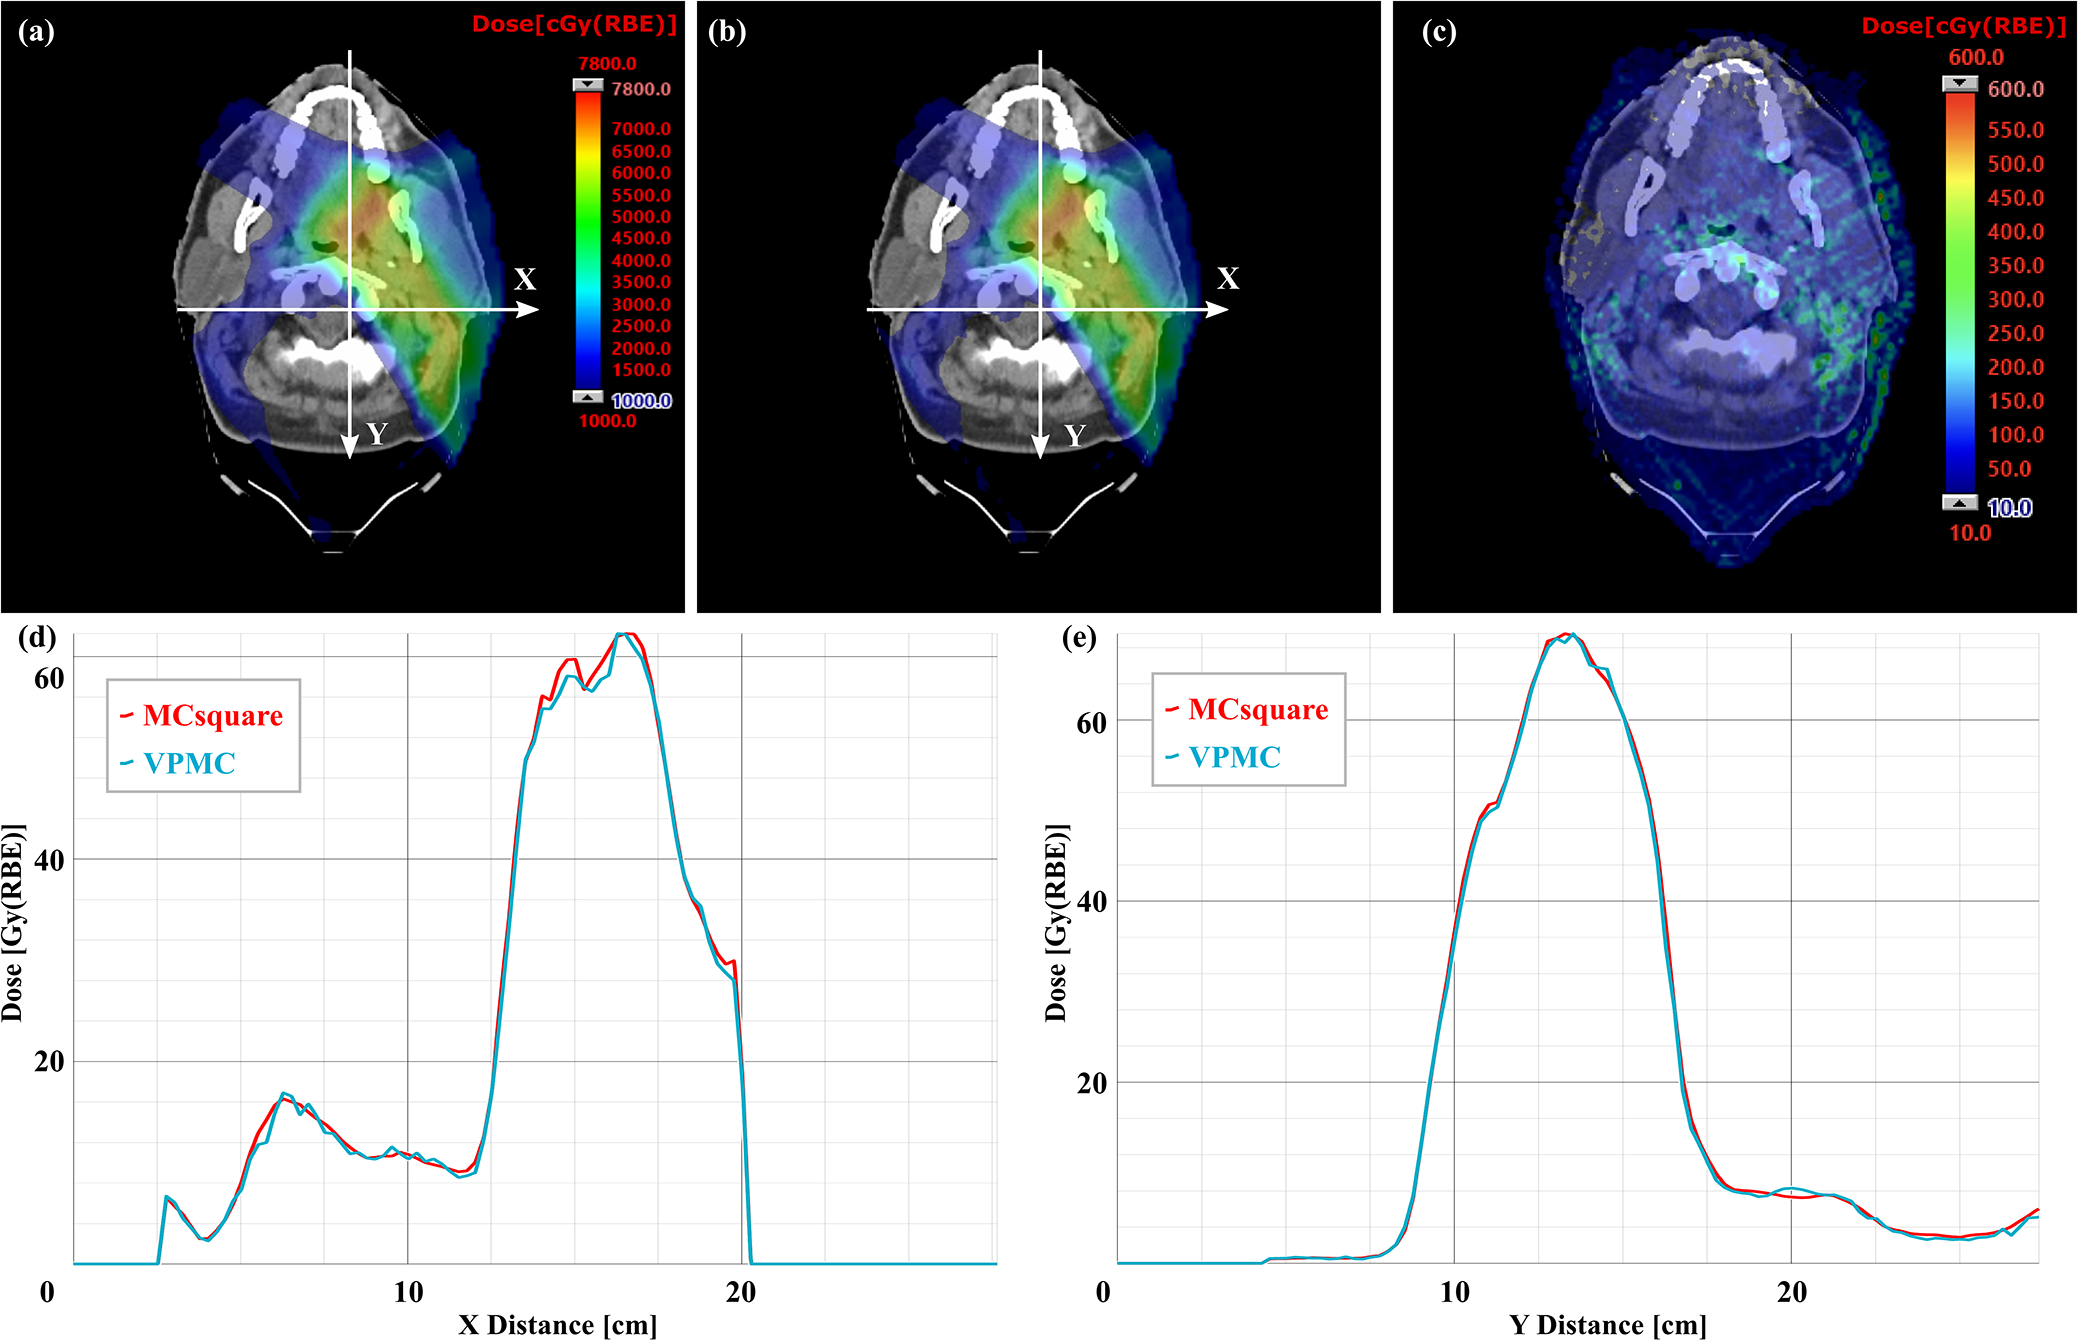
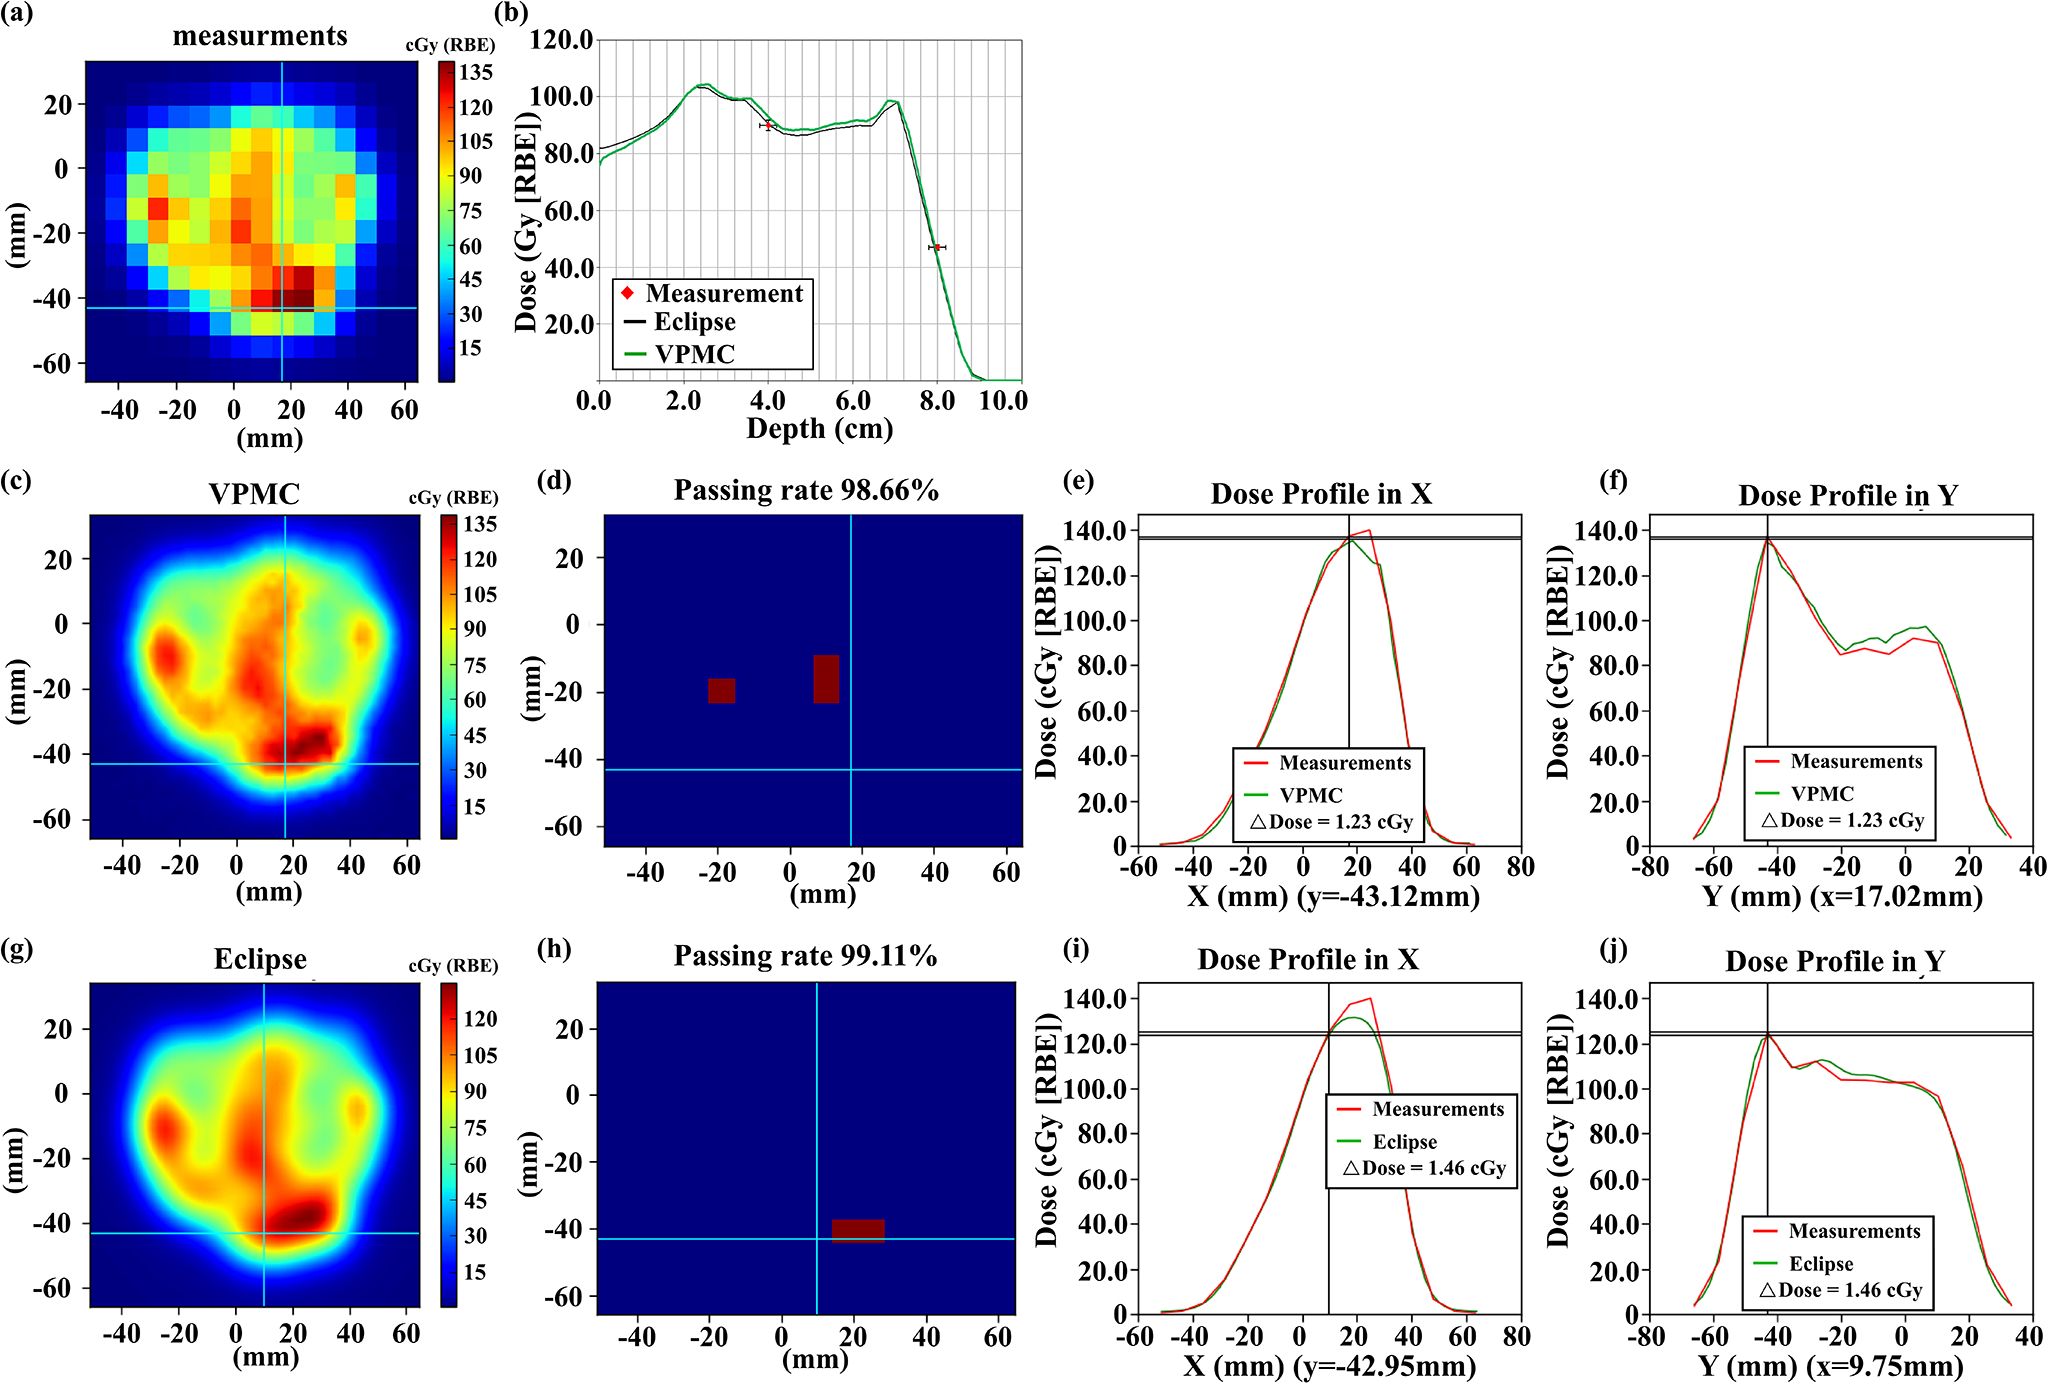
Results: Integrated depth dose and lateral dose profiles in both homogeneous and inhomogeneous phantoms all matched well among VPMC, TOPAS, and MCsquare calculations. The 3D-3D gamma passing rates with a criterion of 2%/2 mm and a threshold of 10% was 98.49% between MCsquare and TOPAS and 98.31% between VPMC and TOPAS in homogeneous phantoms, and 99.18% between MCsquare and TOPAS and 98.49% between VPMC and TOPAS in inhomogeneous phantoms, respectively. In patient geometries, the 3D-3D gamma passing rates with 2%/2 mm/10% between dose distributions from VPMC and MCsquare were 98.56 ± 1.09% in patient geometries. The 2D-3D gamma analysis with 3%/2 mm/10% between the VPMC calculated dose distributions and the 2D measured planar dose distributions during PSQA was 98.91 ± 0.88%. VPMC calculation was highly efficient and took 2.84 ± 2.44 s to finish for the selected 13 patients running on four NVIDIA Ampere GPUs in patient geometries.
Conclusion: VPMC was found to achieve high accuracy and efficiency in proton therapy dose calculation.
Keywords: GPU acceleration; Monte Carlo; intensity-modulated proton therapy; real-time adaptive treatment planning; secondary particles.
© 2022 American Association of Physicists in Medicine.
Conflict of interest statement
Conflicts of Interest Notification
The authors have no conflicts to disclose.
Figures
Similar articles
-
Modelling small block aperture in an in-house developed GPU-accelerated Monte Carlo-based dose engine for pencil beam scanning proton therapy.Phys Med Biol. 2024 Jan 17;69(3):10.1088/1361-6560/ad0b64. doi: 10.1088/1361-6560/ad0b64. Phys Med Biol. 2024. PMID: 37944480 Free PMC article.
-
Modelling small block aperture in an in-house developed GPU-accelerated Monte Carlo-based dose engine for pencil beam scanning proton therapy.ArXiv [Preprint]. 2023 Jul 4:arXiv:2307.01416v1. ArXiv. 2023. Update in: Phys Med Biol. 2024 Jan 17;69(3). doi: 10.1088/1361-6560/ad0b64. PMID: 37461414 Free PMC article. Updated. Preprint.
-
Technical Note: Integrating an open source Monte Carlo code "MCsquare" for clinical use in intensity-modulated proton therapy.Med Phys. 2020 Jun;47(6):2558-2574. doi: 10.1002/mp.14125. Epub 2020 Apr 13. Med Phys. 2020. PMID: 32153029
-
The role of Monte Carlo simulation in understanding the performance of proton computed tomography.Z Med Phys. 2022 Feb;32(1):23-38. doi: 10.1016/j.zemedi.2020.06.006. Epub 2020 Aug 11. Z Med Phys. 2022. PMID: 32798033 Free PMC article. Review.
-
Range Verification Methods in Particle Therapy: Underlying Physics and Monte Carlo Modeling.Front Oncol. 2015 Jul 7;5:150. doi: 10.3389/fonc.2015.00150. eCollection 2015. Front Oncol. 2015. PMID: 26217586 Free PMC article. Review.
Cited by
-
Collimating individual beamlets in pencil beam scanning proton therapy, a dosimetric investigation.Front Oncol. 2022 Nov 11;12:1031340. doi: 10.3389/fonc.2022.1031340. eCollection 2022. Front Oncol. 2022. PMID: 36439436 Free PMC article.
-
Artificial general intelligence for radiation oncology.Meta Radiol. 2023 Nov;1(3):100045. doi: 10.1016/j.metrad.2023.100045. Epub 2023 Nov 24. Meta Radiol. 2023. PMID: 38344271 Free PMC article.
-
A GPU-based fast Monte Carlo code that supports proton transport in magnetic field for radiation therapy.J Appl Clin Med Phys. 2024 Jan;25(1):e14208. doi: 10.1002/acm2.14208. Epub 2023 Nov 21. J Appl Clin Med Phys. 2024. PMID: 37987549 Free PMC article.
-
A Python package for fast GPU-based proton pencil beam dose calculation.J Appl Clin Med Phys. 2025 Jun;26(6):e70093. doi: 10.1002/acm2.70093. Epub 2025 Apr 9. J Appl Clin Med Phys. 2025. PMID: 40205634 Free PMC article.
-
Advanced External Beam Stereotactic Radiotherapy for Skull Base Reirradiation.Cancers (Basel). 2025 Feb 5;17(3):540. doi: 10.3390/cancers17030540. Cancers (Basel). 2025. PMID: 39941906 Free PMC article.
References
-
- van de Water TA, Bijl HP, Schilstra C, Pijls-Johannesma M, Langendijk JA. The potential benefit of radiotherapy with protons in head and neck cancer with respect to normal tissue sparing: a systematic review of literature [published online ahead of print 2011/02/26]. Oncologist. 2011;16(3):366–377. - PMC - PubMed
-
- Lin A, Swisher-McClure S, Millar LB, et al. Proton therapy for head and neck cancer: current applications and future directions. Translational Cancer Research. 2012;1(4):255–263.
-
- Pflugfelder D, Wilkens JJ, Oelfke U. Worst case optimization: a method to account for uncertainties in the optimization of intensity modulated proton therapy [published online ahead of print 2008/03/28]. Phys Med Biol. 2008;53(6):1689–1700. - PubMed
MeSH terms
Substances
Grants and funding
LinkOut - more resources
Full Text Sources
