. 2022 Sep:83:104198.
doi: 10.1016/j.ebiom.2022.104198. Epub 2022 Aug 9.

Plasmodium falciparum sexual conversion rates can be affected by artemisinin-based treatment in naturally infected malaria patients

Affiliations

Plasmodium falciparum sexual conversion rates can be affected by artemisinin-based treatment in naturally infected malaria patients

Harvie P Portugaliza et al. EBioMedicine. 2022 Sep.

Abstract

Background: Artemisinins (ART) are the key component of the frontline antimalarial treatment, but their impact on Plasmodium falciparum sexual conversion rates in natural malaria infections remains unknown. This is an important knowledge gap because sexual conversion rates determine the relative parasite investment between maintaining infection in the same human host and transmission to mosquitoes.

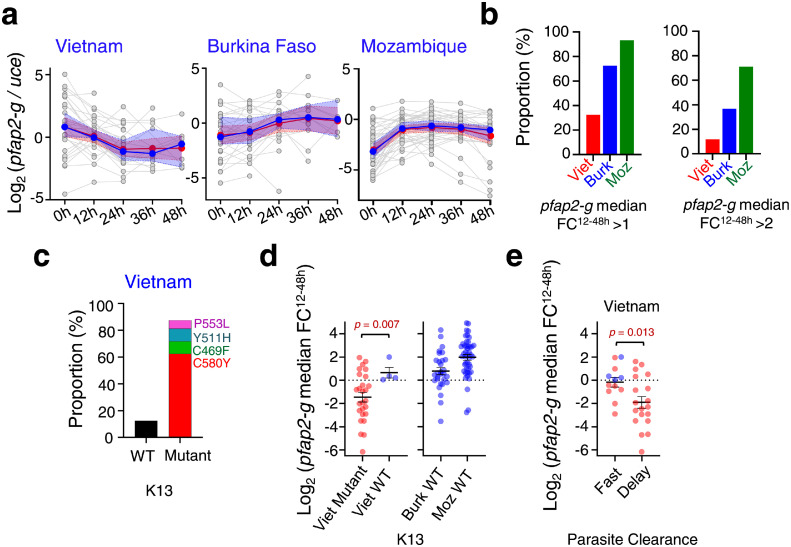
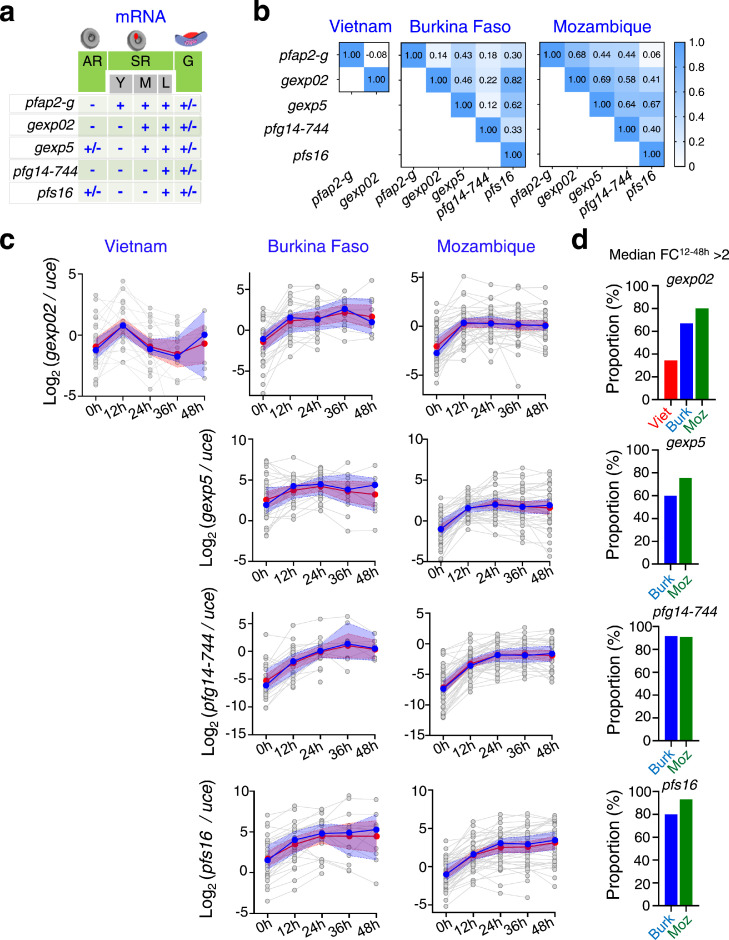
Methods: The primary outcome of this study was to assess the impact of ART-based treatment on sexual conversion rates by comparing the relative transcript levels of pfap2-g and other sexual ring biomarkers (SRBs) before and after treatment. We analysed samples from previously existing cohorts in Vietnam, Burkina Faso and Mozambique (in total, n=109) collected before treatment and at 12 h intervals after treatment. As a secondary objective, we investigated factors that may influence the effect of treatment on sexual conversion rates.

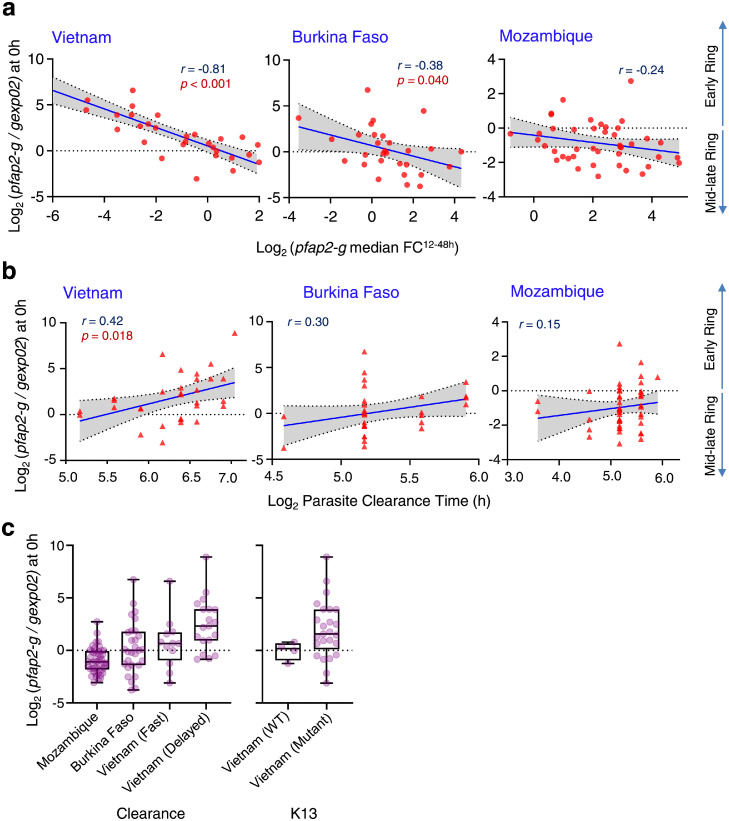
Findings: In the majority of infections from the African cohorts, but not from Vietnam, we observed increased expression of pfap2-g and other SRBs after treatment. Estimated parasite age at the time of treatment was negatively correlated with the increase in pfap2-g transcript levels, suggesting that younger parasites are less susceptible to stimulation of sexual conversion.

Interpretation: We observed enhanced expression of SRBs after ART-based treatment in many patients, which suggests that in natural malaria infections sexual conversion rates can be altered by treatment. ART-based treatment reduces the potential of a treated individual to transmit the disease, but we hypothesise that under some circumstances this reduction may be attenuated by ART-enhanced sexual conversion.

Funding: Spanish Agencia Estatal de Investigación (AEI), European Regional Development Fund (ERDF, European Union), Belgium Development Cooperation (DGD), Canadian University Health Network (UHN), TransGlobalHealth-Erasmus Mundus (European Union).

Keywords: Artemisinin; Malaria transmission; Plasmodium falciparum; Sexual conversion; pfap2-g.


Conflict of interest statement

Declaration of interests The authors declare no competing interests.

Figures

Figure 1
Figure 1
Study design of the three cohorts. Red lines indicate the time of blood sample collection for RNA analysis. Blue and violet arrows indicate the time of treatment with dihydroartemisinin-piperaquine (DHA-PPQ), artesunate (AS) or artemether-lumefantrine (AL). Administration was by oral route except for AS in Mozambique. In Mozambique, parenteral AS was administered every 12 h until patients tolerated oral administration, at which time a complete AL regimen was given. While most patients received AS at 0, 12 and 24 h, some patients received more than 5 doses before AL treatment.
Figure 2
Figure 2
Changes in pfap2-g transcript levels after artemisinin-based treatment. (a) Time-course analysis of pfap2-g relative transcript levels before (0 h) and after treatment (12-48 h). Transcript levels were normalised against uce. The average (red) and median (blue) of all samples, with 95% confidence intervals (CI) (shaded areas), are shown. Individual values are represented as grey dots. (b) Proportion (%) of patients with pfap2-g median fold-change (relative to before treatment levels) between 12-48 h (median FC12-48h) >1 or >2. (c) Proportion (%) of isolates from Vietnam with wild-type (WT) and mutant K13 alleles. The coloured bar indicates the proportion of different K13 mutations. (d) Comparison of the pfap2-g median FC12-48h between K13 mutant and WT isolates from the Vietnam, Burkina Faso and Mozambique cohorts. Blue dots indicate K13 WT isolates, whereas red dots indicate K13 mutants. Mean and s.e.m. are shown. The p value was calculated using Welch's t-test (only for the mutant vs WT comparison; no statistical analysis was performed for comparisons between cohorts because of the disparity in their clinical, demographical and parasitological characteristics). (e) Comparison of the pfap2-g median FC12-48h between patients from the Vietnam cohort with fast or delayed parasite clearance. Blue dots indicate K13 WT isolates, whereas red dots indicate K13 mutants. Mean and s.e.m. are shown. The p value was calculated using Welch's t-test. For panel c, N=33; for all other panels, Vietnam, N=31, of which K13 WT, N=4, K13 mutant, N=26 (K13 data not available for one patient), fast clearance, N=12, delayed clearance, N=19; Burkina Faso, N=29; Mozambique, N=45. The mean and 95% CI for the data presented in panels a, d and e is available in Supplementary Dataset 2.
Figure 3
Figure 3
Comparison of transcript levels after artemisinin-based treatment for different sexual ring biomarkers (SRBs). (a) Expression of SRBs at parasite stages found in the circulation, based on published studies.,,, Stages: asexual rings (AR); sexual rings (SR), which can be young sexual rings (Y), e.g., 0-5 hours post-invasion (hpi); mid sexual rings (M), e.g., 10-15 hpi; or late sexual rings (L), e.g., 20-25 hpi; and mature gametocytes (G). (b) Linear correlation between the median FC12-48h for different SRBs (using uce-normalised transcript levels). Pearson correlation coefficients (r) are shown. (c) Time-course analysis of SRBs relative transcript levels (normalised against uce) before (0 h) and after treatment (12-48 h). The average (red) and median (blue) of all samples, with 95% confidence intervals (CI) (shaded areas), are shown. Individual values are represented as grey dots. (d) Proportion (%) of patients with a > 2 value for the gexp02, gexp5, pfg14-744, and pfs16 median FC12-48h. In panels b-d, data for gexp5, pfg14-744 and pfs16 was excluded from the Vietnam cohort analysis because many values were missing. For the number of samples included in the analysis of each gene in each cohort, please see Methods and Supplementary Data Set 2. The mean and 95% CI for the data presented in panel c is available in Supplementary Dataset 2.
Figure 4
Figure 4
Association of estimated rings age before treatment with pfap2-g fold-change after treatment and parasite clearance time. Rings age before treatment (in arbitrary units) was estimated from the ratio of pfap2-g to gexp02 transcript levels (log2-transformed). Higher values of this ratio indicate younger rings. (a-b) Association between estimated rings age before treatment (0 h) and the pfap2-g median fold-change between 12 and 48 h after treatment (log2-transformed) (a) or with parasite clearance time (b). The blue line represents the linear prediction with 95% confidence interval (CI, grey shaded area), calculated from linear regression analysis, with Pearson correlation coefficient (r) and p value. Only p values < 0.05 are shown. Individual values are represented as red dots. (c) Estimated relative rings age before treatment in the different cohorts, with samples from Vietnam divided in delayed or non-delayed (fast) parasite clearance (left panel) and in K13 wild-type (WT) or mutant isolates (right panel). Boxes show median and quartiles, and whiskers the range. The mean and 95% CI for the data presented in panel c is available in Supplementary Dataset 2.
Figure 5
Figure 5
Association of pfap2-g expression changes after treatment with mature gametocyte carriage 1 to 2 weeks later. (a) Temporal dynamics of the mature female gametocyte marker pfs25 transcript levels. The average (red) and median (blue) of all samples, with 95% confidence intervals (CI) (shaded area), are shown. Individual values are represented as grey dots. (b) Proportion (%) of infections carrying gametocytes (pfs25-positive) before treatment (0 h) and 1-2 weeks after treatment. (c)pfap2-g median fold-change between 12 and 48 h after treatment (pfap2-g median FC12-48h) in patients with detected (Yes) or undetected (No) pfs25 transcripts on days 7-10. Transcript levels were normalised against uce. Mean, s.e.m. and individual data points are shown. The p value was calculated using the Welsch's t-test. Only p values < 0.05 are shown. (d) Spearman correlation coefficient (rs) of pfap2-g median FC12-48h with pfs25 transcripts/µl on day 7 to 10, with 95% CI and p value. Only p values < 0.05 are shown. (e)pfs25 transcript levels in patients with pfap2-g median FC12-48h > 1 or ≤1. Bars show the mean, with 95% CI. The mean and 95% CI for the data presented in panels a, c and e is available in Supplementary Dataset 2.

References

    1. WHO . World Health Organization; 2021. World malaria report 2021. ISBN 978-92-4-004049-6.
    1. Josling GA, Williamson KC, Llinas M. Regulation of sexual commitment and gametocytogenesis in malaria parasites. Annu Rev Microbiol. 2018;72:501–519. - PMC - PubMed
    1. Ngotho P, Soares AB, Hentzschel F, Achcar F, Bertuccini L, Marti M. Revisiting gametocyte biology in malaria parasites. FEMS Microbiol Rev. 2019;43(4):401–414. - PMC - PubMed
    1. Cao P, Collins KA, Zaloumis S, et al. Modeling the dynamics of Plasmodium falciparum gametocytes in humans during malaria infection. Elife. 2019;8:e49058. - PMC - PubMed
    1. Eichner M, Diebner HH, Molineaux L, Collins WE, Jeffery GM, Dietz K. Genesis, sequestration and survival of Plasmodium falciparum gametocytes: parameter estimates from fitting a model to malariatherapy data. Trans R Soc Trop Med Hyg. 2001;95(5):497–501. - PubMed