. 2022 Sep 13;55(9):1732-1746.e5.
doi: 10.1016/j.immuni.2022.07.005. Epub 2022 Jul 19.

Immunodeficiency syndromes differentially impact the functional profile of SARS-CoV-2-specific T cells elicited by mRNA vaccination

Affiliations

Immunodeficiency syndromes differentially impact the functional profile of SARS-CoV-2-specific T cells elicited by mRNA vaccination

Yu Gao et al. Immunity. .

Abstract

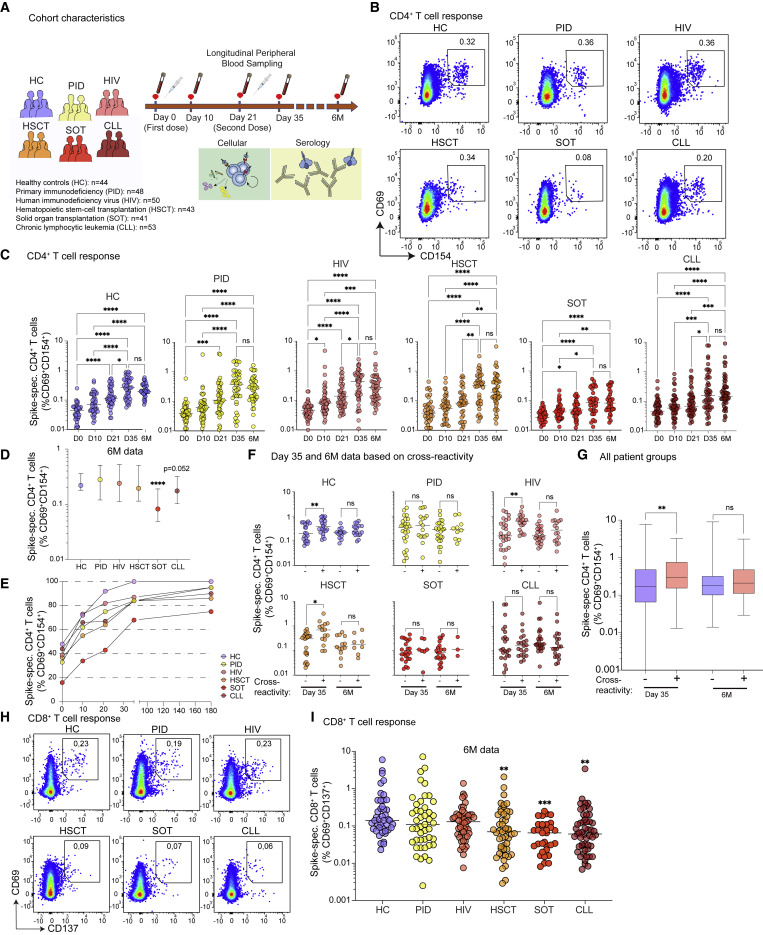
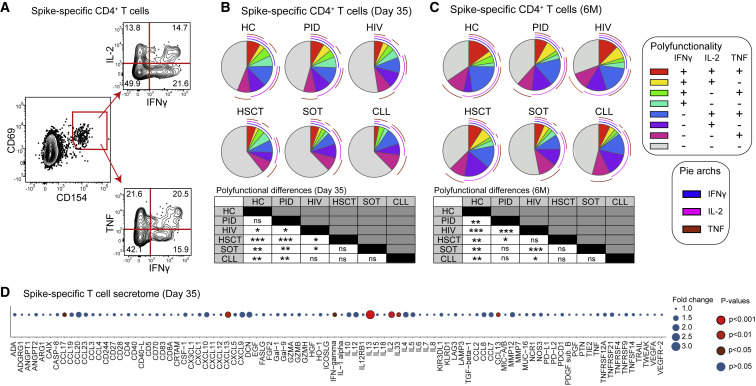
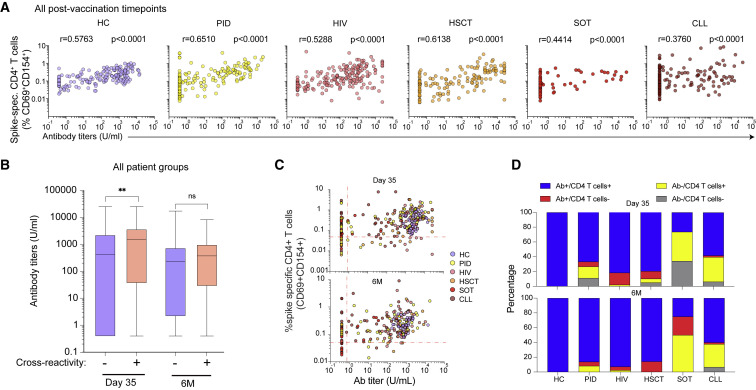
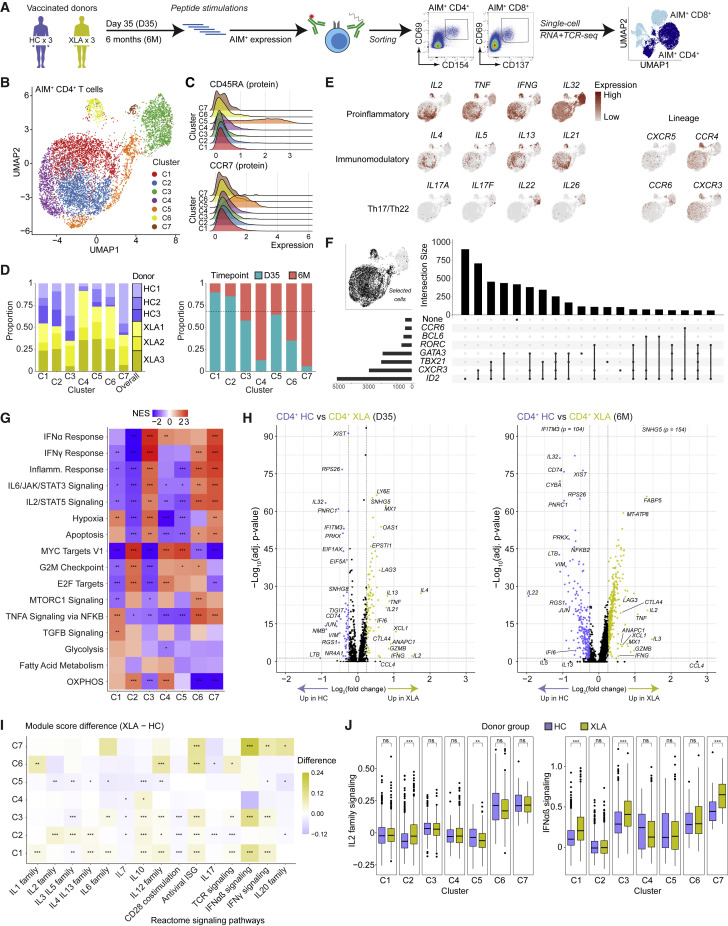
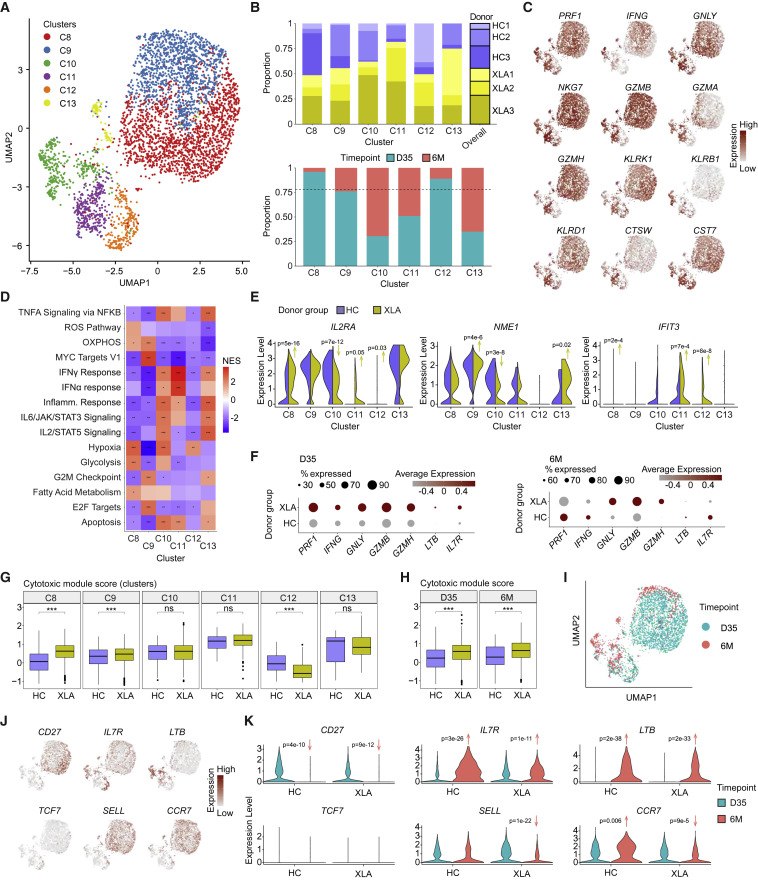
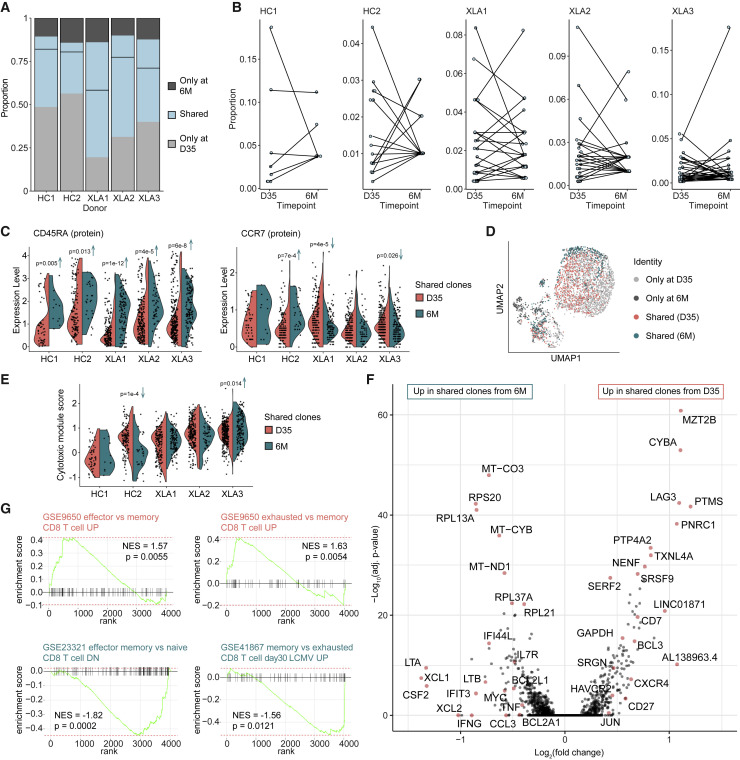
Many immunocompromised patients mount suboptimal humoral immunity after SARS-CoV-2 mRNA vaccination. Here, we assessed the single-cell profile of SARS-CoV-2-specific T cells post-mRNA vaccination in healthy individuals and patients with various forms of immunodeficiencies. Impaired vaccine-induced cell-mediated immunity was observed in many immunocompromised patients, particularly in solid-organ transplant and chronic lymphocytic leukemia patients. Notably, individuals with an inherited lack of mature B cells, i.e., X-linked agammaglobulinemia (XLA) displayed highly functional spike-specific T cell responses. Single-cell RNA-sequencing further revealed that mRNA vaccination induced a broad functional spectrum of spike-specific CD4+ and CD8+ T cells in healthy individuals and patients with XLA. These responses were founded on polyclonal repertoires of CD4+ T cells and robust expansions of oligoclonal effector-memory CD45RA+ CD8+ T cells with stem-like characteristics. Collectively, our data provide the functional continuum of SARS-CoV-2-specific T cell responses post-mRNA vaccination, highlighting that cell-mediated immunity is of variable functional quality across immunodeficiency syndromes.

Keywords: COVID-19; SARS-CoV-2; T cells; mRNA vaccine.


Conflict of interest statement

Declaration of interests M.B. is a consultant for Oxford Immunotec. A.S. is a consultant for Gritstone, Flow Pharma, Arcturus, Immunoscape, CellCarta, Oxford Immunotech, and Avalia. A.S. has filed for patent protection for various aspects of T cell epitope and vaccine design work.

Figures

Figure 1
Figure 1
Longitudinal T cell responses after SARS-CoV-2 mRNA vaccination in healthy controls and immunocompromised patients (A) Schematic of the longitudinal study design, involving six cohorts of healthy and immunocompromised patient groups across five time points. (B and C) (B) Representative flow plots at day 35 (n = 279 independent experiments) showing CD69 and CD154 expression after spike-peptide pool stimulation on memory CD4+ T cells (above), and (C) plots of their frequencies over time (below). (D) Spike-specific CD4+ T cell frequencies at 6 months. (E) Spike-specific CD4+ T cell frequencies across all time points. (F) Spike-specific CD4+ T cell frequencies at ay 35 and 6 months based on the presence or absence of pre-existing day 0 responses. (G) Spike-specific CD4+ T cell frequencies at day 35 and 6 months based on the presence or absence of pre-existing day 0 responses with data combined from all individuals. (H) Representative flow plots at 6 months (n = 279 independent experiments) showing CD69 and CD137 expression after spike-peptide pool stimulation of memory CD8+ T cells. (I) Spike-specific (CD69+CD137+) CD8+ T cell frequencies at 6 months. Graphs show median ± interquartile range (IQR) (D and G) or median values (C, F, and I). (C, D, and I) Kruskal-Wallis test with Dunn’s post-test. (F and G) Mann-Whitney test. p< 0.05, ∗∗ p< 0.01, ∗∗∗ p< 0.001, ns, not significant. See also Figures S1 and S2.
Figure 2
Figure 2
Functional profile of spike-specific T cells (A) Representative flow gating strategy (n = 279 independent experiments) for IFN-γ, IL-2, and TNF expression within the spike-specific CD4+ T cell population. (B) Comparison of the co-expression pattern for IFN-γ, IL-2, and TNF molecules at day 35. (C) Comparison of the co-expression pattern for IFN-γ, IL-2, and TNF molecules at 6 months. (D) Bubble plot of the fold change over unstimulated background for secreted proteins after spike-peptide pool stimulation of PBMCs from day 35. Graphs show median values (B–D). (B and C) Permutation test. (D) Mann-Whitney test between stimulated and unstimulated conditions. p < 0.05, ∗∗p < 0.01, ∗∗∗p < 0.001, ns, not significant. See also Figure S3.
Figure 3
Figure 3
Relationship between spike-specific antibody and CD4+ T cell responses after mRNA vaccination (A) Correlative analysis of spike-specific antibody and CD4+ T cell responses combined from all post-vaccination time points (days 10, 21, and 35 and 6 months). (B) Distribution of spike-specific antibody titers based on the presence or absence of pre-existing (day 0) CD4+ T cell responses. (C) Scatter plot of spike-specific antibody titers and CD4+ T cell response frequencies at day 35. Dashed lines represent the limit of detectable responses (antibody threshold = 0.8 U/mL, CD4+ threshold = 0.05%, after background subtraction). (D) The proportion of individuals with detectable antibody and/or spike-specific CD4+ T cell responses at day 35 and 6 months. Graphs show median ± IQR (B). (A) Spearman correlation. (B) Mann-Whitney test. p < 0.05, ∗∗ p < 0.01, ns = not significant. See also Figure S3.
Figure 4
Figure 4
Single-cell transcriptome landscape of spike-specific CD4+ T cells in HCs and patients with XLA post-mRNA vaccination (A) Schematic workflow for single-cell sequencing of spike-specific T cells. (B) UMAP visualization of CD4+ T cell clusters (C1–C7) identified from HC and XLA patients at the day 35 and 6 months. (C) Ridge plots of CD45RA and CCR7 protein expression across CD4+ T cell clusters. (D) Bar plots of the composition of each cluster according to donor or time point of origin. The dotted line represents the overall distribution of cells between day 35 and 6 months. (E) UMAP visualizations colored by gene expression intensity. (F) UpSet plot of polarizing helper subset marker co-expression. (G) Heatmap of normalized enrichment scores calculated using GSEA for Hallmark gene sets for each cluster. NES, normalized enrichment score. (H) Volcano plot of differentially expressed genes between CD4+ T cells from HC and XLA donors at the day 35 and 6-month time points. Genes with very low p values consisting only of sex-chromosome-linked genes were removed for visualization purposes. (I) Heatmap showing the difference in median module scores between XLA and HC donors across clusters. Curated gene sets were obtained from the Reactome pathway database. (J) Distribution of module scores for signaling pathways from the Reactome pathway database. Graphs show median ± IQR (J). (G) GSEA permutation test. (I and J) Mann-Whitney test. (G, H, I, and J) p < 0.05, ∗∗p < 0.01, ∗∗∗p < 0.001, ns, not significant. See also Figures S4 and S5.
Figure 5
Figure 5
Single-cell analysis reveals the functional spectrum of spike-specific CD8+ T cell responses in HCs and XLA patients (A) UMAP visualization of CD8+ T cell clusters (C8–C13) identified from HC and XLA donors at day 35 and 6 months. Day 35. (B) Bar plots of the composition of each cluster according to donor or time point of origin. The dotted line represents the overall distribution of cells between day 35 and 6 months. (C) UMAP visualizations for expression of a curated cytotoxic gene signature set colored by gene expression intensity. (D) Heatmap of normalized enrichment scores calculated using GSEA for Hallmark gene sets for each cluster. NES, normalized enrichment score. (E) Violin plots of gene expression for markers of activation. (F) Dot plot of gene expression between all CD8+ T cells from HC and XLA donors at day 35 and 6 months. (G) Distribution of module scores for a cytotoxic gene signature across clusters. (H) Distribution of module scores for a cytotoxic gene signature across time points. (I) UMAP visualization for the time point of origin of cells. (J) UMAP visualizations for expression of memory gene signatures colored by gene expression intensity. (K) Violin plots of memory gene signatures split by time point and donor group of origin. Graphs show median ± IQR (G and H). (D) GSEA permutation test. (E, G, H and K) Mann-Whitney test. (D, G, and H) p < 0.05, ∗∗ p < 0.01, ∗∗∗ p < 0.001, ns, not significant. See also Figure S5.
Figure 6
Figure 6
Phenotypic evolution of shared CD8+ T cell clones at 6 months post-vaccination (A) Stacked bar plot of the proportion of the CD8+ T cell repertoire with paired clonotype (CDR3) identity from each donor observed at only one or both time points. The dividing line represents the contribution of clonotypes from each time point for each donor. (B) Dot plot of the frequency of only cells with clonotype identity observed in both time points. Identical clonotypes are connected. (C) Violin plots of the protein expression of CD45RA and CCR7 in cells with clonotype identity observed in both time points. (D) UMAP visualization of the distribution of cells with clonotype identity observed in only two or both time points. (E) Violin plot of the cytotoxic module score in cells with clonotype identity observed in both time points. (F) Volcano plot of differentially expressed cells' genes from day 35 and 6 months with shared clonotypes. (G) GSEA of C7 immunologic signature gene sets using the ranked set of differentially expressed genes between shared clonotypes from day 35 and 6 months. (C, E, and F) Mann-Whitney test. (G) GSEA permutation test. See also Figure S6.

References

    1. Adamo S., Michler J., Zurbuchen Y., Cervia C., Taeschler P., Raeber M.E., Baghai Sain S.B., Nilsson J., Moor A.E., Boyman O. Signature of long-lived memory CD8+ T cells in acute SARS-CoV-2 infection. Nature. 2022;602:148–155. - PMC - PubMed
    1. Apostolidis S.A., Kakara M., Painter M.M., Goel R.R., Mathew D., Lenzi K., Rezk A., Patterson K.R., Espinoza D.A., Kadri J.C., et al. Cellular and humoral immune responses following SARS-CoV-2 mRNA vaccination in patients with multiple sclerosis on anti-CD20 therapy. Nat. Med. 2021;27:1990–2001. - PMC - PubMed
    1. Baden L.R., El Sahly H.M., Essink B., Kotloff K., Frey S., Novak R., Diemert D., Spector S.A., Rouphael N., Creech C.B., et al. Efficacy and safety of the mRNA-1273 SARS-CoV-2 vaccine. N. Engl. J. Med. 2021;384:403–416. - PMC - PubMed
    1. Bange E.M., Han N.A., Wileyto P., Kim J.Y., Gouma S., Robinson J., Greenplate A.R., Hwee M.A., Porterfield F., Owoyemi O., et al. CD8+ T cells contribute to survival in patients with COVID-19 and hematologic cancer. Nat. Med. 2021;27:1280–1289. - PMC - PubMed
    1. Barda N., Dagan N., Cohen C., Hernán M.A., Lipsitch M., Kohane I.S., Reis B.Y., Balicer R.D. Effectiveness of a third dose of the BNT162b2 mRNA COVID-19 vaccine for preventing severe outcomes in Israel: an observational study. Lancet. 2021;398:2093–2100. - PMC - PubMed

Publication types