

Use of c-peptide as a measure of cephalic phase insulin release in humans
- PMID: 35961609
- PMCID: PMC9993810
- DOI: 10.1016/j.physbeh.2022.113940
Use of c-peptide as a measure of cephalic phase insulin release in humans
Abstract
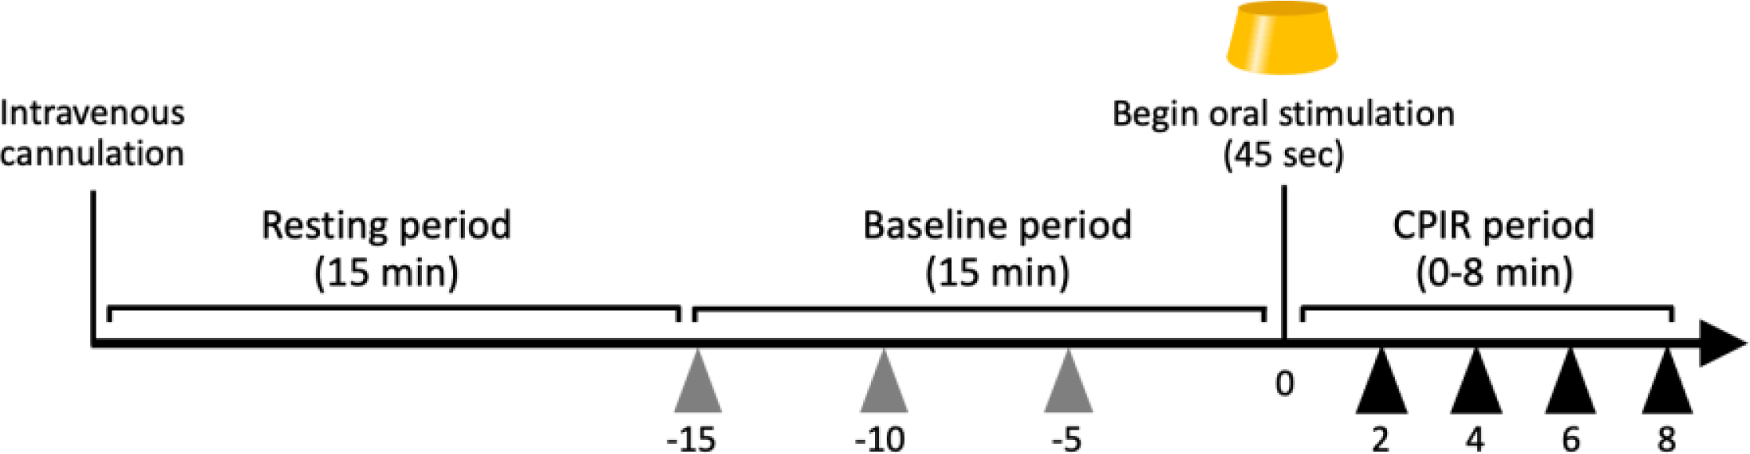
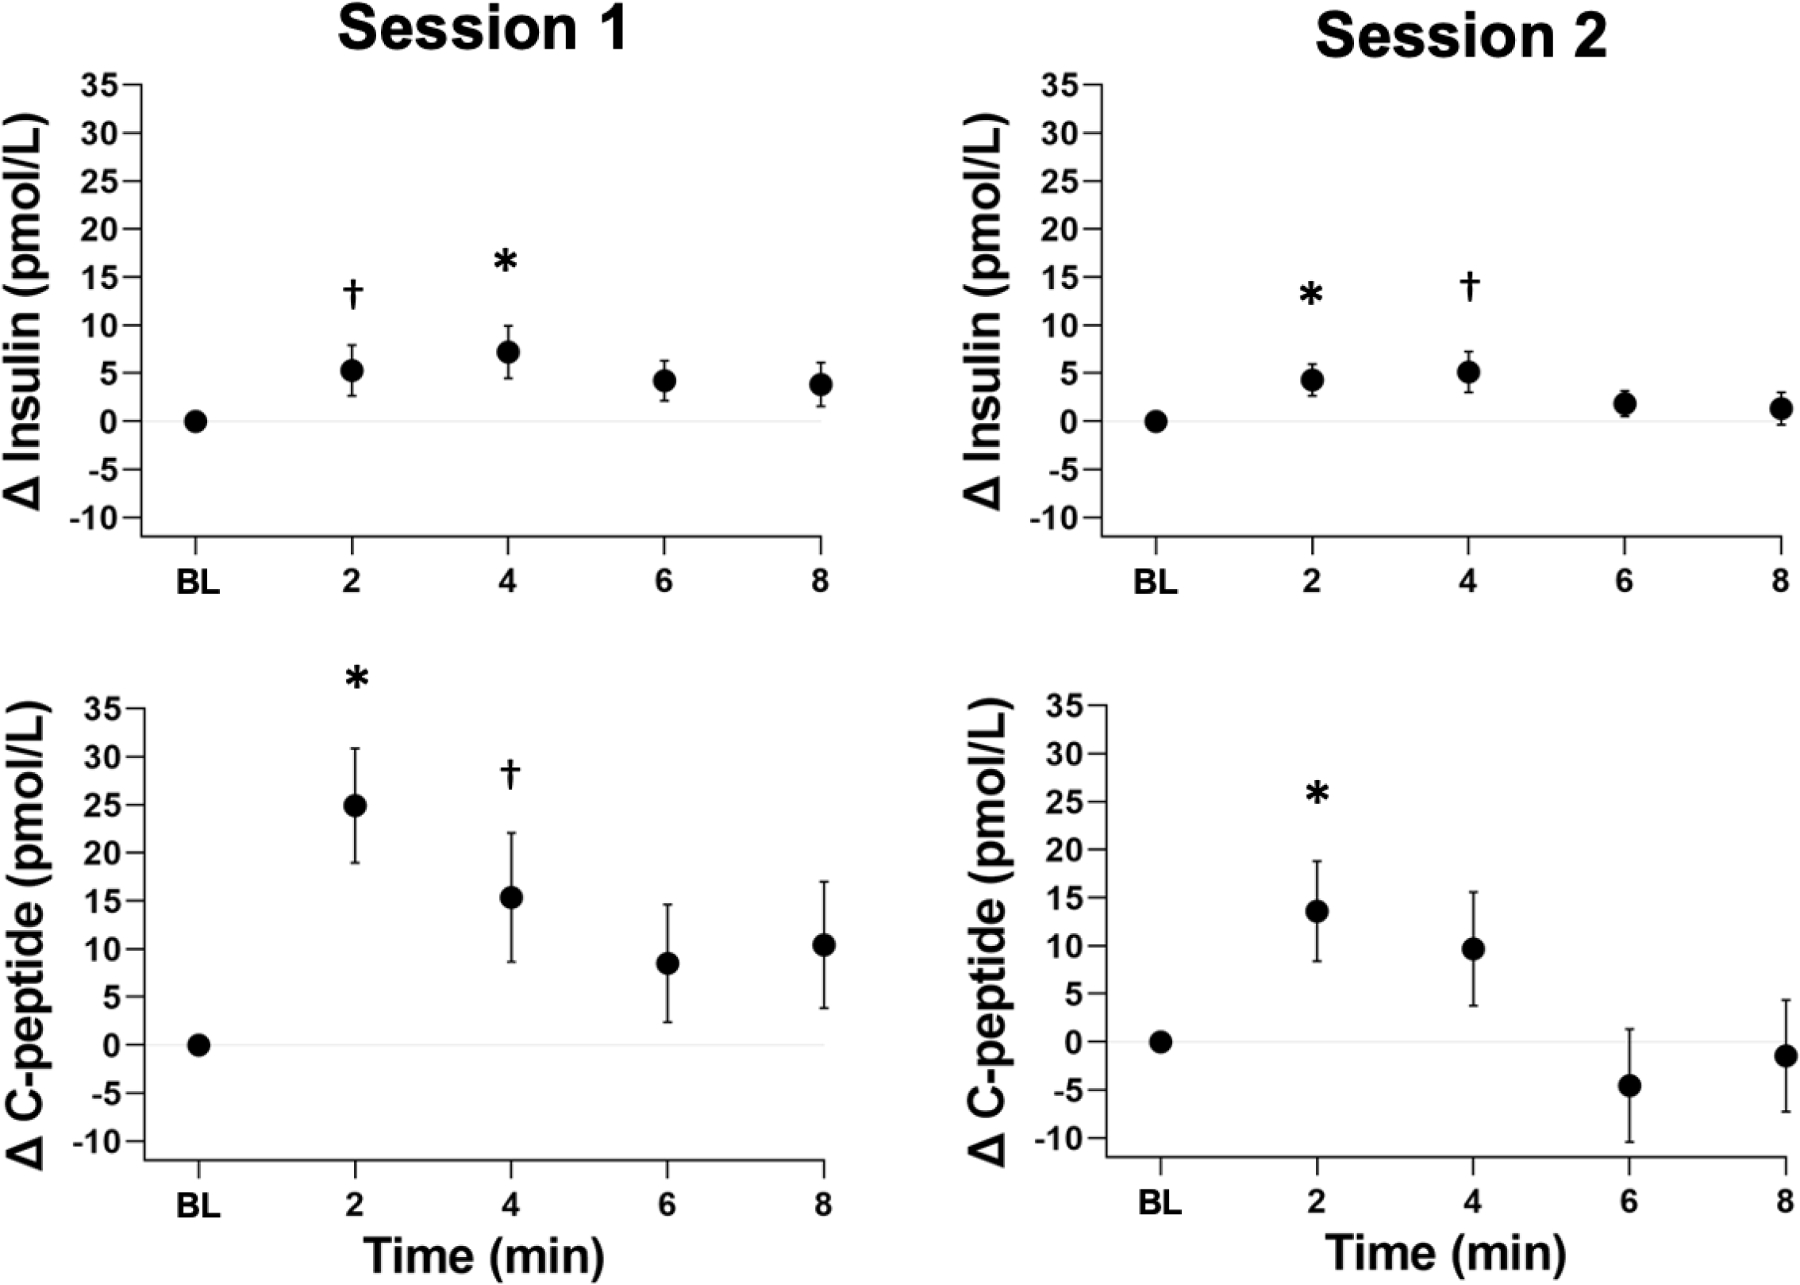
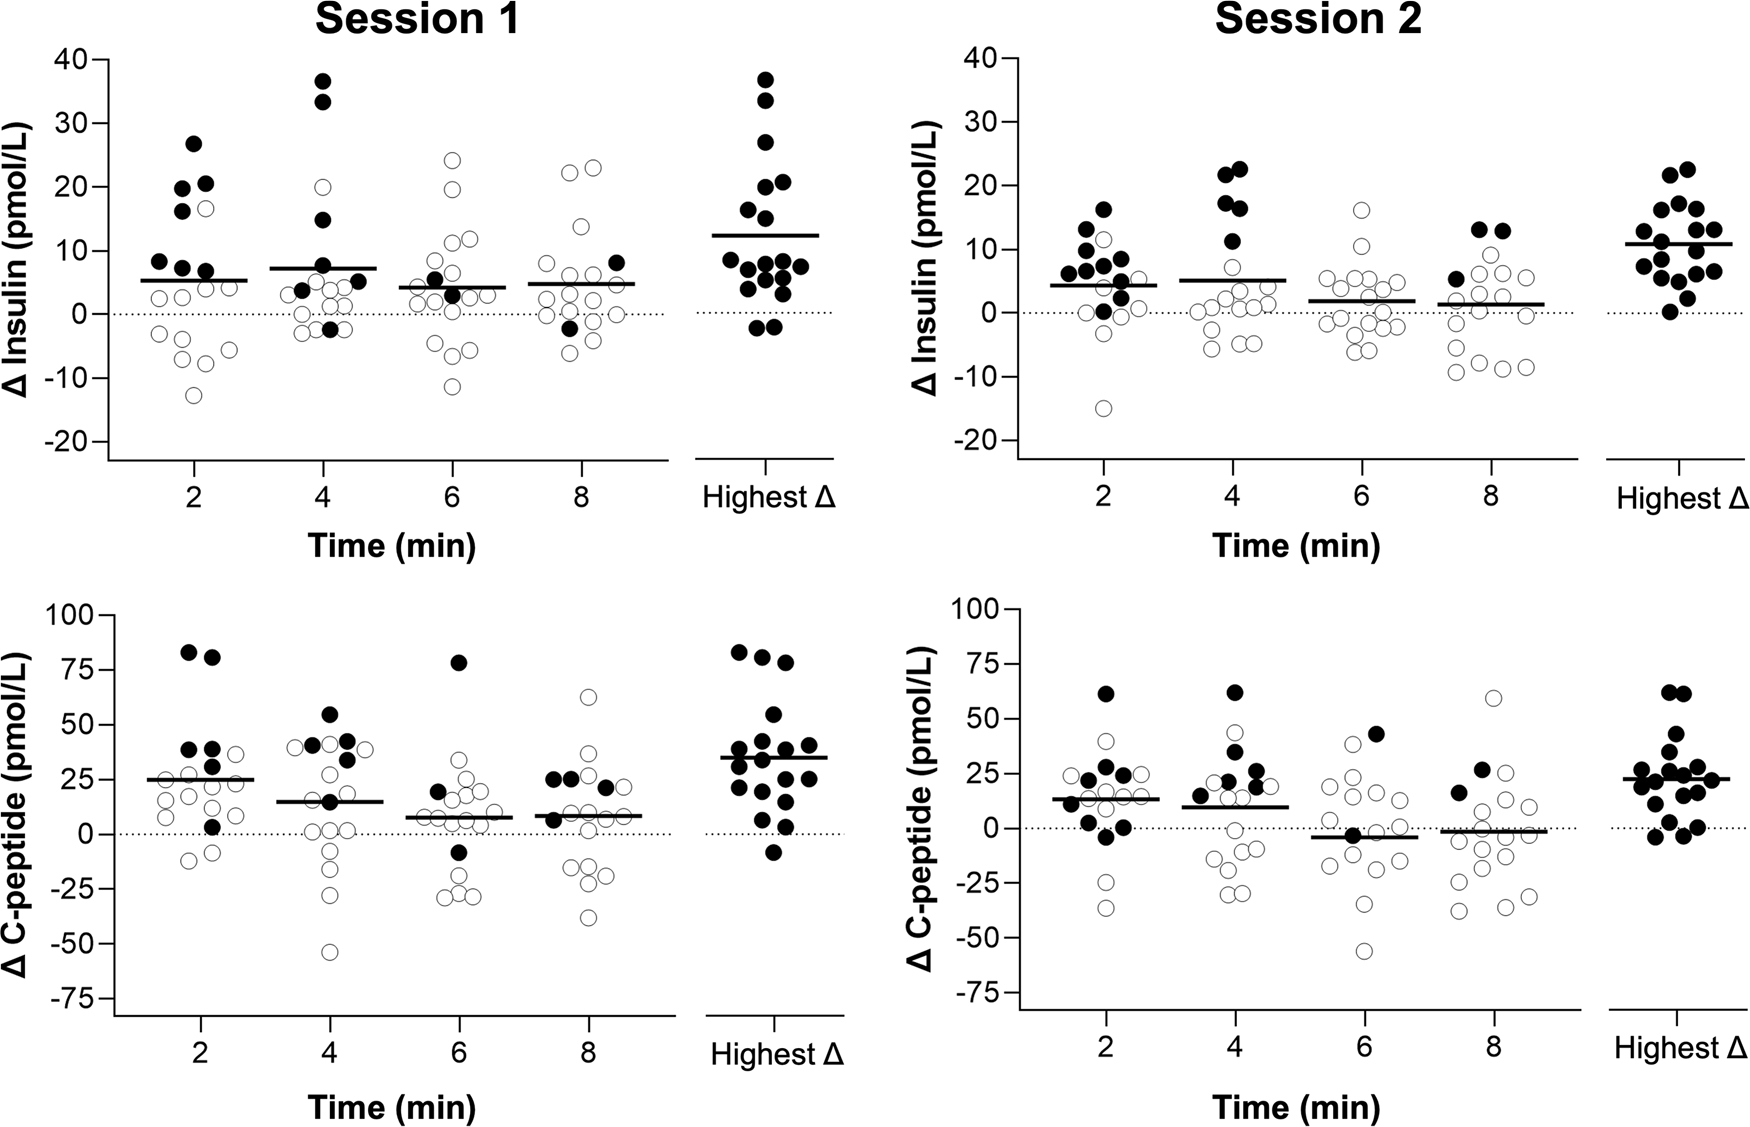
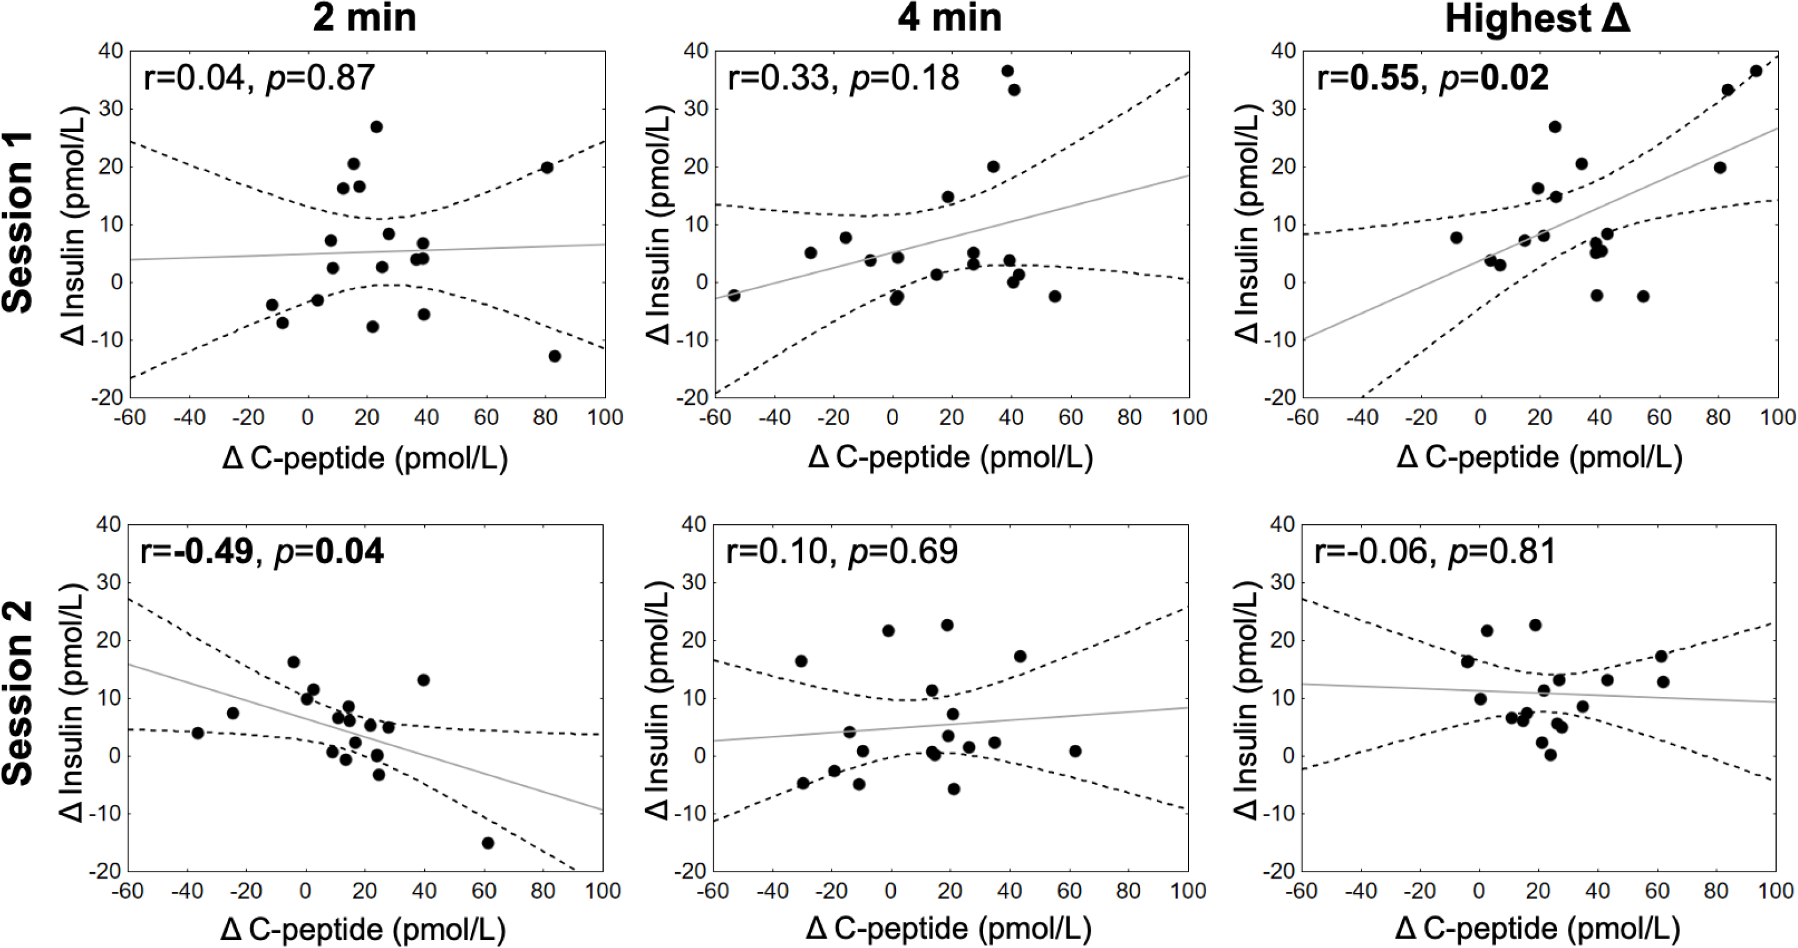
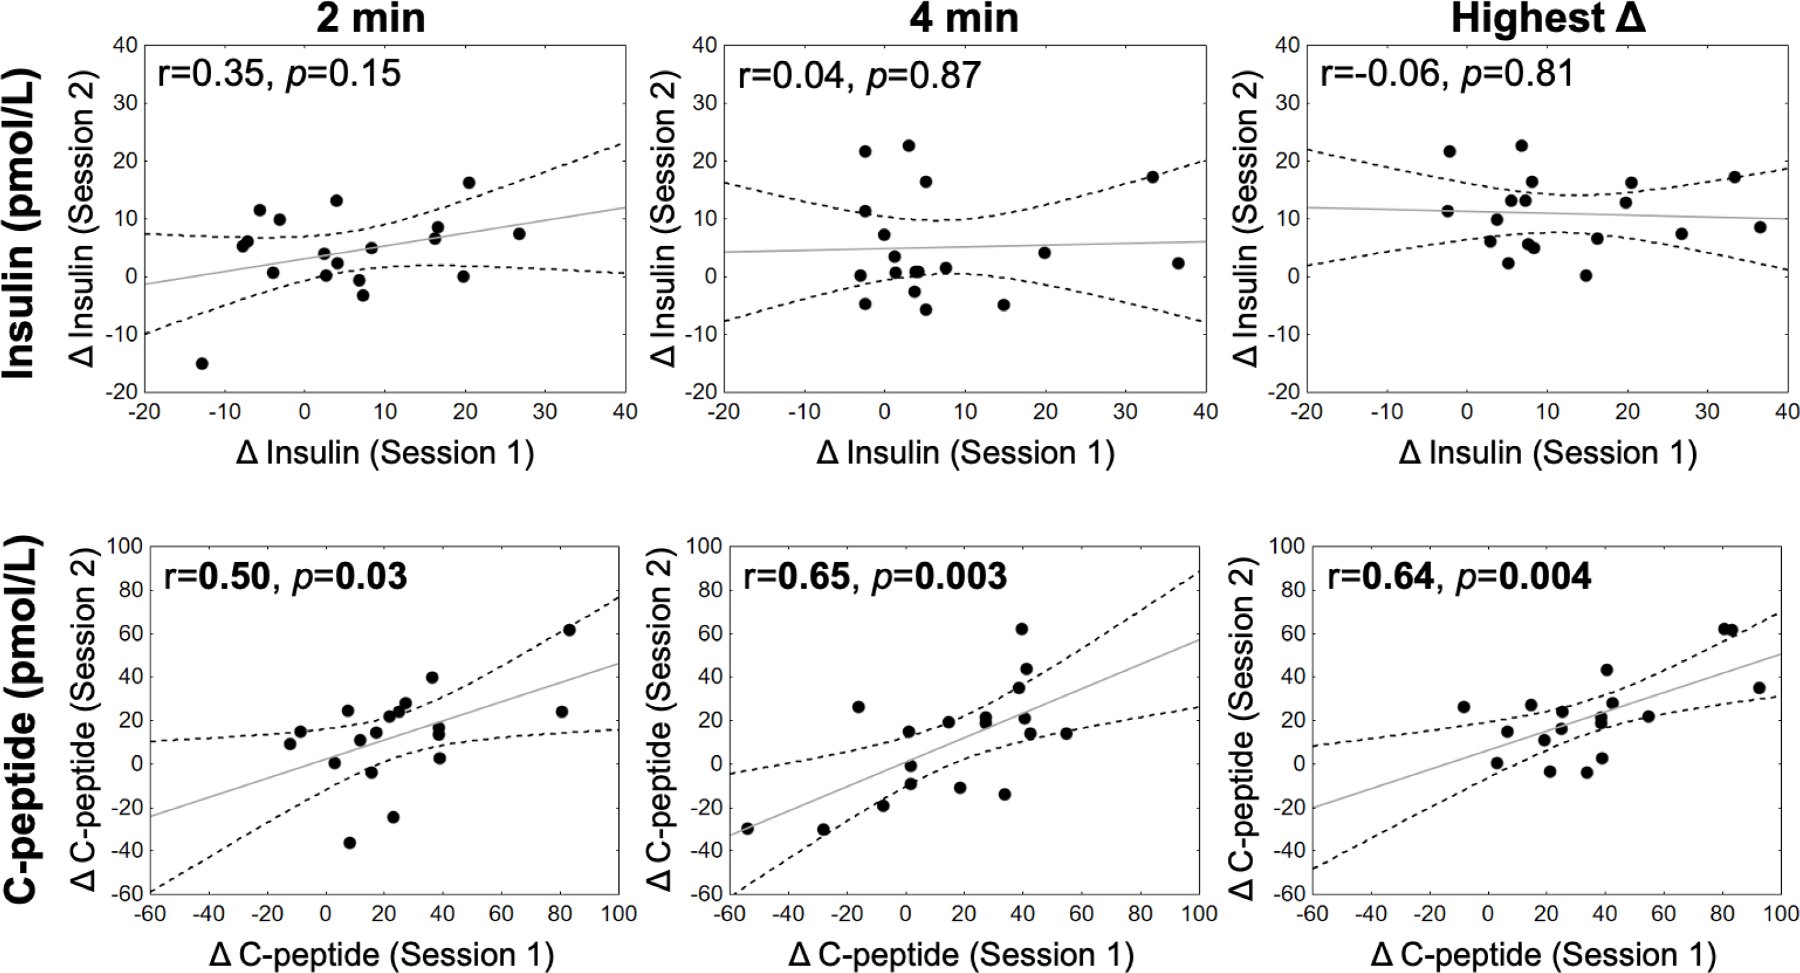
Cephalic phase insulin release (CPIR) is a rapid pulse of insulin secreted within minutes of food-related sensory stimulation. Understanding the mechanisms underlying CPIR in humans has been hindered by its small observed effect size and high variability within and between studies. One contributing factor to these limitations may be the use of peripherally measured insulin as an indicator of secreted insulin, since a substantial portion of insulin is metabolized by the liver before delivery to peripheral circulation. Here, we investigated the use of c-peptide, which is co-secreted in equimolar amounts to insulin from pancreatic beta cells, as a proxy for insulin secretion during the cephalic phase period. Changes in insulin and c-peptide were monitored in 18 adults over two repeated sessions following oral stimulation with a sucrose-containing gelatin stimulus. We found that, on average, insulin and c-peptide release followed a similar time course over the cephalic phase period, but that c-peptide showed a greater effect size. Importantly, when insulin and c-peptide concentrations were compared across sessions, we found that changes in c-peptide were significantly correlated at the 2 min (r = 0.50, p = 0.03) and 4 min (r = 0.65, p = 0.003) time points, as well as when participants' highest c-peptide concentrations were considered (r = 0.64, p = 0.004). In contrast, no significant correlations were observed for changes in insulin measured from the sessions (r = -0.06-0.35, p > 0.05). Herein, we detail the individual variability of insulin and c-peptide concentrations measured during the cephalic phase period, and identify c-peptide as a valuable metric for insulin secretion alongside insulin concentrations when investigating CPIR.
Keywords: C-peptide; Cephalic phase; Individual differences; Oral stimulation; Preabsorptive insulin release.
Copyright © 2022. Published by Elsevier Inc.
Conflict of interest statement
Declaration of Competing Interest
The authors declare no competing financial interests.
Figures
References
-
- Ahrén B, Holst JJ, The cephalic insulin response to meal ingestion in humans is dependent on both cholinergic and noncholinergic mechanisms and is important for postprandial glycemia, Diabetes 50 (2001) 1030. - PubMed
-
- Calles-Escandon J, Robbins DC, Loss of early phase of insulin release in humans impairs glucose tolerance and blunts thermic effect of glucose, Diabetes 36 (1987) 1167. - PubMed
-
- Lorentzen M, Madsbad S, Kehlet H, Tronier B, Effect of sham-feeding on glucose tolerance and insulin secretion, Acta Endocrinol. 115 (1987) 84–86. - PubMed
-
- Teff K, Engelman K, Oral sensory stimulation improves glucose tolerance in humans: effects on insulin, C-peptide, and glucagon, Am. J. Physiol. Regul. Integr. Comp. Physiol. 270 (1996) R1371–R1379. - PubMed
Publication types
MeSH terms
Substances
Grants and funding
LinkOut - more resources
Full Text Sources
Medical
