. 2023 Jan 15;93(2):197-208.
doi: 10.1016/j.biopsych.2022.06.011. Epub 2022 Jun 22.

Somatodendritic Release of Cholecystokinin Potentiates GABAergic Synapses Onto Ventral Tegmental Area Dopamine Cells

Affiliations

Somatodendritic Release of Cholecystokinin Potentiates GABAergic Synapses Onto Ventral Tegmental Area Dopamine Cells

Valentina Martinez Damonte et al. Biol Psychiatry. .

Abstract

Background: Neuropeptides are contained in nearly every neuron in the central nervous system and can be released not only from nerve terminals but also from somatodendritic sites. Cholecystokinin (CCK), among the most abundant neuropeptides in the brain, is expressed in the majority of midbrain dopamine neurons. Despite this high expression, CCK function within the ventral tegmental area (VTA) is not well understood.

Methods: We confirmed CCK expression in VTA dopamine neurons through immunohistochemistry and in situ hybridization and detected optogenetically induced CCK release using an enzyme-linked immunosorbent assay. To investigate whether CCK modulates VTA circuit activity, we used whole-cell patch clamp recordings in mouse brain slices. We infused CCK locally in vivo and tested food intake and locomotion in fasted mice. We also used in vivo fiber photometry to measure Ca2+ transients in dopamine neurons during feeding.

Results: Here we report that VTA dopamine neurons release CCK from somatodendritic regions, where it triggers long-term potentiation of GABAergic (gamma-aminobutyric acidergic) synapses. The somatodendritic release occurs during trains of optogenetic stimuli or prolonged but modest depolarization and is dependent on synaptotagmin-7 and T-type Ca2+ channels. Depolarization-induced long-term potentiation is blocked by a CCK2 receptor antagonist and mimicked by exogenous CCK. Local infusion of CCK in vivo inhibits food consumption and decreases distance traveled in an open field test. Furthermore, intra-VTA-infused CCK reduced dopamine cell Ca2+ signals during food consumption after an overnight fast and was correlated with reduced food intake.

Conclusions: Our experiments introduce somatodendritic neuropeptide release as a previously unknown feedback regulator of VTA dopamine cell excitability and dopamine-related behaviors.

Keywords: Cholecystokinin; Dopamine; Feeding; Neuropeptide; Somatodendritic release; Ventral tegmental area.


Conflict of interest statement

The authors report no biomedical financial interests or potential conflicts of interest.

Figures

Figure 1.
Figure 1.
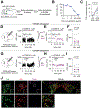
Depolarization alone potentiates IPSCs in the VTA dopamine cells. Left-hand diagrams in this and all figures illustrate the experimental design. (A) Representative time course and example IPSCs (inset) before and after a 6-minute depolarization of the recorded dopamine neuron from −70 to −40 mV with simultaneous afferent LFS (1 Hz) (DEP+LFS). (B) Averaged IPSC amplitudes before and after DEP+LFS (n = 8 cells/8 mice). (C) IPSC amplitudes before and after DEP+LFS (n = 8 cells/8 mice, 5 cells from male mice, 3 from female mice). Paired t test, p = .02, df = 7. For this and all figures, colored symbols/lines represent the mean. Error bars represent SEM. (D) Representative time course and example IPSCs before and after a 6-minute depolarization of the recorded neuron from −70 to −40 mV (DEP). Data for (A–C) are from wild-type mice. (E) Averaged IPSC amplitudes before and after DEP (n = 10 cells/8 mice). (F) IPSC amplitudes before and after DEP (n = 10 cells/8 mice; 7 cells from male mice, 3 from female mice). Paired t test, p = .01, df = 9. (G) Representative time course and example IPSCs from a VTA dopamine neuron expressing channelrhodopsin-2 (Ai32:DAT-IRES-Cre mouse) before and after optical stimulation using trains of light (20 Hz, 1000 ms) delivered for 6 minutes in current clamp. (H) Time course of averaged IPSC amplitudes before and after optical stimulation (n = 5 cells/3 mice). (I) IPSC amplitudes before and after optical stimulation (n = 5 cells/3 mice, 2 cells from male mice, 3 from female mice). Paired t test, p = .03, df = 4. Scale bars = 100 pA, 10 ms. DEP, depolarization; GFP, green fluorescent protein; IPSC, inhibitory postsynaptic current; LFS, low-frequency stimulation; norm., normalized; opto, optogenetic stimulation; VTA, ventral tegmental area.
Figure 2.
Figure 2.
Depolarization-induced long-term potentiation is not blocked by dopamine receptor antagonists. (A) Representative time course and example IPSCs before and after DEP+LFS in the presence of sulpiride (150 nM) and SCH 23390 (10 μM). (B) Time course of averaged IPSC amplitudes before and after DEP+LFS (n = 8 cells/4 mice). (C) IPSC amplitudes before and after DEP+LFS (n = 8 cells/4 mice, 8 cells from female mice). Paired t test, p = .02, df = 7. Scale bars = 100 pA, 10 ms. D1R, dopamine D1 receptor; D2R, dopamine D2 receptor; DEP, depolarization; GFP, green fluorescent protein; IPSC, inhibitory postsynaptic current; LFS, low-frequency stimulation; norm., normalized; VTA, ventral tegmental area.
Figure 3.
Figure 3.
Depolarization of dopamine neurons releases CCK and triggers long-term potentiation acting on CCK2R receptors. (A) Diagram of experimental design for ELISA. (B) Representative calibration curve from 1 experiment. (C) CCK concentration before and after optogenetic stimulation of the VTA dopamine neurons (6 experiments, 5 mice/experiment, 19 male and 11 female mice). Wilcoxon paired test, p = .03. (D) Representative time course and example IPSCs before and after a 6-minute depolarization of the recorded neuron from −70 to −40 mV with simultaneous afferent LFS (1 Hz) (DEP+LFS) in the presence of LY225910 (1 μM). (E) Time course of averaged IPSC amplitudes before and after DEP+LFS (n = 7 cells/4 mice). Colored symbols/lines represent the mean response across all cells; error bars represent SEM. (F) IPSC amplitudes before and after DEP+LFS in the presence of LY225910 (n = 7 cells/4 mice, 6 cells from male mice, 1 cell from a female mouse). Wilcoxon paired test, p = .58. (G) Representative time course and example IPSCs before and after a 6-minute depolarization of the recorded dopamine neuron from −70 to −40 mV (DEP) in the presence of LY225910 (1 μM). (H) Averaged IPSC amplitudes before and after DEP (n = 6 cells/3 mice). (I) IPSC amplitudes before and after DEP in the presence of LY225910 (n = 6 cells/3 mice, 4 cells from male mice, 2 from female mice). Paired t test, p = .51, df = 5. Scale bars = 100 pA, 10 ms. (J) Representative confocal images of fluorescent in situ hybridization on a coronal slice through the VTA. Dat (green), Cck (red), Cck2r (magenta), and merge: overlay of all 3 signals. Scale bar at high magnification = 20 μm. CCK, cholecystokinin; CCK2R, cholecystokinin 2 receptor; DEP, depolarization; ELISA, enzyme-linked immunosorbent assay; GFP, green fluorescent protein; IPSC, inhibitory postsynaptic current; LFS, low-frequency stimulation; norm., normalized; opto, optogenetic; VTA, ventral tegmental area.
Figure 4.
Figure 4.
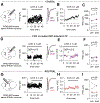
CCK is necessary and sufficient to potentiate caudally evoked but not rostrally evoked IPSCs. (A) Representative time course and example IPSCs evoked in a dopamine neuron with a stimulating electrode placed caudal to the VTA (diagram) before and during bath application of CCK (0.1 μM). (B) Averaged caudally evoked IPSC amplitudes before and during the presence of CCK (n = 8 cells/7 mice). (C) Caudally evoked IPSC amplitudes before and after application of CCK (n = 8 cells/7 mice, 3 cells from male mice, 5 from female mice). Paired t test, p = .04, df = 7. (D) Representative time course and example IPSCs before and after DEP+LFS in the presence of CCK. CCK (1 μM) was present for at least 20 minutes before DEP+LFS. (E) Time course of averaged IPSC amplitudes before and after DEP+LFS (n = 7 cells/5 mice). (F) IPSC amplitudes before and after DEP+LFS (n = 7 cells/5 mice, 2 cells from male mice, 5 cells from female mice). Wilcoxon paired test, p > .999. (G) Representative time course and example IPSCs evoked in a dopamine neuron with a stimulating electrode placed rostrally within the VTA (diagram) before and after bath application of CCK (0.1 μM). (H) Averaged rostrally evoked IPSC amplitudes before and after CCK application (n = 7 cells/5 mice). (I) Rostrally evoked IPSC amplitudes before and after CCK application (n = 7 cells/5 mice, 5 cells from male mice, 2 cells from female mice). Paired t test, p = .86, df = 6. Scale bars = 100 pA, 10 ms. CCK, cholecystokinin; DEP, depolarization; GFP, green fluorescent protein; IPSC, inhibitory postsynaptic current; LFS, low-frequency stimulation; LTP, long-term potentiation; norm., normalized; VTA, ventral tegmental area.
Figure 5.
Figure 5.
CCK potentiates GABAA synapses but does not affect D2-IPSCs. (A) Representative examples of (a) composite IPSCs (scale bar = 100 pA, 1s); (b) D2-IPSCs (scale bar = 10 pA, 10 ms); and (c) GABAA IPSCs (scale bar = 100 pA, 10 ms) recorded simultaneously from a single dopamine neuron before and after CCK (0.1 μM) bath application. (B) Representative example time course of simultaneously recorded D2-IPSCs (green) and GABAA IPSCs (purple). (C) Averaged IPSC amplitudes before and after CCK bath application (n = 10 cells/9 mice; 6 cells from male mice, 4 from female mice). (D) D2-IPSC (left) and GABAA (right) IPSC amplitudes before and after the application of CCK (n = 10 cells/9 mice). Wilcoxon paired test: D2-IPSCs, p > .99; GABAA IPSCs, p = .04. CCK, cholecystokinin; GABA, gamma-aminobutyric acid; IPSC, inhibitory postsynaptic current; norm., normalized.
Figure 6.
Figure 6.
Mechanisms underlying somatodendritic depolarization–induced CCK release. (A) Representative time course and example IPSCs before and after a 6-minute DEP of the recorded neuron from −70 to −40 mV with BAPTA (30 mM) included in the patch pipette. To allow the BAPTA to diffuse into the cell, DEP was initiated at least 20 minutes after the start of whole-cell recording. (B) Time course of averaged IPSC amplitudes in BAPTA-loaded cells before and after DEP (n = 7 cells/4 mice). (C) IPSC amplitudes in BAPTA-loaded cells before and after DEP (n = 7 cells/4 mice, 2 cells from male mice, 5 cells from female mice). Paired t test, p = .54, df = 6. (D) Representative time course and example IPSCs before and after DEP in the presence of NiCl2 (50 μM). (E) Time course of averaged IPSC amplitudes before and after DEP (n = 6 cells/3 mice). (F) IPSC amplitudes before and after DEP in the presence of NiCl2 (n = 6 cells/3 mice, 5 cells from male mice, 1 cell from a female mouse). Paired t test, p = .29, df = 5. Pie chart indicates that in 4 of 4 neurons, D2-IPSCs could be evoked in the presence of NiCl2. (G) Representative time course and example IPSCs before and after DEP in a VTA dopamine neuron from a syt7 KO mouse. (H) Time course of averaged IPSC amplitudes before and after DEP in dopamine neurons from syt7 KO mice (n = 6 cells/3 mice). (I) IPSC amplitudes before and after DEP in cells from syt7 KO mice (n = 6 cells/3 mice, 4 cells from male mice, 2 cells from female mice). Pie chart indicates that in 6 of 7 syt7 KO neurons from syt7 KO mice, D2-IPSCs could not be evoked. Paired t test, p = .25, df = 5. Scale bars = 100 pA, 10 ms. D2, dopamine D2 receptor; DEP, depolarization; GFP, green fluorescent protein; IPSC, inhibitory postsynaptic current; KO, knockout; norm., normalized; VGCC, voltage-gated calcium channel; VTA, ventral tegmental area.
Figure 7.
Figure 7.
Intra-VTA CCK infusion reduces food intake and dopamine cell firing rate in vitro. (A) Diagram of the experimental design for food intake or open field locomotion. (B) Food intake over the 1-hour period after bilateral intra-VTA infusion of either CCK or veh (n = 13, 11 male mice, 3 female mice). Cannula placement in the VTA was confirmed post hoc. Paired t test, p = .02, df = 13. (C) Total distance traveled in the open field apparatus over a 30-minute period after bilateral intra-VTA infusion of CCK or veh (n = 8 mice, 5 male mice, 3 female mice). Paired t test, p = .008, df = 7. (D) Velocity in the open field apparatus over a 30-minute period after bilateral intra-VTA infusion of CCK or veh (n = 8 mice, 5 male mice, 3 female mice). Wilcoxon paired test, p = .008. (E) Diagram of the experimental design for measuring cell attached firing rate. CCK or veh was infused bilaterally into the VTA of fasted mice, and at least 10 minutes later, slices were prepared and stored in aCSF without added CCK. (F) On-cell firing rate of GFP+ VTA neurons in slices from mice that received either saline or CCK in vivo (total n = 141 cells, 7 mice; veh/aCSF n = 77, 24 cells from male mice, 53 cells from female mice; CCK/aCSF n = 64, 14 cells from male mice, 50 cells from female mice). Mann-Whitney test, p = .02. Scale bar = 50 pA, 5 s. aCSF, artificial cerebrospinal fluid; CCK, cholecystokinin; GFP, green fluorescent protein; veh, vehicle; VTA, ventral tegmental area.
Figure 8.
Figure 8.
Intra-VTA CCK infusion reduces dopamine cell calcium transients in vivo. (A) Schematic of fiber photometry configuration and experimental timeline. (B) Representative image of GCaMP8m in the VTA dopamine neurons, coronal slice. Dotted lines indicate dual cannula position. (C) Peristimulus histogram of time course of averaged GCaMP8m transient z scores event-locked to food consumption (n = 8 mice, 5 females, 3 males). (D) Quantification of peak z scores during food consumption after either saline or CCK infusion (n = 8 mice, 5 females, 3 males). Paired t test, p = .0006, df = 7. (E) Quantification of food intake during recording sessions over a 30-minute period (n = 8 mice, 5 females, 3 males). Paired t test, p = .004, df = 7. (F) Representative heat map of z score changes over all trials from individual mice; 0 time is the onset of food consumption. (G) CCK-induced dopamine cell inhibition and food intake are significantly correlated (n = 8 mice, 5 females, 3 males). Pearson’s r = 0.84. Paired t test, p = .009. Bold symbols/lines represent the mean response across all animals; error bars represent SEM. CCK, cholecystokinin; DA, dopamine; LED, light-emitting diode; veh, vehicle; VTA, ventral tegmental area.

Similar articles

Cited by

References

    1. Smith SJ, Hawrylycz M, Rossier J, Sümbül U (2020): New light on cortical neuropeptides and synaptic network plasticity. Curr Opin Neurobiol 63:176–188. - PubMed
    1. Ludwig M, Leng G (2006): Dendritic peptide release and peptide-dependent behaviours. Nat Rev Neurosci 7:126–136. - PubMed
    1. Wagner JJ, Terman GW, Chavkin C (1993): Endogenous dynorphins inhibit excitatory neurotransmission and block LTP induction in the hippocampus. Nature 363:451–454. - PMC - PubMed
    1. Krawczyk M, Mason X, DeBacker J, Sharma R, Normandeau CP, Hawken ER, et al. (2013): D1 dopamine receptor-mediated LTP at GABA synapses encodes motivation to self-administer cocaine in rats. J Neurosci 33:11960–11971. - PMC - PubMed
    1. Crosby KM, Baimoukhametova DV, Bains JS, Pittman QJ (2015): Postsynaptic depolarization enhances GABA drive to dorsomedial hypothalamic neurons through somatodendritic cholecystokinin release. J Neurosci 35:13160–13170. - PMC - PubMed

Publication types