. 2022 Aug 12;13(8):702.
doi: 10.1038/s41419-022-05139-3.

Acidosis induces RIPK1-dependent death of glioblastoma stem cells via acid-sensing ion channel 1a

Affiliations

Acidosis induces RIPK1-dependent death of glioblastoma stem cells via acid-sensing ion channel 1a

Jan Clusmann et al. Cell Death Dis. .

Abstract

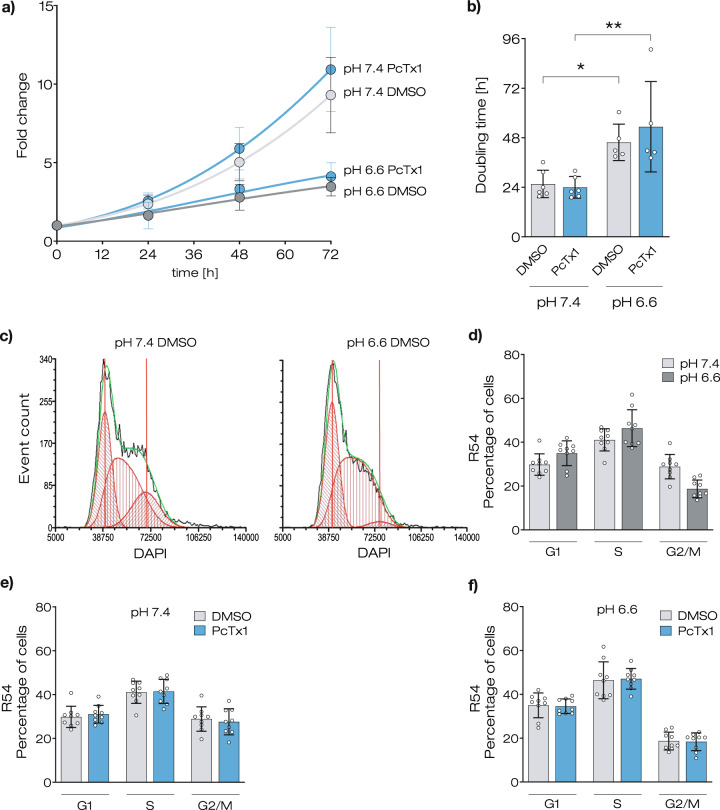
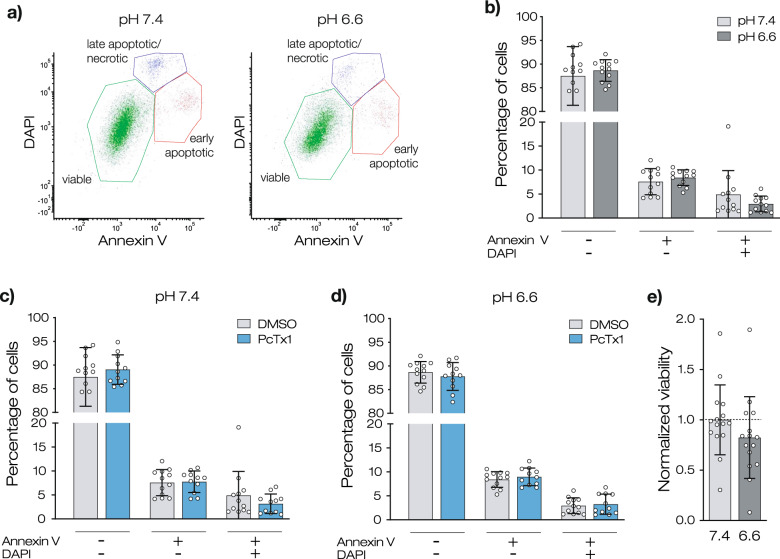
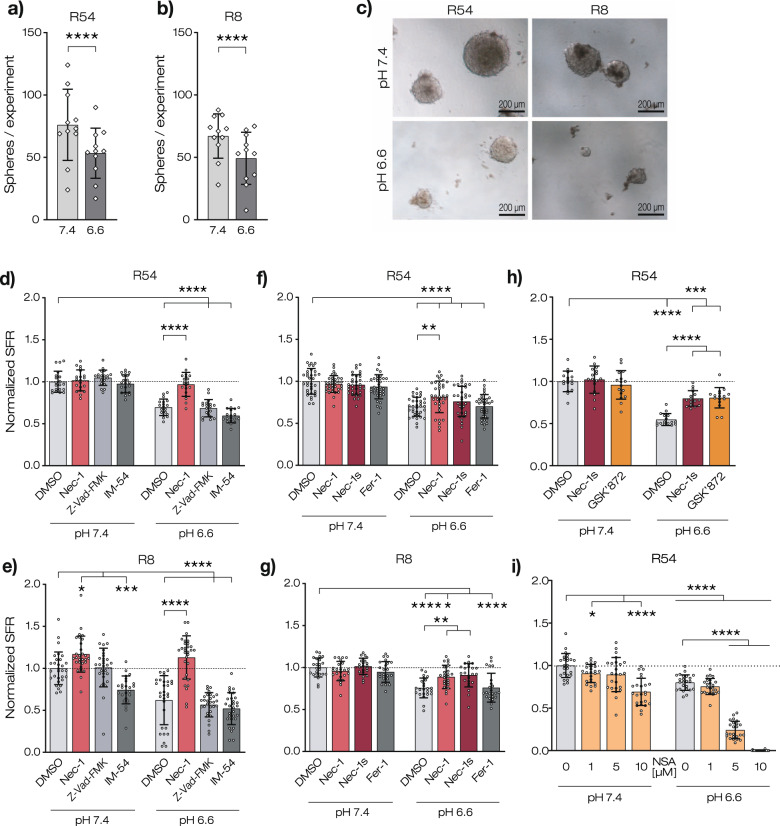
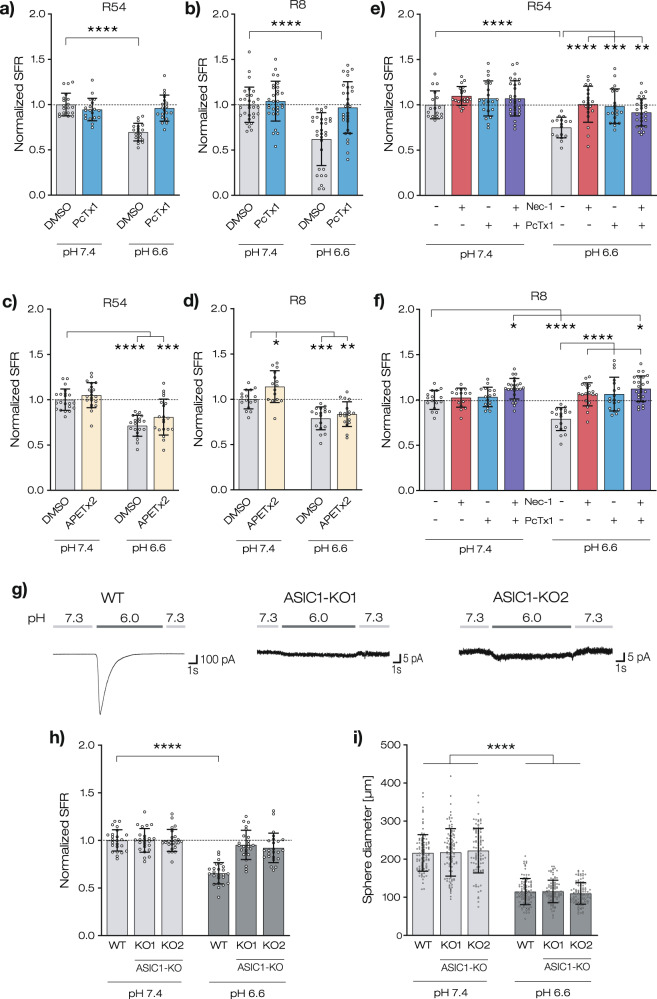
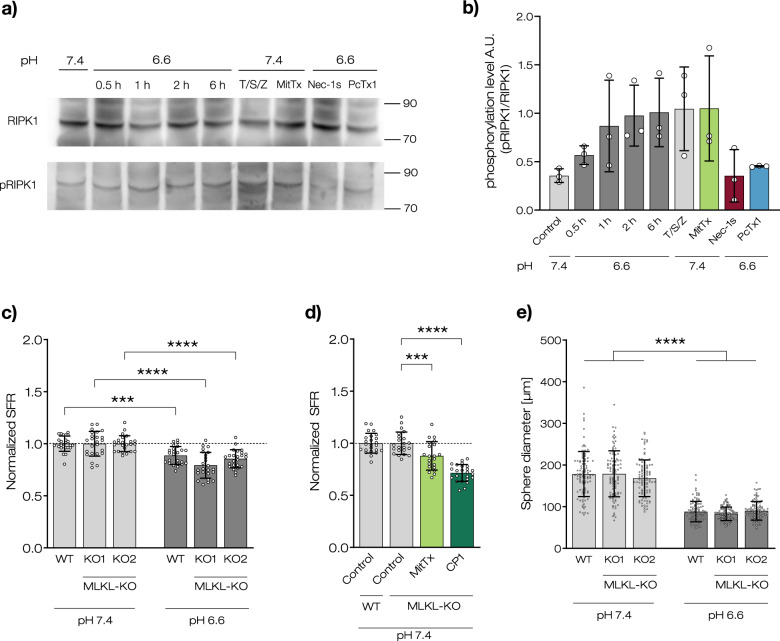
Eliciting regulated cell death, like necroptosis, is a potential cancer treatment. However, pathways eliciting necroptosis are poorly understood. It has been reported that prolonged activation of acid-sensing ion channel 1a (ASIC1a) induces necroptosis in mouse neurons. Glioblastoma stem cells (GSCs) also express functional ASIC1a, but whether prolonged activation of ASIC1a induces necroptosis in GSCs is unknown. Here we used a tumorsphere formation assay to show that slight acidosis (pH 6.6) induces necrotic cell death in a manner that was sensitive to the necroptosis inhibitor Nec-1 and to the ASIC1a antagonist PcTx1. In addition, genetic knockout of ASIC1a rendered GSCs resistant to acid-induced reduction in tumorsphere formation, while the ASIC1 agonist MitTx1 reduced tumorsphere formation also at neutral pH. Finally, a 20 amino acid fragment of the ASIC1 C-terminus, thought to interact with the necroptosis kinase RIPK1, was sufficient to reduce the formation of tumorspheres. Meanwhile, the genetic knockout of MLKL, the executive protein in the necroptosis cascade, did not prevent a reduction in tumor sphere formation, suggesting that ASIC1a induced an alternative cell death pathway. These findings demonstrate that ASIC1a is a death receptor on GSCs that induces cell death during prolonged acidosis. We propose that this pathway shapes the evolution of a tumor in its acidic microenvironment and that pharmacological activation of ASIC1a might be a potential new strategy in tumor therapy.


Conflict of interest statement

The authors declare no competing interests.

Figures

Fig. 1
Fig. 1. Acidic pH decreases proliferation without effect on cell cycle in R54 GSCs.
a Growth curves for R54 cells incubated in a medium with neutral (pH 7.4) or acidic pH (pH 6.6) with or without PcTx1. The cells were counted every 24 h for 4 days. Data are shown as mean ± SD, n = 6. b Doubling time of R54 cells, as determined with the data from panel (a). Data are shown as mean ± SD; *p < 0.05; **p < 0.01 (one-way ANOVA followed by Sidak’s post-hoc test). c Representative histograms of flow cytometry. d Percentage of cells in different phases of the cell cycle at pH 7.4 and at pH 6.6. e As in d but for pH 7.4 without and with PcTx1. f As in e, but for pH 6.6. The values for the DMSO condition in e, f are from panel (d). Data are shown as mean ± SD of nine samples from three independent experiments. Statistical analysis by two-way ANOVA with Bonferroni correction.
Fig. 2
Fig. 2. Acidic pH does not induce apoptosis in R54 GSCs.
a Representative dot plots of flow cytometry measurements. b Percentage of viable, early apoptotic, and late apoptotic R54 cells at pH 7.4 and at pH 6.6. c As in b but for pH 7.4 with and without PcTx1. (d) as in c but for pH 6.6. The values for the DMSO condition in (c, d) are from panel (b). Data are shown as mean ± SD of nine samples from three independent experiments. Statistical analysis by two-way ANOVA with Bonferroni correction. e Normalized viability (mean ± SD) of R54 cells after 24 h incubation at pH 7.4 or at pH 6.6. n = 15 from three biological replicates. Statistical analysis by unpaired Student’s t-test.
Fig. 3
Fig. 3. Nec-1 rescues the reduced sphere formation rate at acidic pH.
a, b Sphere numbers (mean ± SD) at pH 7.4 or at pH 6.6 at d12. 1 data point represents 1 experiment with n > 8 wells/experiment. c Representative images of spheroids after 12 days incubation at pH 7.4 or at pH 6.6. d, e SFR (mean ± SD) after 12 days incubation at pH 7.4 or at pH 6.6 with 20 µM Nec-1, 20 µM Z-Vad-FMK, or 10 µM IM-54. SFR was normalized to DMSO pH 7.4 control, which was 80.7 ± 24.5 for R54 and 62.2 ± 17.25 for R8. 1 data point represents 1 well. n ≥ 19 wells per condition from 2 (d, g, i) or 3 (e, f) independent experiments. (f, g) as in (d) but with 20 µM Nec-1, 20 µM Nec-1s or 2 µM Fer-1 with a mean of 47.4 ± 6.6 spheres for R54 and 72.4 ± 7.9 spheres for R8. h as in d but with 20 µM Nec-1s or 10 µM GSK’872 with a mean of 82.2 ± 8.9 spheres. i as in d, but with different concentrations of NSA, with a mean of 92 ± 12.8 spheres. *p < 0.05; **p < 0.01; ***p < 0.001; ****p < 0.0001 (one-way ANOVA followed by Dunnett’s post-hoc test).
Fig. 4
Fig. 4. Reduced sphere growth at pH 6.6 is ASIC1a-dependent.
af SFR after 12 days at pH 7.4 or at pH 6.6 with 100 nM PcTx1, 500 nM APETx2, or 100 nM PcTx1 and 20 µM Nec-1 combined. SFR was normalized to DMSO pH 7.4 control, which was 74.5 ± 11.1 for a, 46.3 ± 6.7 for b, 102.4 ± 11.5 for c and e, and 77 ± 7.9 for d and f. 1 data point represents 1 well. n ≥ 17 wells per condition, 2 independent experiments. *p < 0.05; **p < 0.01; ***p < 0.001; ****p < 0.0001. One-way ANOVA was followed by Dunnett’s post-hoc test. g Traces of whole-cell patch clamp experiments with wildtype or ASIC1a knockout R54 cells. ASIC currents were elicited by a pH drop from pH 7.3 to 6.0. Each trace is representative of five similar measurements. h SFR after 12 days at pH 7.4 or at pH 6.6. SFR was normalized to the respective pH 7.4 control, which was 104.7 ± 11 for wt R54, 77 ± 9.1 for KO1, and 60.4 ± 6.8 for KO2. n = 24 wells per condition from 2 independent experiments. i Sphere diameters (mean ± SD) in µm of 100 spheres per condition after 12 days at pH 7.4 or at pH 6.6. Measurements are from 2 independent experiments. Data points represent single sphere diameters. *p < 0.05; **p < 0.01; ***p < 0.001; ****p < 0.0001 (one-way ANOVA followed by Sidak’s post-hoc test).
Fig. 5
Fig. 5. Sphere growth can be reduced by MitTx or a peptide resembling the C-Terminus of ASIC1a.
a, b SFR after 7 days at pH 7.4, without or with 20 nM MitTx. SFR was normalized to pH 7.4 control, which was 100.4 ± 10.5 for R54 and 79.1 ± 11.8 for R8. c Schematic illustration of the ASIC1a protein with N- and C-Termini, transmembrane domains (TM1/2) (extracellular loop shortened) and location of CP1 and CP2 illustrated in color. d Sequence of peptides CP1 and CP2, combined with HI-viral peptide transduction sequence TAT. e, f SFR after 7 days at pH 7.4, with or without 10 µM CP1 or 10 µM CP2 and with or without 20 µM Nec-1. SFR was normalized to pH 7.4 control, which was 99.9 ± 11.0 for R54 and 82.2 ± 11.6 for R8. g SFR of ASIC1a KO cells after 7 days at pH 7.4 without or with 20 nM MitTx, 10 µM CP1, or 10 µM CP2. SFR was normalized to pH 7.4 control, which was 77.1 ± 9.5 a, b, eg n ≥ 17 wells per condition from 2 independent experiments. Mean ± SD are shown. *p < 0.05; ****p < 0.0001 (one-way ANOVA followed by Dunnett’s post-hoc test).
Fig. 6
Fig. 6. Transmission electron microscopy of R54 GSCs reveals necrosis at acidic pH early during sphere formation.
a, b Representative TEM images of GSCs maintained for 1 day at pH 7.4 or at pH 6.6. White squares in a indicate regions that are shown on an expanded scale in (b). Arrows indicate plasma membrane, arrowheads mitochondria. c Representative TEM images of GSCs maintained for 7 days at pH 7.4 or at pH 6.6. d Pie charts indicating the percentage of cells with normal vs. necrotic morphology in TEM after 1 day or after 7 days at pH 7.4 or at pH 6.6. At d1, n = 106 for pH 7.4 and n = 118 for pH 6.6, respectively. At d7, n = 107 for pH 7.4 and n = 132 for pH 6.6, respectively. ****p < 0.0001 (Fisher’s exact test).
Fig. 7
Fig. 7. Acidic pH and ASIC1a-activation induce phosphorylation of RIPK1 in R54 GSCs.
a Western blots of RIPK1 and pRIPK1 from R54 GSCs, incubated either at pH 7.4 or at pH 6.6 for different periods of time (0.5, 1, 2, or 6 h) with or without different inhibitors and activators as indicated. T/S/Z = TNF-α, BV6 and z-Vad-FMK. 20 µM Nec-1s or 100 nM PcTx1 were applied at acidic pH for 6 h. b Densitometric quantification of western blot bands for pRIPK1 normalized to RIPK1. Data are shown as mean ± SD and are from three western blots from three independent experiments. c SFR for wt or MLKL-KO cells after 11 days at pH 7.4 or at pH 6.6. SFR was normalized to the respective pH 7.4 control, which was 81.5 ± 5.7 for wt, 71.3 ± 8.2 for KO1, and 74.8 ± 5.5 for KO2. 1 data point represents 1 well. n = 24 wells per condition, three independent experiments. d SFA for KO2 as in c, but without or with 20 nM MitTx or 10 µM CP1. SFR was normalized to the respective pH 7.4 control, which was 84.1 ± 7.8 for wt and 63.2 ± 6.2 for KO2. e Sphere diameters (mean ± SD) in µm of 100 spheres per condition after 11 days at pH 7.4 or at pH 6.6. Measurements are from two independent experiments. Data points represent single sphere diameters. ***p < 0.001; ****p < 0.0001 (one-way ANOVA followed by Sidak’s post-hoc test).

References

    1. Degterev A, Hitomi J, Germscheid M, Ch’en IL, Korkina O, Teng X, et al. Identification of RIP1 kinase as a specific cellular target of necrostatins. Nat Chem Biol. 2008;4:313. doi: 10.1038/nchembio.83. - DOI - PMC - PubMed
    1. Cho YS, Challa S, Moquin D, Genga R, Ray TD, Guildford M, et al. Phosphorylation-driven assembly of the RIP1–RIP3 complex regulates programmed necrosis and virus-induced inflammation. Cell. 2009;137:1112–23. doi: 10.1016/j.cell.2009.05.037. - DOI - PMC - PubMed
    1. Li J, McQuade T, Siemer AB, Napetschnig J, Moriwaki K, Hsiao YS, et al. The RIP1/RIP3 necrosome forms a functional amyloid signaling complex required for programmed necrosis. Cell. 2012;150:339–50. doi: 10.1016/j.cell.2012.06.019. - DOI - PMC - PubMed
    1. Sun L, Wang H, Wang Z, He S, Chen S, Liao D, et al. Mixed lineage kinase domain-like protein mediates necrosis signaling downstream of RIP3 kinase. Cell. 2012;148:213–27. doi: 10.1016/j.cell.2011.11.031. - DOI - PubMed
    1. Zhao J, Jitkaew S, Cai Z, Choksi S, Li Q, Luo J, et al. Mixed lineage kinase domain-like is a key receptor interacting protein 3 downstream component of TNF-induced necrosis. Proc Natl Acad Sci USA. 2012;109:5322–7. doi: 10.1073/pnas.1200012109. - DOI - PMC - PubMed

Publication types

MeSH terms

Substances