. 2022 Aug 12;12(1):13740.
doi: 10.1038/s41598-022-15109-6.

Cortical waste clearance in normal and restricted sleep with potential runaway tau buildup in Alzheimer's disease

Affiliations

Cortical waste clearance in normal and restricted sleep with potential runaway tau buildup in Alzheimer's disease

Tahereh Tekieh et al. Sci Rep. .

Abstract

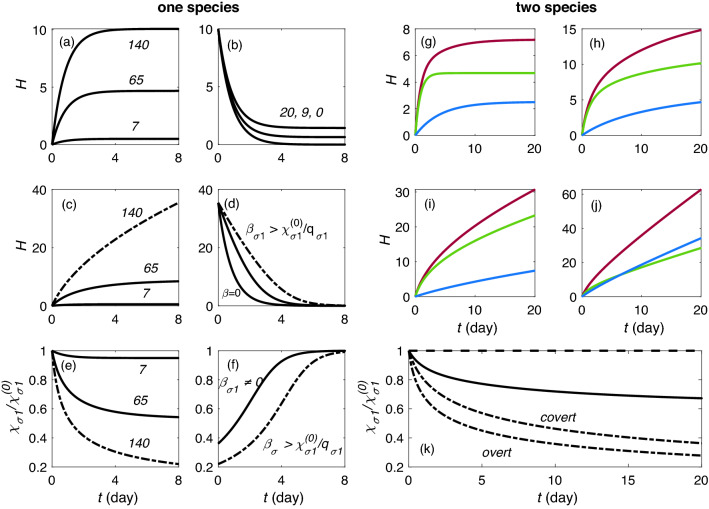
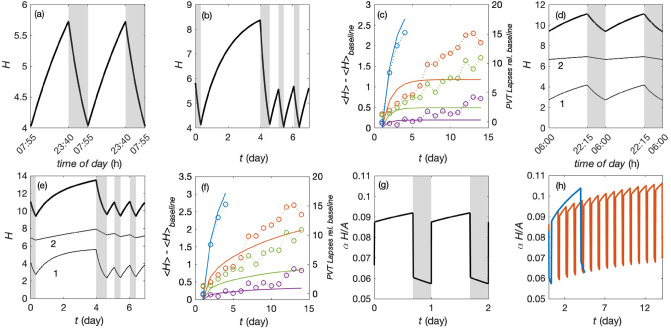
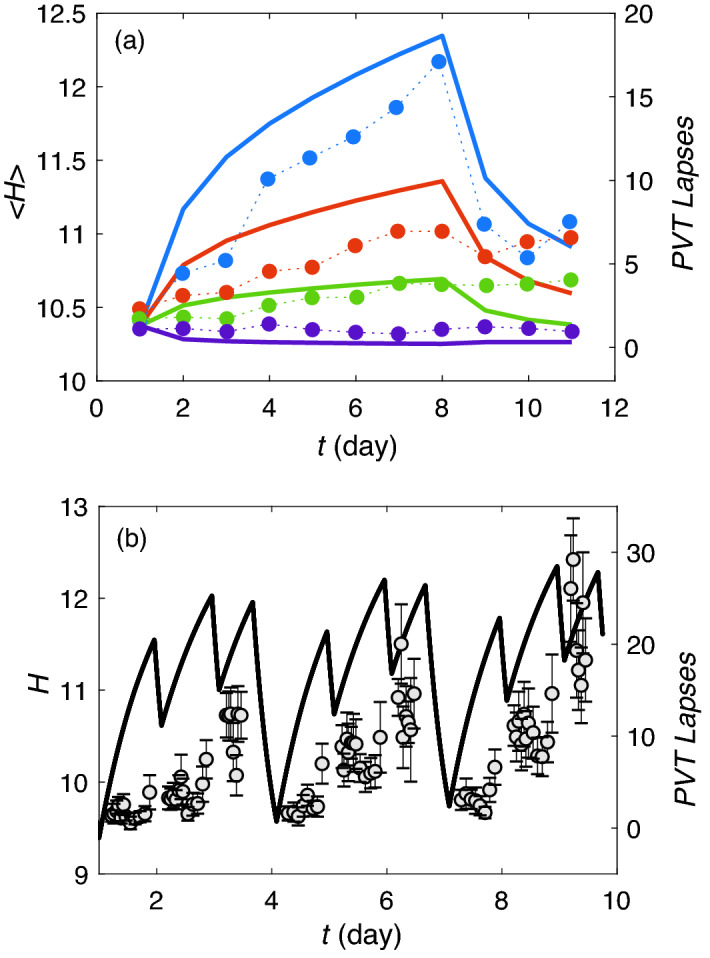
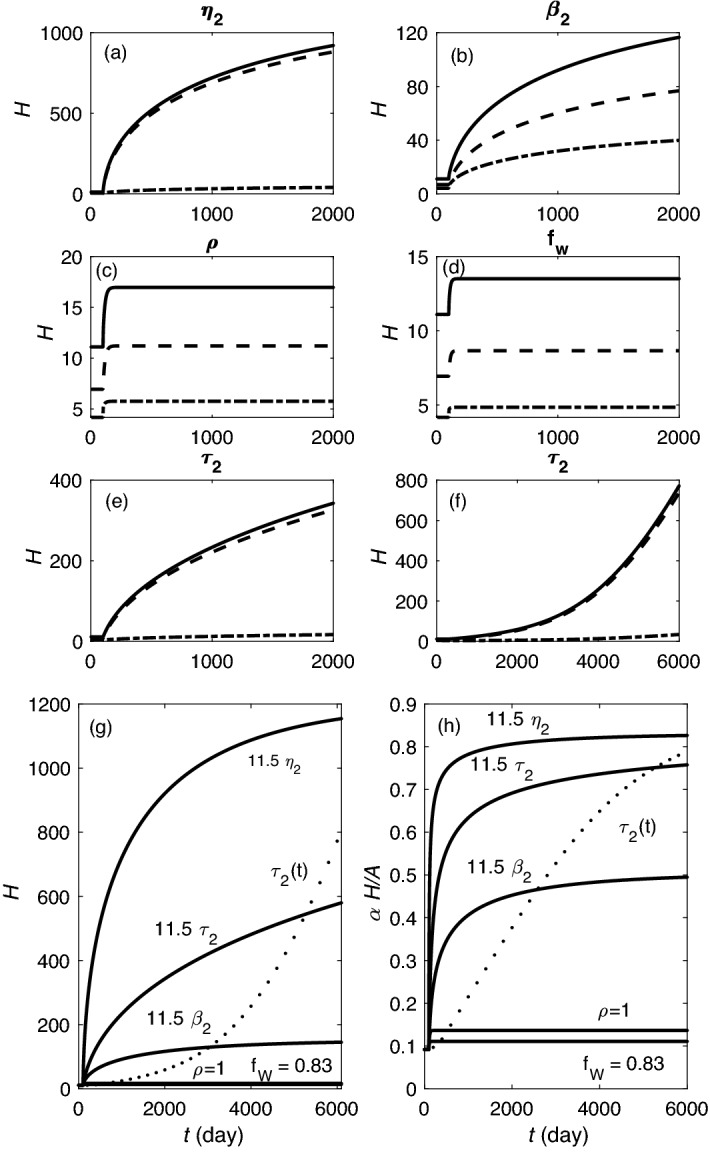
Accumulation of waste in cortical tissue and glymphatic waste clearance via extracellular voids partly drives the sleep-wake cycle and modeling has reproduced much of its dynamics. Here, new modeling incorporates higher void volume and clearance in sleep, multiple waste compounds, and clearance obstruction by waste. This model reproduces normal sleep-wake cycles, sleep deprivation effects, and performance decreases under chronic sleep restriction (CSR). Once fitted to calibration data, it successfully predicts dynamics in further experiments on sleep deprivation, intermittent CSR, and recovery after restricted sleep. The results imply a central role for waste products with lifetimes similar to tau protein. Strong tau buildup is predicted if pathologically enhanced production or impaired clearance occur, with runaway buildup above a critical threshold. Predicted tau accumulation has timescales consistent with the development of Alzheimer's disease. The model unifies a wide sweep of phenomena, clarifying the role of glymphatic clearance and targets for interventions against waste buildup.


Conflict of interest statement

The authors declare no competing interests.

Figures

Figure 1
Figure 1
Model schematics. (a) Model of arousal dynamics incorporating key interactions between the homeostatic drive H, circadian drive C, and the sleep- and wake-active neuronal populations, VLPO and MA nuclei. Bar-headed lines indicate inhibitory connections, while the arrows show excitatory action. Dotted lines show relevant model outputs—sleep times and alertness. Constraints, such as sleep restriction are incorporated through action of the MA nuclei. See text for parameter descriptions. (b) Schematic cross section of an interstitial void during wake and during sleep with unobstructed flow (top) and obstructed flow (bottom) due to build up of waste products, shown shaded. The void radius increases during sleep by a factor of ρ. In the absence of clearance, the area αH obstructed due to the effects of waste products is the same during wake and sleep.
Figure 2
Figure 2
Homeostatic dynamics with one and two species in a fixed arousal state with and without runaway. One species dynamics are shown in (a)–(f). (a) Rising H1 and βσ1=0 for production rates qσ1=7×10-6,65×10-6, and 140×10-6 s-1, as labeled in units of 10-6. (b) Falling H1 and βσ1=0 for qσ1=20×10-6,9×10-6, and 0 s-1 from top to bottom. (c) Rising H1 and βσ1=0.1 for the same values of qσ1 as in (a), with runaway case indicated with dot-dashed lines. (d) Falling H1 for βσ1=0.05,0.1,0, from top to bottom. (e) Normalized clearance rate vs. t for the cases in (c), with runaway case indicated with dot-dashed lines. (f) Normalized clearance rate vs. t for the cases in (d); for βσ1=0 this ratio is 1 throughout so it is not shown. Homeostatic rise using two-species drive during wake is shown in (g)–(j). Fast clearance H1 is shown in green, slow clearance H2 in blue, and total H in red. (g) State with β1=β2=0 and H1 and H2 starting from zero. (h) Same as in (g) but β1=0.05 and β2=0.15. (i) Overt runaway state with β1=0.15 and β2=0.15. (j) Covert runaway. (k) Clearance dynamics for two species with β1=0.15 and β2=0.15 in dot dashed line, β1=0.05 and β2=0.15 in solid line, and β1=β2=0 in dashed line. In the covert runaway case qσ1=65×10-6 s-1 and qσ2=30×10-6 s-1; in all other cases qσ1=65×10-6 s-1 and qσ2=7×10⁻⁶ s-1.
Figure 3
Figure 3
One and two species dynamics of H and void blocking fraction for the best-fit parameters in Table 1 for the calibration experiments. One species dynamics for (a) normal sleep; (b) sleep deprivation; and (c) chronic sleep restriction, cycle-averaged and normalized to the baseline days with blue showing sleep deprivation, orange 4 h sleep opportunity, green 6 h, and purple 8 h. Two species dynamics for (d) normal sleep, (e) sleep deprivation, (f) chronic sleep restriction, cycle-averaged and normalized to the baseline days, plotted as in (c). Open symbols show PVT lapse data from Van Dongen et al.’s study. Void blockage fraction for two species: (g) during normal sleep-wake cycles, and (h) during chronic sleep restriction from. Blue, red, green, and purple indicate sleep deprivation, 4, 6, and 8 h sleep opportunity per day, respectively.
Figure 4
Figure 4
Model predictions for CSR protocols that were not used in parameter calibration. (a) Belenky et al. chronic sleep restriction and recovery, averaged across each cycle with two-species parameters from Table 1. Blue indicates 3 h of chronic sleep restriction, red 5 h, green 7 h, and purple 9 h. Filled circles show the experimental data. (b) St. Hilaire et al. chronic variable sleep restriction for two-species parameters from Table 1. Model prediction of H dynamics are shown with solid line. Experimental data are shown with gray circles.
Figure 5
Figure 5
Runaway predictions for the two species. (a)–(e) Demonstrate the case of a sudden change of one parameter at t=100 days, as labeled: (a) η2 is 11.5 times higher than the best-fit value from Table 1, (b) β2 is 11.5 times the best-fit value, (c) ρ=1, (d) fW is increased to 0.83 which indicates 20 h of wakefulness, and (e) τ2 is 11.5 times larger. In each case the dot-dashed line indicates H1, the dashed line H2, and the solid line, the total H. (f) Shows results for a gradual increase of τ2 over time, with an increase by a factor of 11.5 being reached at t=3500 days. (g) Comparison of total H for the conditions in (a)–(e), as labeled; dotted line shows case (f). (h) Corresponding void blockage fraction for the conditions in (a)–(f). All other parameters are set at their best-fit values from 1.

References

    1. Abel JH, Lecamwasam K, St Hilaire MA, Klerman EB. Recent advances in modeling sleep: From the clinic to society and disease. Curr. Opin. Physiol. 2020;15:37–46. doi: 10.1016/j.cophys.2019.12.001. - DOI - PMC - PubMed
    1. Postnova S. Sleep mdelling across physiological levels. Clocks Sleep. 2019;1:166–184. doi: 10.3390/clockssleep1010015. - DOI - PMC - PubMed
    1. McKenna JT, et al. Nocturnal elevation of extracellular adenosine in the rat basal forebrain. Sleep Res. Online. 2003;5:155–160.
    1. Tononi G, Cirelli C. Sleep and synaptic homeostasis: A hypothesis. Brain Res. Bull. 2003;62:143–150. doi: 10.1016/j.brainresbull.2003.09.004. - DOI - PubMed
    1. Fultz NE, et al. Coupled electrophysiological, hemodynamic, and cerebrospinal fluid oscillations in human sleep. Science. 2019;366:628–631. doi: 10.1126/science.aax5440. - DOI - PMC - PubMed

Publication types