

Validation of a tablet-based assessment of auditory sensitivity for researchers
- PMID: 35962308
- PMCID: PMC10228289
- DOI: 10.3758/s13428-022-01933-1
Validation of a tablet-based assessment of auditory sensitivity for researchers
Abstract
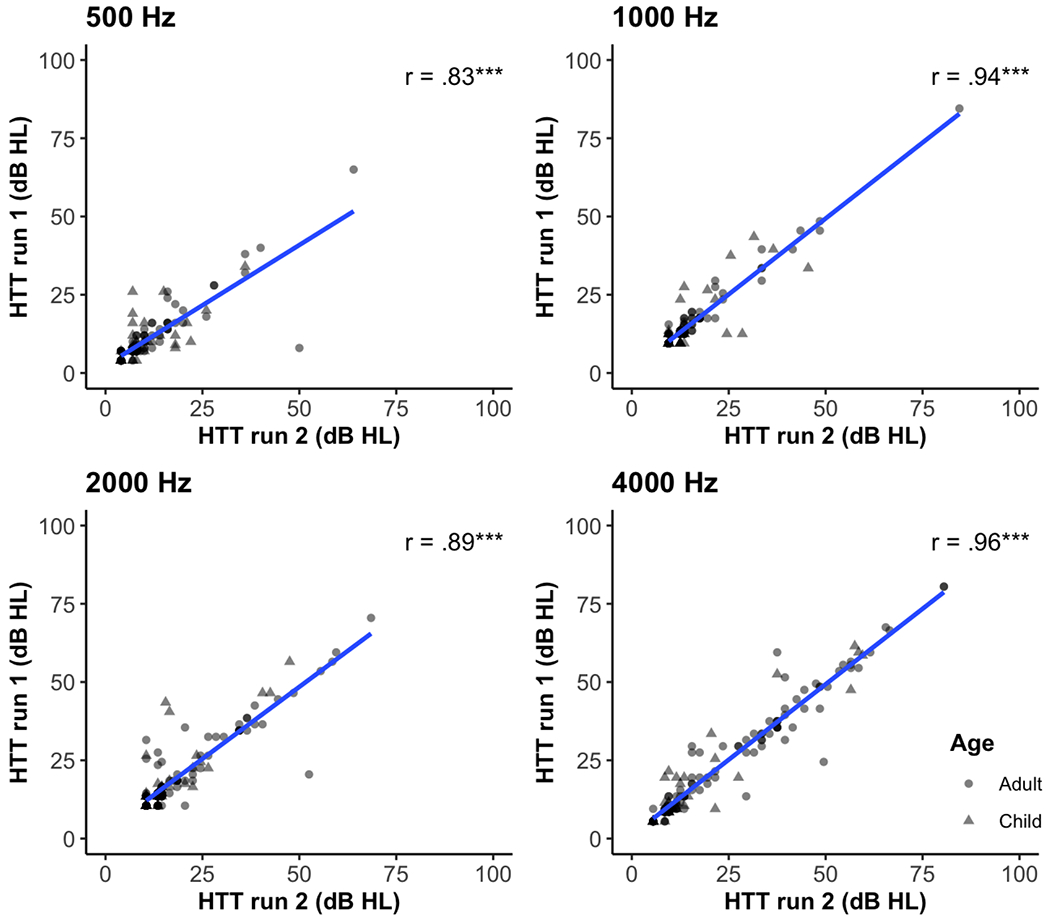
Quantifying hearing acuity is increasingly important across a wide range of research areas in the behavioral and neurosciences. Scientists have relied on either self-reported hearing status or the availability of diagnostic hearing assessment in past studies. There remains a need for a valid and reliable assessment of auditory sensitivity that can provide estimates of the magnitude of hearing loss, if present, without requirements for professional audiologists, facilities, and equipment that are needed to conduct a diagnostic hearing assessment. The goal of this experiment was to validate the NIH Toolbox® Hearing Threshold Test (HTT), a tablet-based hearing assessment available via iPad application that uses consumer-grade headphones, on a clinical sample of children and adults with varying degrees of hearing acuity. Electroacoustic analysis of the hearing assessment application and headphones demonstrated acoustic outputs within established conformity standards for hearing assessment. Twenty-seven children and 63 adults participated in a standard diagnostic hearing assessment and the experimental tablet-based assessment. The results showed that thresholds from the tablet-based assessment were highly correlated with thresholds from the clinical hearing assessment (r = .83-.93) for children and adults for all frequencies and across a range of levels of hearing acuity. The HTT also met clinical test-retest reliability standards (Cronbach's α > .86). The tablet-based hearing assessment provides acceptable estimates of hearing levels for children and adults when diagnostic audiometric assessment capabilities are not available.
Keywords: Adults; Children; Hearing assessment; Hearing loss; NIH Toolbox; Tablet; iPad.
© 2022. The Psychonomic Society, Inc.
Conflict of interest statement
Conflicts of interest: The authors have no conflicts of interest to declare that are relevant to the content of this article.
Figures


References
-
- American National Standards Institute (ANSI). (1997). S3.5-1997 R-1997, American National Standards Methods for the Calculation of the Articulation Index. American National Standards Institute.
-
- American National Standards Institute/Acoustical Society of America. (1999). ANSI/ASA S3. 1-1999 (R2018). Maximum Permissible Ambient Noise Levels for Audiometric Test Rooms. American National Standards Institute.
MeSH terms
Grants and funding
LinkOut - more resources
Full Text Sources
Miscellaneous
