

Image segmentation and separation of spectrally similar dyes in fluorescence microscopy by dynamic mode decomposition of photobleaching kinetics
- PMID: 35962314
- PMCID: PMC9373304
- DOI: 10.1186/s12859-022-04881-x
Image segmentation and separation of spectrally similar dyes in fluorescence microscopy by dynamic mode decomposition of photobleaching kinetics
Abstract
Background: Image segmentation in fluorescence microscopy is often based on spectral separation of fluorescent probes (color-based segmentation) or on significant intensity differences in individual image regions (intensity-based segmentation). These approaches fail, if dye fluorescence shows large spectral overlap with other employed probes or with strong cellular autofluorescence.
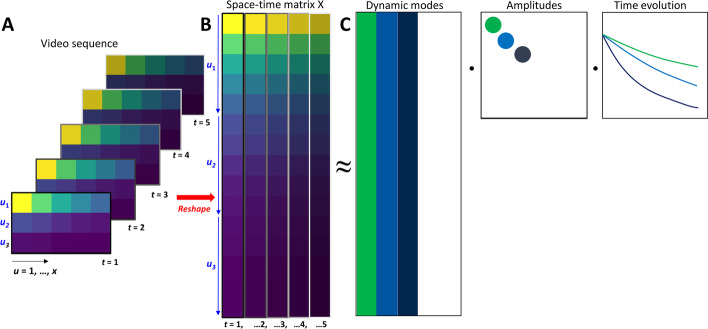
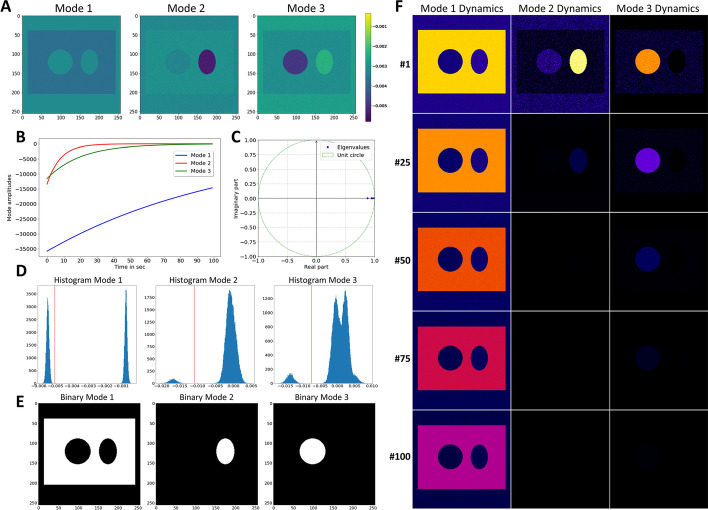
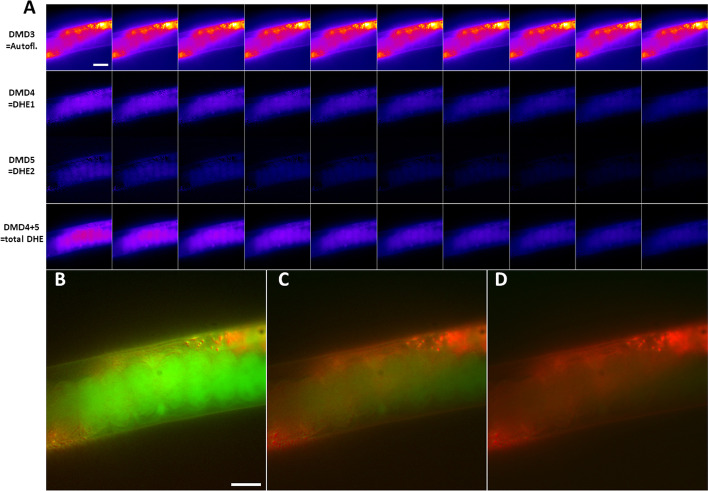
Results: Here, a novel model-free approach is presented which determines bleaching characteristics based on dynamic mode decomposition (DMD) and uses the inferred photobleaching kinetics to distinguish different probes or dye molecules from autofluorescence. DMD is a data-driven computational method for detecting and quantifying dynamic events in complex spatiotemporal data. Here, DMD is first used on synthetic image data and thereafter used to determine photobleaching characteristics of a fluorescent sterol probe, dehydroergosterol (DHE), compared to that of cellular autofluorescence in the nematode Caenorhabditis elegans. It is shown that decomposition of those dynamic modes allows for separating probe from autofluorescence without invoking a particular model for the bleaching process. In a second application, DMD of dye-specific photobleaching is used to separate two green-fluorescent dyes, an NBD-tagged sphingolipid and Alexa488-transferrin, thereby assigning them to different cellular compartments.
Conclusions: Data-based decomposition of dynamic modes can be employed to analyze spatially varying photobleaching of fluorescent probes in cells and tissues for spatial and temporal image segmentation, discrimination of probe from autofluorescence and image denoising. The new method should find wide application in analysis of dynamic fluorescence imaging data.
Keywords: Autofluorescence; Fluorescence; Live-cell microscopy; Matrix methods; Photobleaching; Spatiotemporal modeling.
© 2022. The Author(s).
Conflict of interest statement
I declare that the author has no competing interests as defined by BMC, or other interests that might be perceived to influence the results and/or discussion reported in this paper.
Figures


Similar articles
-
Dynamic Mode Decomposition of Fluorescence Loss in Photobleaching Microscopy Data for Model-Free Analysis of Protein Transport and Aggregation in Living Cells.Sensors (Basel). 2022 Jun 23;22(13):4731. doi: 10.3390/s22134731. Sensors (Basel). 2022. PMID: 35808232 Free PMC article.
-
Dynamic Mode Decomposition of Multiphoton and Stimulated Emission Depletion Microscopy Data for Analysis of Fluorescent Probes in Cellular Membranes.Sensors (Basel). 2024 Mar 25;24(7):2096. doi: 10.3390/s24072096. Sensors (Basel). 2024. PMID: 38610307 Free PMC article.
-
Selective visualization of fluorescent sterols in Caenorhabditis elegans by bleach-rate-based image segmentation.Traffic. 2010 Apr;11(4):440-54. doi: 10.1111/j.1600-0854.2010.01040.x. Epub 2010 Jan 12. Traffic. 2010. PMID: 20070610
-
Bleaching-Resistant Super-Resolution Fluorescence Microscopy.Adv Sci (Weinh). 2022 Mar;9(9):e2101817. doi: 10.1002/advs.202101817. Epub 2022 Jan 27. Adv Sci (Weinh). 2022. PMID: 35088584 Free PMC article. Review.
-
Molecular photobleaching kinetics of Rhodamine 6G by one- and two-photon induced confocal fluorescence microscopy.Chemphyschem. 2005 May;6(5):791-804. doi: 10.1002/cphc.200400509. Chemphyschem. 2005. PMID: 15884061 Review.
Cited by
-
Dynamic mode decomposition for analysis and prediction of metabolic oscillations from time-lapse imaging of cellular autofluorescence.Sci Rep. 2025 Jul 2;15(1):23489. doi: 10.1038/s41598-025-07255-4. Sci Rep. 2025. PMID: 40603986 Free PMC article.
-
Dynamic Mode Decomposition of Fluorescence Loss in Photobleaching Microscopy Data for Model-Free Analysis of Protein Transport and Aggregation in Living Cells.Sensors (Basel). 2022 Jun 23;22(13):4731. doi: 10.3390/s22134731. Sensors (Basel). 2022. PMID: 35808232 Free PMC article.
-
Dynamic Mode Decomposition of Multiphoton and Stimulated Emission Depletion Microscopy Data for Analysis of Fluorescent Probes in Cellular Membranes.Sensors (Basel). 2024 Mar 25;24(7):2096. doi: 10.3390/s24072096. Sensors (Basel). 2024. PMID: 38610307 Free PMC article.
References
-
- Ghauharali RI, van Driel R, Brakenhoff GJ. Structure-oriented fluorescence photobleaching analysis: a method for double fluorescent labeling studies. J Microsc. 1997;185(3):375–384. doi: 10.1046/j.1365-2818.1997.d01-630.x. - DOI
-
- Mörck C, Olsen L, Kurth C, Persson A, Storm NJ, Svensson E, Jansson JO, Hellqvist M, Enejder A, Faergeman NJ, et al. Statins inhibit protein lipidation and induce the unfolded protein response in the non-sterol producing nematode Caenorhabditis elegans. Proc Natl Acad Sci U S A. 2009;106(43):18285–18290. doi: 10.1073/pnas.0907117106. - DOI - PMC - PubMed
MeSH terms
Substances
Grants and funding
LinkOut - more resources
Full Text Sources
