. 2022 Aug 12;14(1):90.
doi: 10.1186/s13073-022-01098-8.

Improved SARS-CoV-2 sequencing surveillance allows the identification of new variants and signatures in infected patients

Affiliations

Improved SARS-CoV-2 sequencing surveillance allows the identification of new variants and signatures in infected patients

Antonio Grimaldi et al. Genome Med. .

Abstract

Background: Genomic surveillance of severe acute respiratory syndrome coronavirus 2 (SARS-CoV-2) is the only approach to rapidly monitor and tackle emerging variants of concern (VOC) of the COVID-19 pandemic. Such scrutiny is crucial to limit the spread of VOC that might escape the immune protection conferred by vaccination strategies or previous virus exposure. It is also becoming clear now that efficient genomic surveillance would require monitoring of the host gene expression to identify prognostic biomarkers of treatment efficacy and disease progression. Here we propose an integrative workflow to both generate thousands of SARS-CoV-2 genome sequences per week and analyze host gene expression upon infection.

Methods: In this study we applied an integrated workflow for RNA extracted from nasal swabs to obtain in parallel the full genome of SARS-CoV-2 and transcriptome of host respiratory epithelium. The RNA extracted from each sample was reverse transcribed and the viral genome was specifically enriched through an amplicon-based approach. The very same RNA was then used for patient transcriptome analysis. Samples were collected in the Campania region, Italy, for viral genome sequencing. Patient transcriptome analysis was performed on about 700 samples divided into two cohorts of patients, depending on the viral variant detected (B.1 or delta).

Results: We sequenced over 20,000 viral genomes since the beginning of the pandemic, producing the highest number of sequences in Italy. We thus reconstructed the pandemic dynamics in the regional territory from March 2020 to December 2021. In addition, we have matured and applied novel proof-of-principle approaches to prioritize possible gain-of-function mutations by leveraging patients' metadata and isolated patient-specific signatures of SARS-CoV-2 infection. This allowed us to (i) identify three new viral variants that specifically originated in the Campania region, (ii) map SARS-CoV-2 intrahost variability during long-term infections and in one case identify an increase in the number of mutations in the viral genome, and (iii) identify host gene expression signatures correlated with viral load in upper respiratory ways.

Conclusion: In conclusion, we have successfully generated an optimized and cost-effective strategy to monitor SARS-CoV-2 genetic variability, without the need of automation. Thus, our approach is suitable for any lab with a benchtop sequencer and a limited budget, allowing an integrated genomic surveillance on premises. Finally, we have also identified a gene expression signature defining SARS-CoV-2 infection in real-world patients' upper respiratory ways.


Conflict of interest statement

Davide Cacchiarelli and Andrea Ballabio are founders, shareholders, and consultants of Next Generation Diagnostic srl. Patrizia Annunziata, Anna Manfredi, Michela Daniele, Chiara Colantuono and Marcello Salvi are employees or consultants at Next Generation Diagnostic srl. The remaining authors declare that they have no competing interests.

Figures
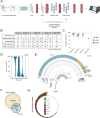
Fig. 1
Fig. 1
A systematic approach allows the generation of large and robust genomic data in a cost-effective manner. A Schematic representation of the workflow set up to collect, process, and analyze a considerable number of viral genomes. Top: Oronasopharyngeal swabs are performed to diagnose the presence of the SARS-CoV-2 genome in patients and extract its RNA. Subsequently, viral RNA is retrotranscribed and subjected to two PCR steps to amplify and index the obtained cDNA. After circularization and nanoball generation, the obtained library is then sequenced and analyzed. Bottom: As an alternative and faster approach, an optimized approach enables the amplification and indexing to occur in one PCR step. B Multiple solutions were tested to optimize the workflow. The table reports the input RNA volume, the amount of reads produced per sample, the number of samples loaded per flowcell, the average time required to process a 96-well plate, and the relative cost per sample. Cost details are reported in Additional file 2: table S1. C Boxplot showing the percentage of samples submitted on the GISAID platform, divided by each tested solution. Only samples with an average Ct value < 33 were considered. D Violin plot showing the distribution of the percentage of SARS-CoV-2 reads detected for different ranges of CTs. n:sample size. E Variant annotation, cumulative frequency, and sequencing coverage of each position of the SARS-CoV-2 genome. F Venn diagram showing the intersection between mutations detected in all the sequenced genomes worldwide (yellow) and the mutations found in this study (light blue). G Representation of all the 156 lineages identified in this study. The length of the bars is indicative of the number of samples for each lineage in the logarithmic scale. Colored bars indicate VOC
Fig. 2
Fig. 2
Characterization of SARS-CoV-2 genome evolution in the south of Italy. A Geographic map representing European States, colored by the number of 2021 months with at least 5% of viral genomes sequenced, compared to new cases. Only for Italy, individual regions are displayed. B Top: geographic map representing Italian regions, colored by the number of genomes deposited on the GISAID platform. Bottom: percentage of genomes deposited on GISAID over the total Italian sequences, divided in Northern (green) and Southern (blue) regions. 28% of the overall Italian sequences have been produced by this study (dark blue). C Geographic distribution in Campania of the genomes analyzed in this study (top) relative to the population density (bottom). D Density plots showing the distribution, in time, of the most frequent variants described in this study (middle) or in Italy (bottom) relative to the Campania infection curve (top) and waves (red-colored areas). Red arrows highlight different variants dynamics between regional and national level, in a certain period of time. E Distribution of the average CT value across different Variants of Concern (VOC). Only not significant (n.s.) pairwise comparisons are reported (Bonferroni adjusted p-value > 0.05)
Fig. 3
Fig. 3
High-Throughput genomic surveillance allows the identification of new SARS-CoV-2 lineages. A Donut chart representing the amount of analyzed genomes presenting the Spike E484K mutation, divided by lineage. The definition of Expected lineage is described in the Methods. B Section of the phylogenetic tree representation of the whole dataset (n=12,998), colored by lineages. The identified lineage is reported (blue dots, left) and zoomed in (right). n:sample size. C Geographic distribution of genomic variants belonging to the identified lineage, colored by the collection date. The size of each pie chart is proportional to the number of samples in each geographic position. n:sample size. D Line plot showing the frequency trend of the selected mutations in time. E Section of the phylogenetic tree representation of the whole dataset (n=12,998), colored by lineages. The identified lineage is reported (arrow, blue dots). n:sample size. F Geographic distribution of genomic variants belonging to the identified lineage, colored by the collection date. The size of each pie chart is proportional to the number of samples in each geographic position. n:sample size. G Genomic characterization of twenty patients with long COVID-19 infection. The number of detected mutations is reported as a function of the number of days from the first swab. The assigned lineage (colors) and consistency (transparency) are also displayed. H Patient 8 genomic characterization relative to the number of detected mutations (colors), the infection load (y-axis), and symptoms severity (+++: severe; ++: moderate)
Fig. 4
Fig. 4
Transcriptional profiling of SARS-CoV-2 infected patients reveals a gene signature correlated with viral load and preserved across different lineages. A Correlation analysis between CTs and gene expression of B.1 patients, performed on 8100 genes, is shown as a barplot. For each gene (x-axis), its correlation value (y-axis) and significance (p-value < 0.0001, red) is reported. Bottom: highlight of the significant results. (161 genes). The top 10 most anti-correlated genes are reported (black box). B Pathway and gene set enrichment analysis performed for different databases using the gene signature previously identified. Each barplot shows the significance (x-axis) and the percentage of overlap (fill color) between the input signature and the tested public genesets. C Heatmap of z-scored, log2-transformed, and normalized gene counts for the 161 significantly correlated genes from A. Values have been averaged in 4 groups of samples depending on the CT (x-axis) or whether they were negative. D Venn diagram of significantly anti-correlated genes between B.1 (161 genes) and Delta (16 genes) variant-infected patients

References

    1. Zhu N, et al. A Novel Coronavirus from Patients with Pneumonia in China, 2019. N Engl J Med. 2020;382:727–733. doi: 10.1056/NEJMoa2001017. - DOI - PMC - PubMed
    1. Baric RS. Emergence of a Highly Fit SARS-CoV-2 Variant. N Engl J Med. 2020;383:2684–2686. doi: 10.1056/NEJMcibr2032888. - DOI - PubMed
    1. Korber B, et al. Tracking Changes in SARS-CoV-2 Spike: Evidence that D614G Increases Infectivity of the COVID-19 Virus. Cell. 2020;182:812–827.e19. doi: 10.1016/j.cell.2020.06.043. - DOI - PMC - PubMed
    1. Rambaut A, et al. A dynamic nomenclature proposal for SARS-CoV-2 lineages to assist genomic epidemiology. Nat Microbiol. 2020;5:1403–1407. doi: 10.1038/s41564-020-0770-5. - DOI - PMC - PubMed
    1. Rambaut A, et al. Preliminary genomic characterisation of an emergent SARS-CoV-2 lineage in the UK defined by a novel set of spike mutations. Virological.org. https://virological.org/t/preliminary-genomic-characterisation-of-an-eme.... Accessed 10 May 2022.

Publication types