. 2022 Aug 13;14(1):87.
doi: 10.1186/s13073-022-01089-9.

Molecular profiling of human non-small cell lung cancer by single-cell RNA-seq

Affiliations

Molecular profiling of human non-small cell lung cancer by single-cell RNA-seq

Qingqing Li et al. Genome Med. .

Abstract

Background: Lung cancer, one of the most common malignant tumors, exhibits high inter- and intra-tumor heterogeneity which contributes significantly to treatment resistance and failure. Single-cell RNA sequencing (scRNA-seq) has been widely used to dissect the cellular composition and characterize the molecular properties of cancer cells and their tumor microenvironment in lung cancer. However, the transcriptomic heterogeneity among various cancer cells in non-small cell lung cancer (NSCLC) warrants further illustration.

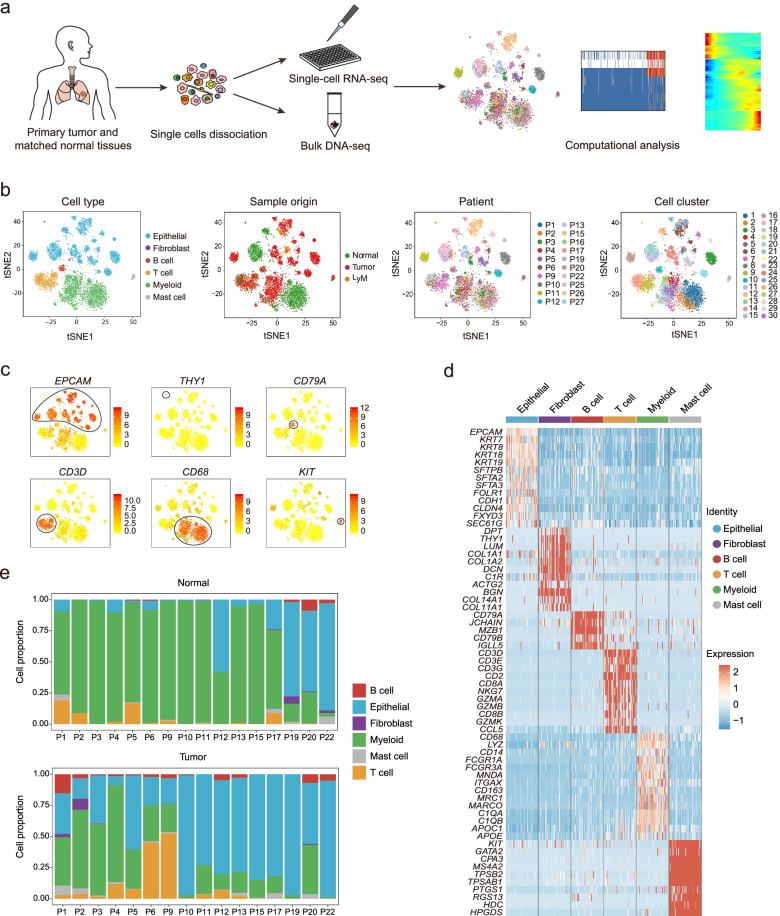
Methods: To comprehensively analyze the molecular heterogeneity of NSCLC, we performed high-precision single-cell RNA-seq analyses on 7364 individual cells from tumor tissues and matched normal tissues from 19 primary lung cancer patients and 1 pulmonary chondroid hamartoma patient.

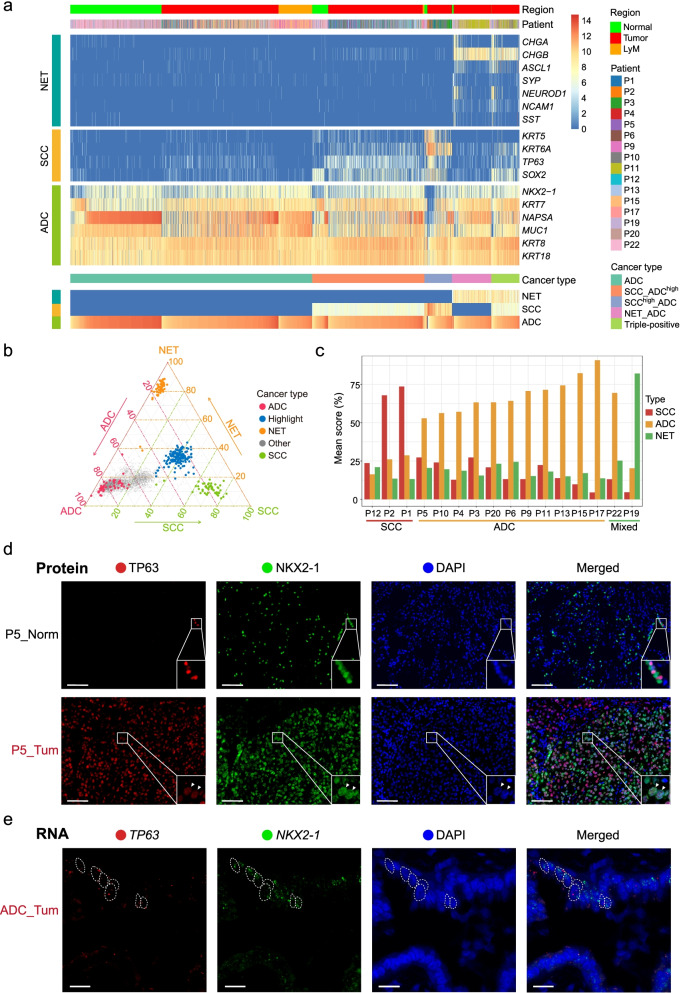
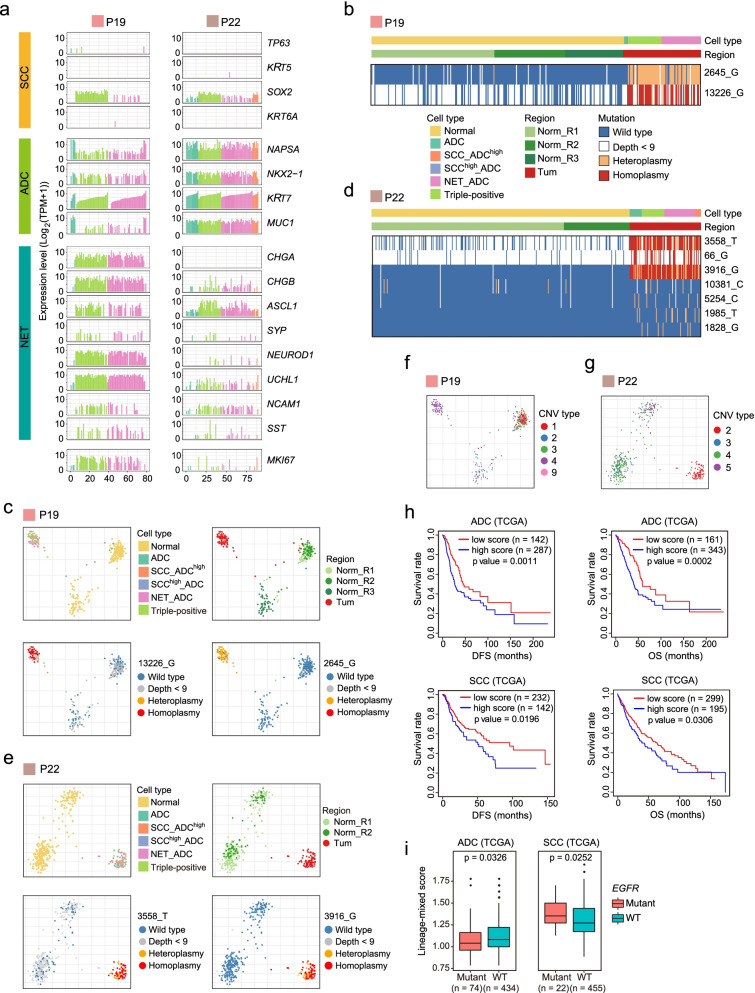
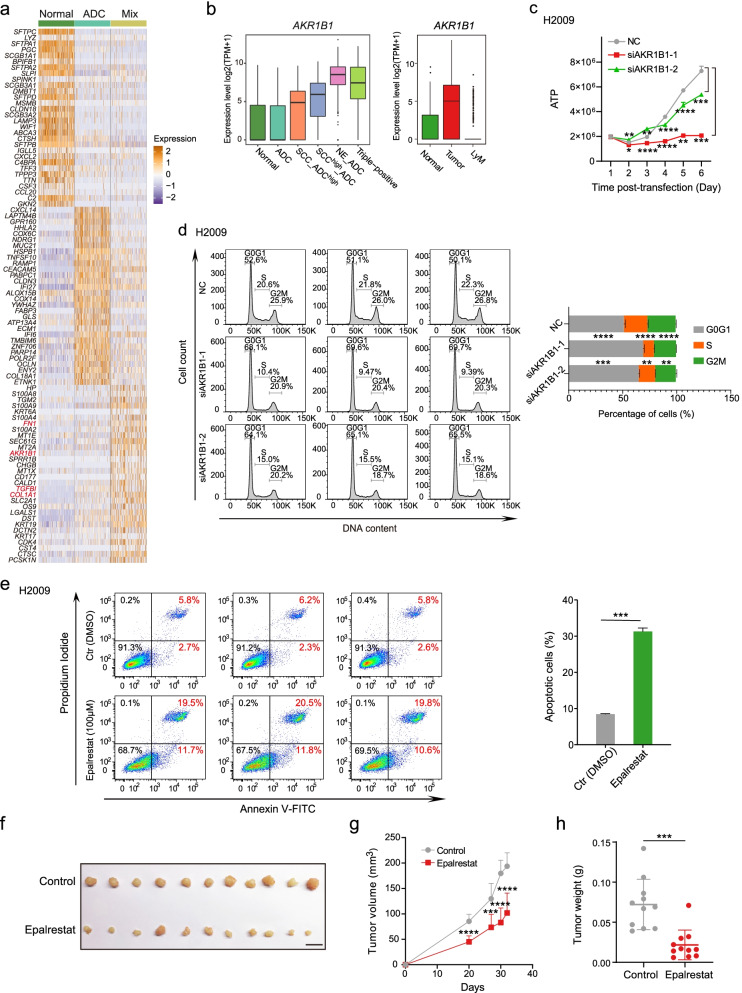
Results: In 6 of 16 patients sequenced, we identified a significant proportion of cancer cells simultaneously expressing classical marker genes for two or even three histologic subtypes of NSCLC-adenocarcinoma (ADC), squamous cell carcinoma (SCC), and neuroendocrine tumor (NET) in the same individual cell, which we defined as mixed-lineage tumor cells; this was verified by both co-immunostaining and RNA in situ hybridization. These data suggest that mixed-lineage tumor cells are highly plastic with mixed features of different types of NSCLC. Both copy number variation (CNV) patterns and mitochondrial mutations clearly showed that the mixed-lineage and single-lineage tumor cells from the same patient had common tumor ancestors rather than different origins. Moreover, we revealed that patients with high mixed-lineage features of different cancer subtypes had worse survival than patients with low mixed-lineage features, indicating that mixed-lineage tumor features were associated with poorer prognosis. In addition, gene signatures specific to mixed-lineage tumor cells were identified, including AKR1B1. Gene knockdown and small molecule inhibition of AKR1B1 can significantly decrease cell proliferation and promote cell apoptosis, suggesting that AKR1B1 plays an important role in tumorigenesis and can serve as a candidate target for tumor therapy of NSCLC patients with mixed-lineage tumor features.

Conclusions: In summary, our work provides novel insights into the tumor heterogeneity of NSCLC in terms of the identification of prevalent mixed-lineage subpopulations of cancer cells with combined signatures of SCC, ADC, and NET and offers clues for potential treatment strategies in these patients.

Keywords: Mixed-lineage cancer cells; Non-small cell lung cancer; Single-cell RNA sequencing; Tumor heterogeneity.


Conflict of interest statement

The authors declare that they have no competing interests.

Figures

Fig. 1
Fig. 1
Single-cell transcriptome atlas of primary lung cancer. a Schematic diagram showing the experimental workflow of this study. Primary lung tumor tissues and matched normal tissues were collected from 19 primary lung cancer patients as well as 1 pulmonary chondroid patient who underwent surgery. After we got the freshly resected tumor tissues and matched normal tissues, we dissociated the tissues into single-cell suspension and rapidly picked the single cell into cell lysis buffer for single-cell RNA-seq analysis. b t-SNE plot of 7364 high-quality single cells showing the cell type identification, sample regions (LyM represents lymph node metastasis), patient information, and cell cluster information. c Expression levels of canonical cell type markers across 7364 single cells. d Heatmap showing the expression of specific cell type markers in six major cell types. e Proportions of identified six major cell types in normal tissues and tumor tissues separately across patients
Fig. 2
Fig. 2
Different lineage markers are co-expressed in the same individual tumor cells. a Heatmap showing the unsupervised hierarchical clustering of 3373 normal and tumor epithelial cells from 16 patients with the expression levels of NET, SCC, and ADC classical lineage markers. b Lineage score analysis further confirmed our cancer type identification. The ggtern plot displayed the cancer type score for each individual cell based on the expression levels of these cancer subtype lineage markers of SCC, ADC, and NET. “Highlight” cells represented cells from patient P12 with higher mixed features of ADC, SCC, and NEC. “Other” cells referred to the remaining cells except for ADC cells, NET cells, SCC cells, and “highlight” cells. c Barplot showing the component score for SCC, ADC, and NET cancer subtypes across every patient. d Multiplex fluorescent IHC staining of cells from patient P5 with p63 (TP63, SCC marker) and TTF1 (NKX2-1, ADC marker). Arrows indicated the double-positive cancer cells. Scale bar, 100 μm. e RNA in situ hybridization for TP63 and NKX2-1 in primary ADC tissues. Scale bar, 100 μm
Fig. 3
Fig. 3
Mixed-lineage and single-lineage tumor cells in the same patient originate from common tumor ancestor cells. a Line plots showing the gene expression levels of clinical lineage-specific markers for single tumor cells from P19 and P22. b Heatmap showing the identified mitochondria mutations specific to tumor epithelial cells from P19. c PCA plot of single cells from P19, colored by redefined cell type, sample regions, and selected mitochondrial mutations. d Heatmap showing identified mitochondria mutations specific to tumor epithelial cells from P22. e PCA plot of single cells from P22, colored by cancer type, sample regions, and selected mitochondrial mutations. f PCA profiles of single cells from P19, colored by CNV clusters inferred by single-cell RNA-seq data. Only the cells with a corresponding CNV subtype with more than 10 cells were used for PCA analysis. g PCA profiles of single cells from P22, colored by CNV clusters inferred by single-cell RNA-seq data. Only the cells with a corresponding CNV subtype with more than 10 cells were used for PCA analysis. h Survival analysis of disease-free survival (DFS) and overall survival (OS) in ADC and SCC samples from TCGA. Mixed-lineage features were calculated based on the expression levels of the identified lineage marker genes for ADC, SCC, and NET. Samples with high scores and low scores represent high lineage-mixing features and low lineage-mixing features, respectively. i Mixed-lineage features evaluation for EGFR mutant samples and wild-type samples in ADC and SCC samples from TCGA, respectively. Mixed-lineage features were calculated based on the expression levels of the identified lineage marker genes for ADC, SCC, and NET. The higher the score indicates the higher lineage-mixed features
Fig. 4
Fig. 4
AKR1B1 is essential for the proliferation of lung tumor cells. a Heatmap showing differentially expressed genes among normal epithelial cells, ADC-based single-lineage tumor cells, and combined four mixed-lineage tumor cells. b Box plot in the left shows the single-cell gene expression level of AKR1B1 in normal epithelial cells and five cancer cell subtypes. Box plot in right shows the single-cell gene expression levels of AKR1B1 in epithelial cells from normal tissues, tumor tissues, and LyM tissues. LyM represents lymph node metastasis. c Proliferation analysis of H2009 cells after AKR1B1 was knockdown with two different siRNAs. Compared with non-targeting control (NC), siAKR1B1-1 and siAKR1B1-2 significantly reduced the proliferation of H2009 cells. *p < 0.05; **p < 0.01; ***p < 0.001; ****p < 0.0001. p values were determined by t-test. d Cell cycle analysis after H2009 cells were transfected with two different siRNAs of AKR1B1 for 48 h. Compared with NC, both siAKR1B1-1 and siAKR1B1-2 significantly decreased the cell fractions of S and G2/M phases of the cell cycle. *p < 0.05; **p < 0.01; ***p < 0.001; ****p < 0.0001. p values were determined by t-test. e Cell apoptosis analysis after H2009 cells were treated with DMSO or 100 μM epalrestat for 48 h. Epalrestat treatment significantly promoted the apoptosis of H2009 cells. ****p < 0.001. p values were determined by t-test. f Photograph of tumors treated with sterile water or epalrestat 36 days after injection. These 11 tumors in the control group were derived from 7 mice, and these tumors in the treatment group were derived from 6 mice. Scale bar, 10 mm. g Quantitation of tumor volumes. The tumor volumes were calculated by the following formula: volume = length × (width)2 × 0.5. The maximum and minimum detected in each time point were removed. ***p < 0.001; ****p < 0.0001. p values were determined by t-test. h Quantitation of tumor weight from tumors in f. Epalrestat treatment significantly inhibited tumor growth. ***p < 0.001. p values were determined by t-test

References

    1. Bray F, Ferlay J, Soerjomataram I, Siegel RL, Torre LA, Jemal A. Global cancer statistics 2018: GLOBOCAN estimates of incidence and mortality worldwide for 36 cancers in 185 countries. CA Cancer J Clin. 2018;68:394–424. - PubMed
    1. Herbst RS, Heymach JV, Lippman SM. Lung cancer. N Engl J Med. 2008;359:1367–1380. doi: 10.1056/NEJMra0802714. - DOI - PMC - PubMed
    1. Cancer Genome Atlas Research N Comprehensive molecular profiling of lung adenocarcinoma. Nature. 2014;511:543–550. doi: 10.1038/nature13385. - DOI - PMC - PubMed
    1. Jamal-Hanjani M, Wilson GA, McGranahan N, Birkbak NJ, Watkins TBK, Veeriah S, Shafi S, Johnson DH, Mitter R, Rosenthal R, et al. Tracking the evolution of non-small-cell lung cancer. N Engl J Med. 2017;376:2109–2121. doi: 10.1056/NEJMoa1616288. - DOI - PubMed
    1. Whithaus K, Fukuoka J, Prihoda TJ, Jagirdar J. Evaluation of napsin A, cytokeratin 5/6, p63, and thyroid transcription factor 1 in adenocarcinoma versus squamous cell carcinoma of the lung. Arch Pathol Lab Med. 2012;136:155–162. doi: 10.5858/arpa.2011-0232-OA. - DOI - PubMed

Publication types