. 2022 Aug 12;13(1):90.
doi: 10.1186/s40104-022-00737-9.

Lactobacillus rhamnosus GG ameliorates DON-induced intestinal damage depending on the enrichment of beneficial bacteria in weaned piglets

Affiliations

Lactobacillus rhamnosus GG ameliorates DON-induced intestinal damage depending on the enrichment of beneficial bacteria in weaned piglets

Yongsong Bai et al. J Anim Sci Biotechnol. .

Abstract

Background: Deoxynivalenol (DON) is one of the most common environmental pollutants that induces intestinal inflammation and microbiota dysbiosis. Lactobacillus rhamnosus GG (LGG) is a probiotic that not only has anti-inflammatory effects, but also shows protective effect on the intestinal barrier. However, it is still unknown whether LGG exerts beneficial effects against DON-induced intestinal damage in piglets. In this work, a total of 36 weaned piglets were randomized to one of four treatment groups for 21 d. The treatment groups were CON (basal diet); LGG (basal diet supplemented with 1.77 × 10¹¹ CFU/kg LGG); DON (DON-contaminated diet) and LGG + DON (DON-contaminated diet supplemented with 1.77 × 10¹¹ CFU/kg LGG).

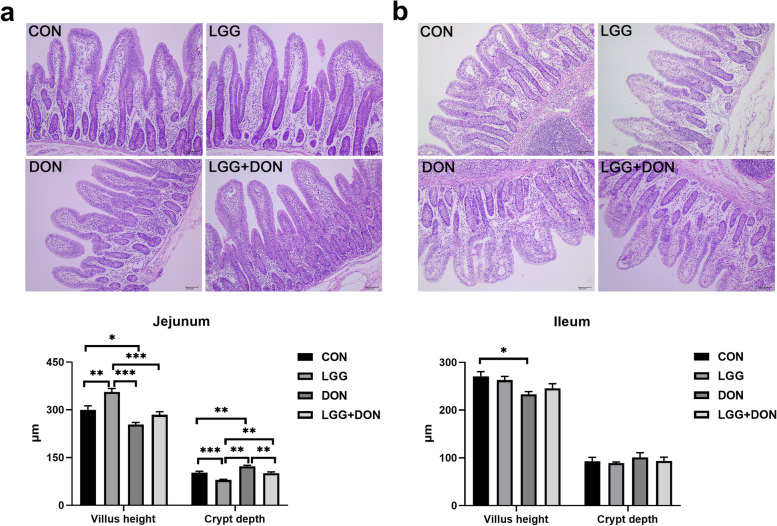
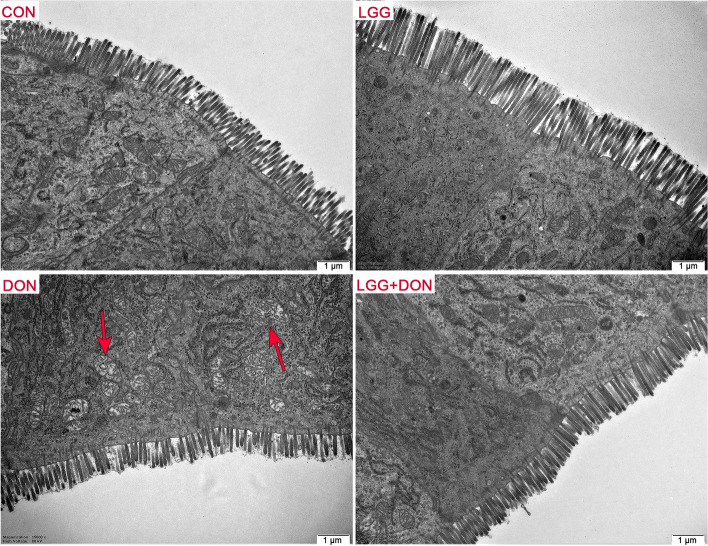
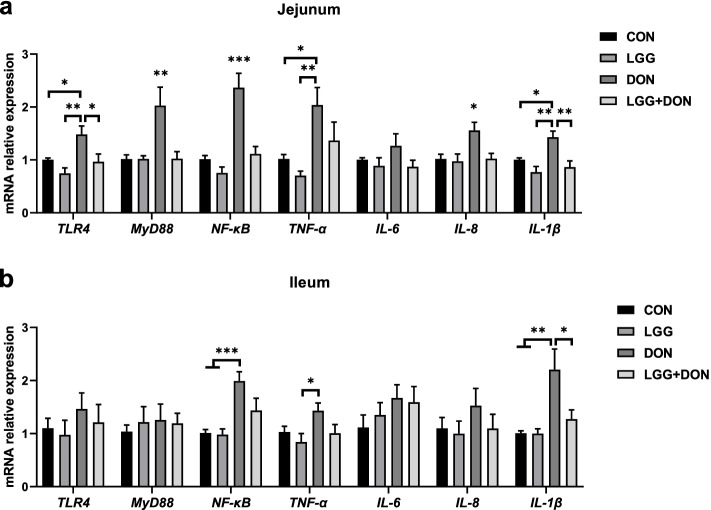
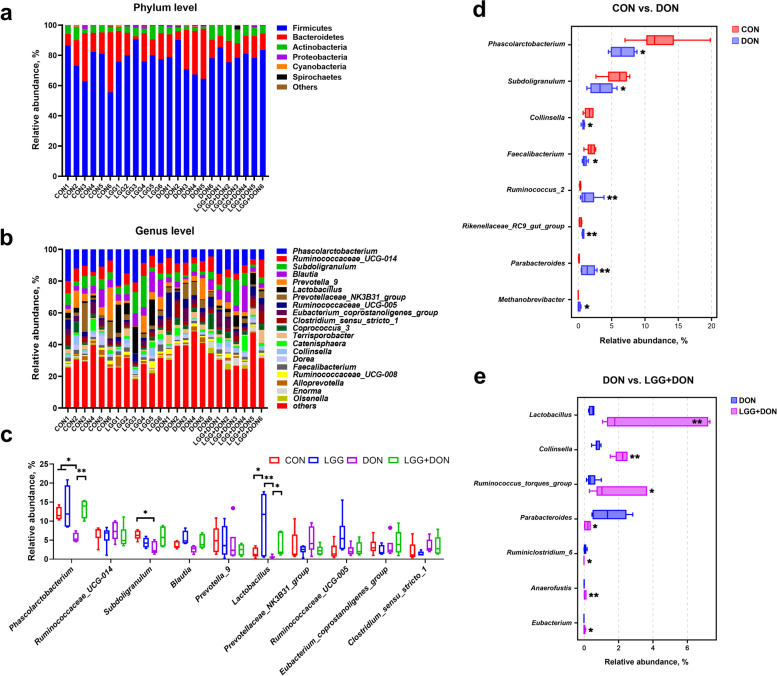
Result: Supplementation of LGG can enhance growth performance of piglets exposed to DON by improving intestinal barrier function. LGG has a mitigating effect on intestinal inflammation induced by DON exposure, largely through repression of the TLR4/NF-κB signaling pathway. Furthermore, supplementation of LGG increased the relative abundances of beneficial bacteria (e.g., Collinsella, Lactobacillus, Ruminococcus_torques_group and Anaerofustis), and decreased the relative abundances of harmful bacteria (e.g., Parabacteroides and Ruminiclostridium_6), and also promoted the production of SCFAs.

Conclusions: LGG ameliorates DON-induced intestinal damage, which may provide theoretical support for the application of LGG to alleviate the adverse effects induced by DON exposure.

Keywords: Deoxynivalenol; Gut microbiota; Intestinal inflammation; Lactobacillus rhamnosus GG; Piglets.


Conflict of interest statement

The authors declare that they have no conflicts of interest.

Figures

Fig. 1
Fig. 1
Effect of LGG on growth performance of weaned piglets exposed to DON. a Body weight, b Average daily gain (ADG), c Average daily feed intake (ADFI), and d Diarrhea rate from different groups were calculated (n = 9). CON, basal diet; LGG, basal diet supplemented with 1.77 × 10¹¹ CFU/kg LGG; DON, DON-contaminated diet containing 3.11 mg/kg DON; and LGG + DON, DON-contaminated diet containing 3.11 mg/kg DON and 1.77 × 10¹¹ CFU/kg LGG. Data are mean ± SEM. “*” means P < 0.05, “**” means P < 0.01, “***” means P < 0.001
Fig. 2
Fig. 2
Effect of LGG on jejunum and ileum morphology of weaned piglets exposed to DON. a Representative images of hematoxylin and eosin-stained of jejunum and ileum sections (n = 6). Scale bar = 200 μm. b Villus height and crypt depth in the jejunum and ileum of piglets from different groups were quantified (n = 6). CON, basal diet; LGG, basal diet supplemented with 1.77 × 10¹¹ CFU/kg LGG; DON, DON-contaminated diet containing 3.11 mg/kg DON; and LGG + DON, DON-contaminated diet containing 3.11 mg/kg DON and 1.77 × 10¹¹ CFU/kg LGG. Data are mean ± SEM. “*” means P < 0.05, “**” means P < 0.01, “***” means P < 0.001
Fig. 3
Fig. 3
Effect of LGG on the ultrastructure of jejunum in weaned piglets exposed to DON. Representative TEM pictures of jejunum in four groups (magnification ×15,000). Red arrows, mitochondria swelling. CON, basal diet; LGG, basal diet supplemented with 1.77 × 10¹¹ CFU/kg LGG; DON, DON-contaminated diet containing 3.11 mg/kg DON; and LGG + DON, DON-contaminated diet containing 3.11 mg/kg DON and 1.77 × 10¹¹ CFU/kg LGG. Data are mean ± SEM. “*” means P < 0.05, “**” means P < 0.01, “***” means P < 0.001
Fig. 4
Fig. 4
Effect of LGG on activities of plasma DAO and D-lactate of weaned piglets exposed to DON. a DAO activity, and b D-lactate level in the plasma of piglets (n = 6). CON, basal diet; LGG, basal diet supplemented with 1.77 × 10¹¹ CFU/kg LGG; DON, DON-contaminated diet containing 3.11 mg/kg DON; and LGG + DON, DON-contaminated diet containing 3.11 mg/kg DON and 1.77 × 10¹¹ CFU/kg LGG. Data are mean ± SEM. “*” means P < 0.05, “**” means P < 0.01, “***” means P < 0.001
Fig. 5
Fig. 5
Effect of LGG on goblet cells and MUC2 of weaned piglets exposed to DON. a Representative images of periodic acid-schiff (PAS) staining (magnification × 100, scale bar 100 μm) of ileum sections and the number of goblet cells in ileum (n = 6). b Representative images of immunohistochemical staining of MUC2 (green) and nuclei (blue) (magnification ×100, scale bar 100 μm) and mean gray value of MUC2 in different groups (n = 6). CON, basal diet; LGG, basal diet supplemented with 1.77 × 10¹¹ CFU/kg LGG; DON, DON-contaminated diet containing 3.11 mg/kg DON; and LGG + DON, DON-contaminated diet containing 3.11 mg/kg DON and 1.77 × 10¹¹ CFU/kg LGG. Data are mean ± SEM. “*” means P < 0.05, “**” means P < 0.01, “***” means P < 0.001
Fig. 6
Fig. 6
Effect of LGG on the expression of genes related to tight junctions and mucins in the jejunum and ileum of weaned piglets exposed to DON. a, b Relative mRNA expression levels of ZO-1, occludin, Claudin-4, Claudin-1, JAM-A, MUC1 and MUC2 in the jejunum and ileum assessed by real-time PCR (n = 8). β-actin was used as an internal control. CON, basal diet; LGG, basal diet supplemented with 1.77 × 10¹¹ CFU/kg LGG; DON, DON-contaminated diet containing 3.11 mg/kg DON; and LGG + DON, DON-contaminated diet containing 3.11 mg/kg DON and 1.77 × 10¹¹ CFU/kg LGG. Data are mean ± SEM. “*” means P < 0.05, “**” means P < 0.01, “***” means P < 0.001
Fig. 7
Fig. 7
Effect of LGG on the expression of related genes in TLR4/NF-κB signaling pathway in the jejunum and ileum of weaned piglets exposed to DON. a, b Relative mRNA expression levels of TLR4, MyD88, NF-κB, TNF-α, IL-6, IL-8 and IL-1β in the jejunum and ileum assessed by real-time PCR (n = 8). β-actin was used as an internal control. CON, basal diet; LGG, basal diet supplemented with 1.77 × 10¹¹ CFU/kg LGG; DON, DON-contaminated diet containing 3.11 mg/kg DON; and LGG + DON, DON-contaminated diet containing 3.11 mg/kg DON and 1.77 × 10¹¹ CFU/kg LGG. Data are mean ± SEM. “*” means P < 0.05, “**” means P < 0.01, “***” means P < 0.001
Fig. 8
Fig. 8
Effect of LGG on the relative protein expression of TLR4 and p-NF-κB p65 in the jejunum of weaned piglets exposed to DON. β-actin was used as an internal control. CON, basal diet (A1, A2, A3); LGG, basal diet supplemented with 1.77 × 10¹¹ CFU/kg LGG (B1, B2, B3); DON, DON-contaminated diet containing 3.11 mg/kg DON (C1, C2, C3); and LGG + DON, DON-contaminated diet containing 3.11 mg/kg DON and 1.77 × 10¹¹ CFU/kg LGG (D1, D2, D3). Data are mean ± SEM
Fig. 9
Fig. 9
Effect of LGG on α and β diversity of cecal contents in weaned piglets exposed to DON. a Principal coordinate analysis (PCoA) plot of the cecal microbiota composition at the operational taxonomic unit (OTU) level from different groups. Points with different colors represent the centroid of each group. The closer the points, the more similar the gut microbiota structure. b The significant differences between groups were calculated by analysis of similarity (ANOSIM) analysis. The vertical axis of the box plot represents the distance ranking, the horizontal axis between represents the distance between groups, and the other represents the distance within the corresponding group. The R value indicates the degree of difference between and within groups. P value indicates the significance of differences between and within groups. c-f Diversity and richness indexes of cecal microbiota in each group. CON, basal diet; LGG, basal diet supplemented with 1.77 × 10¹¹ CFU/kg LGG; DON, DON-contaminated diet containing 3.11 mg/kg DON; and LGG + DON, DON-contaminated diet containing 3.11 mg/kg DON and 1.77 × 10¹¹ CFU/kg LGG. Data are mean ± SEM, n = 6. “*” means P < 0.05, “**” means P < 0.01, “***” means P < 0.001
Fig. 10
Fig. 10
Effect of LGG on cecal microbiota composition of weaned piglets exposed to DON. a Relative abundance of cecal microbiota at the phylum levels. b Relative abundance of cecal microbiota at the genus levels. c Relative abundance of cecal microbiota at the genus level (top 10) in the different groups. d, e Relative abundance of cecal microbiota with significant differences of the comparison groups CON vs. DON and DON vs. LGG + DON at the genus levels. CON, basal diet; LGG, basal diet supplemented with 1.77 × 10¹¹ CFU/kg LGG; DON, DON-contaminated diet containing 3.11 mg/kg DON; and LGG + DON, DON-contaminated diet containing 3.11 mg/kg DON and 1.77 × 10¹¹ CFU/kg LGG. Data are mean ± SEM, n = 6. “*” means P < 0.05, “**” means P < 0.01, “***” means P < 0.001
Fig. 11
Fig. 11
Effect of LGG on the cecal short-chain fatty acids (SCFAs) of weaned piglets exposed to DON. a Acetate, b Propionate, c Butyrate, d Valerate, e Isobutyrate, f Isovalerate, g SCFAs, and h BCFAs was quantified (n = 8). CON, basal diet; LGG, basal diet supplemented with 1.77 × 10¹¹ CFU/kg LGG; DON, DON-contaminated diet containing 3.11 mg/kg DON; and LGG + DON, DON-contaminated diet containing 3.11 mg/kg DON and 1.77 × 10¹¹ CFU/kg LGG. Data are mean ± SEM. “*” means P < 0.05, “**” means P < 0.01, “***” means P < 0.001

References

    1. Yang X, Gao J, Liu Q, Yang D. Co-occurrence of mycotoxins in maize and maize-derived food in China and estimation of dietary intake. Food Addit Contam B. 2019;12(2):124–134. doi: 10.1080/19393210.2019.1570976. - DOI - PubMed
    1. Kolawole O, Meneely J, Greer B, Chevallier O, Jones DS, Connolly L, et al. Comparative in vitro assessment of a range of commercial feed additives with multiple mycotoxin binding claims. Toxins (Basel). 2019;11(11):659. doi: 10.3390/toxins11110659. - DOI - PMC - PubMed
    1. Yang C, Song G, Lim W. Effects of mycotoxin-contaminated feed on farm animals. J Hazard Mater. 2020;389:122087. doi: 10.1016/j.jhazmat.2020.122087. - DOI - PubMed
    1. Robert H, Payros D, Pinton P, Theodorou V, Mercier-Bonin M, Oswald IP. Impact of mycotoxins on the intestine: Are mucus and microbiota new targets? J Toxicol Environ Health B Crit Rev. 2017;20(5):249–275. doi: 10.1080/10937404.2017.1326071. - DOI - PubMed
    1. Chen L, Peng Z, Nussler AK, Liu L, Yang W. Current and prospective sights in mechanism of deoxynivalenol-induced emesis for future scientific study and clinical treatment. J Appl Toxicol. 2017;37(7):784–791. doi: 10.1002/jat.3433. - DOI - PubMed

LinkOut - more resources