. 2022 Oct;112(1):268-283.
doi: 10.1111/tpj.15943. Epub 2022 Aug 23.

Parallel analysis of RNA ends reveals global microRNA-mediated target RNA cleavage in maize

Affiliations

Parallel analysis of RNA ends reveals global microRNA-mediated target RNA cleavage in maize

Juan He et al. Plant J. 2022 Oct.

Abstract

MicroRNAs (miRNAs) are endogenous 20-24-nucleotide non-coding RNAs that play important regulatory roles in many biological processes in eukaryotes. miRNAs modulate the expression of target genes at the post-transcriptional level by transcript cleavage or translational inhibition. The identification of miRNA target genes has been extensively investigated in Arabidopsis and rice, but an in-depth global analysis of miRNA-mediated target regulation is still lacking in maize. Here, we report a transcriptome-wide identification of miRNA targets by analyzing parallel analysis of RNA ends (PARE) datasets derived from nine different tissues at five developmental stages of the maize (Zea mays L.) B73 cultivar. In total, 246 targets corresponding to 60 miRNAs from 25 families were identified, including transcription factors and other genes. In addition, PARE analysis revealed that miRNAs guide specific target transcript cleavage in a tissue-preferential manner. Primary transcripts of MIR159c and MIR169e were found to be cleaved by mature miR159 and miR169, respectively, indicating a negative-feedback regulatory mechanism in miRNA biogenesis. Moreover, several miRNA-target gene pairs involved in seed germination were identified and experimentally validated. Our PARE analyses generated a wide and detailed miRNA-target interaction atlas, which provides a valuable resource for investigating the roles of miRNAs and their targets in maize.

Keywords: PARE; genome-wide; maize; miRNA; targets.


Conflict of interest statement

The authors declare no conflict of interest.

Figures
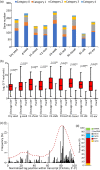
Figure 1
Figure 1
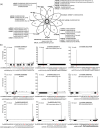
Identification of target genes of maize miRNAs by PARE sequencing. (a) Gene numbers of target genes belonging to category 0–4 in different maize tissues. g‐seed, germinating seed; V1, vegetative stage 1; V3, vegetative stage 3; R1, reproductive stage 1. (b) Accumulation of 5′‐P read ends at miRNA target sites. Flank, the 100‐nucleotide flanking region of the cleavage site. (c) Histogram displaying the 5′‐P position of degradome tags of miRNA target genes relative to normalized transcript position. Tags were counted in 1% bins. (d) Proportion of miRNA cleavage sites in the genome. [Colour figure can be viewed at wileyonlinelibrary.com]
Figure 2
Figure 2
Summary of miRNA target genes identified by PARE‐seq in different maize tissues. (a) Venn diagrams for identified target genes of maize miRNAs by PARE‐seq. V1, vegetative stage 1; V3, vegetative stage 3; R1, reproductive stage 1; g‐seed, germinating seed. (b) T‐plots and alignment of the common target genes of miRNAs identified in all maize tissues of analyzed. The red nucleotides indicate the 5′‐P ends for the residues miRNA target genes detected in the PARE analysis and the respective arrowheads show the cleavage sites. In the gene model, the white boxes illustrate the untranslated regions (UTRs), the black boxes show the coding regions (CDS) and the black lines indicate the introns of the genes. [Colour figure can be viewed at wileyonlinelibrary.com]
Figure 3
Figure 3
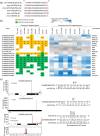
Tissue‐specific targeting of miR159 and miR319 in different tissues of maize. (a) Sequences alignment of maize miR159 and miR319. The different nucleotides between sequences are shown in red. (b) Target genes of miR159 and miR319 across nine different tissues in maize. The diagram on the left shows the targeting patterns of miR159 and miR319 in different tissues. Numbers in the colored boxes indicate to which categories the relevant target genes belong. The diagram on the right illustrates the expression patterns of those target genes. g‐seed, germinating seed; V1, vegetative stage 1; V3, vegetative stage 3; R1, reproductive stage 1. (c) Target plots (T‐plot) and 5′‐RACE verification of representative targets of miR159 and miR319 in maize. The red and blue nucleotides indicate the 5′‐P ends for the residues of miR319 and miR159 target genes detected in the PARE analysis, respectively. The respective arrowheads or arrows show the cleavage sites. The numbers above the alignments indicate the data from 5′‐RACE confirmation. In the gene model, the white boxes illustrate the UTRs, the black boxes show the CDS and the black lines indicate the introns of the genes. [Colour figure can be viewed at wileyonlinelibrary.com]
Figure 4
Figure 4
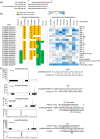
miR156 and miR529 have distinct subsets of targets in different maize tissues. (a) Sequence alignment of maize miR156 and miR529. The different nucleotides between sequences are shown in red. (b) Target genes of miR156 and miR529 in different maize tissues. The diagram on the left shows the targeting patterns of miR156 and miR529 in different tissues. Numbers in the colored boxes indicate to which categories the relevant target genes belong. The diagram on the right illustrates the expression patterns for those target genes. g‐seed, germinating seed; V1, vegetative stage 1; V3, vegetative stage 3; R1, reproductive stage 1. (c) Target plots (T‐plot) and 5′‐RACE verification of representative targets of miR156 and miR529 in maize. The red and blue nucleotides indicate the 5′‐P ends for the residues of miR529 or miR156 target genes detected in the PARE analysis, respectively. The respective arrowheads or arrows show the cleavage sites. In the gene model, the white boxes illustrate the UTRs, the black boxes show the CDS and the black lines indicate the introns of the genes. [Colour figure can be viewed at wileyonlinelibrary.com]
Figure 5
Figure 5
miRNAs primary transcripts can be targeted by their own mature miRNAs. (a) pri‐miR159c has dominant signatures corresponding to mature miR159a/b/f/j/k at position 10. The mature miRNAs are underlined and miRNA*s are in red. g‐seed, germinating seed; V1, vegetative stage 1; V3, vegetative stage 3; R1, reproductive stage 1. (b) pri‐miR169e has dominant signatures corresponding to mature miR169m/n/q at position 10. (c) Validation of miR159/miR169‐guided cleavage of pri‐miR159c/pri‐miR169e by conventional 5′‐RACE. The red arrows indicate the cleavage sites and the nucleotides indicate the 5′‐P end for the residue of target genes. The numbers above the alignments indicate the data from 5′‐RACE confirmation. [Colour figure can be viewed at wileyonlinelibrary.com]
Figure 6
Figure 6
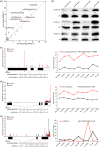
Targets of miRNAs involved in seed germination. (a) miRNAs differentially expressed during seed germination. Red dots indicate miRNAs upregulated during germination. (b) Validation of differential expression of miRNAs by Northern blotting. Two biological replicates were conducted for each blot. U6 served as a loading control. Numbers below the blots indicate the abundance of the miRNAs relative to the dry seed control. (c–e) The target plots (T‐plots) of miR159 (c), miR166 (d) and miR529 (e) target genes show the abundances of PARE tags along the full length of the target mRNA sequences. The alignments show the miRNA with a portion of its target sequence. The red nucleotides indicate the 5′‐P ends for the residues of target genes detected in the PARE analysis. The arrowheads or arrows show the cleavage sites. The line charts show the expression patterns of miRNA and target genes in different maize tissues. The y‐axis indicates RPM (reads per million mapped reads) for miRNAs and RPKM (reads per kilobase per million mapped reads) for genes. g‐seed: germinating seed. V1, vegetative stage 1; V3, vegetative stage 3; R1, reproductive stage 1. [Colour figure can be viewed at wileyonlinelibrary.com]
Figure 7
Figure 7
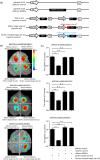
Dual‐luciferase transient expression assay in tobacco leaves. (a) Schematic diagrams indicating the constructs used in the dual‐luciferase transient expression assays. (b) Tobacco leaves co‐transformed with different combinations of miRNA and target genes. (c) Luciferase activity in the transient expression assays shown in b. Values are presented as the mean ± SD (n = 3). ***P < 0.001; N.S., not significant. [Colour figure can be viewed at wileyonlinelibrary.com]

Similar articles

Cited by

References

    1. Addo‐Quaye, C. , Miller, W. & Axtell, M. (2009) CleaveLand: a pipeline for using degradome data to find cleaved small RNA targets. Bioinformatics, 25, 130–131. - PMC - PubMed
    1. Addo‐Quaye, C. , Eshoo, T. , Bartel, D.P. & Axtell, M.J. (2008) Endogenous siRNA and miRNA targets identified by sequencing of the Arabidopsis degradome. Current Biology, 18(10), 758–762. - PMC - PubMed
    1. Axtell, M. (2013) Classification and comparison of small RNAs from plants. Annual Review of Plant Biology, 64, 137–159. - PubMed
    1. Brian, D.G. , Ronan, C.O. , Ryan, L. , Mark, A. , Julian, T.F. , Chen, H. et al. (2008) A link between RNA metabolism and silencing affecting Arabidopsis development. Developmental Cell, 14(6), 854–866. - PubMed
    1. Brousse, C. , Liu, Q. , Beauclair, L. , Deremetz, A. , Axtell, M.J. & Bouche, N. (2014) A non‐canonical plant microRNA target site. Nucleic Acids Research, 42(8), 5270–5279. - PMC - PubMed

Publication types