. 2023 Feb;237(3):1024-1039.
doi: 10.1111/nph.18428. Epub 2022 Sep 3.

Autopolyploid inheritance and a heterozygous reciprocal translocation shape chromosome genetic behavior in tetraploid blueberry (Vaccinium corymbosum)

Affiliations

Autopolyploid inheritance and a heterozygous reciprocal translocation shape chromosome genetic behavior in tetraploid blueberry (Vaccinium corymbosum)

Molla F Mengist et al. New Phytol. 2023 Feb.

Abstract

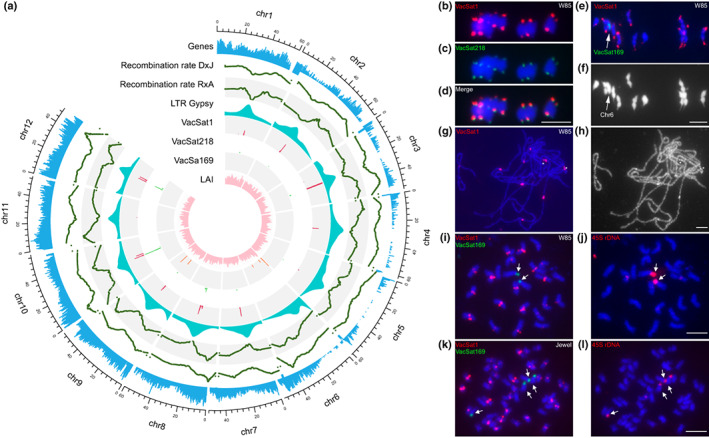
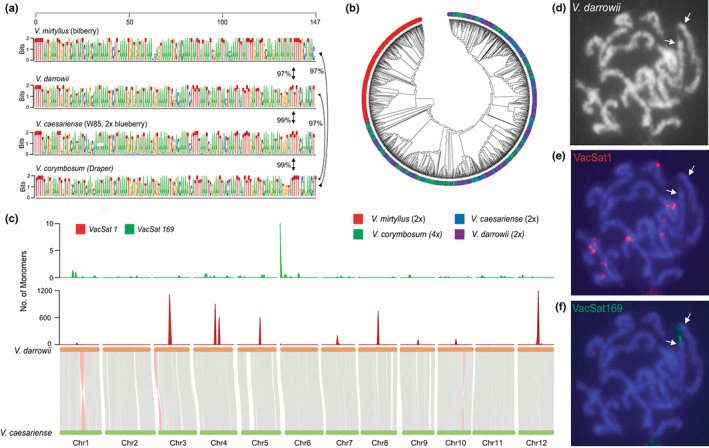
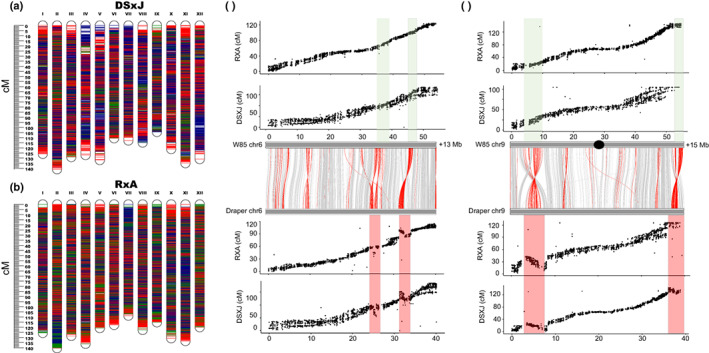
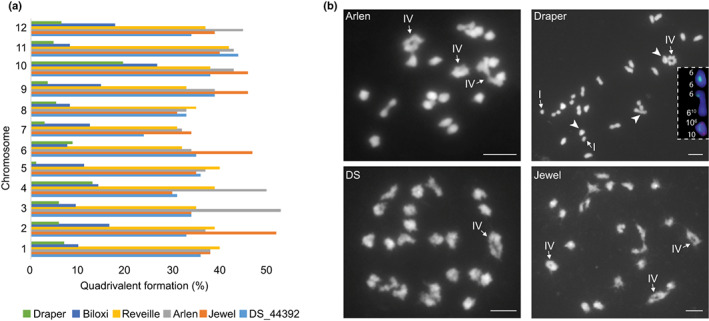
Understanding chromosome recombination behavior in polyploidy species is key to advancing genetic discoveries. In blueberry, a tetraploid species, the line of evidences about its genetic behavior still remain poorly understood, owing to the inter-specific, and inter-ploidy admixture of its genome and lack of in depth genome-wide inheritance and comparative structural studies. Here we describe a new high-quality, phased, chromosome-scale genome of a diploid blueberry, clone W85. The genome was integrated with cytogenetics and high-density, genetic maps representing six tetraploid blueberry cultivars, harboring different levels of wild genome admixture, to uncover recombination behavior and structural genome divergence across tetraploid and wild diploid species. Analysis of chromosome inheritance and pairing demonstrated that tetraploid blueberry behaves as an autotetraploid with tetrasomic inheritance. Comparative analysis demonstrated the presence of a reciprocal, heterozygous, translocation spanning one homolog of chr-6 and one of chr-10 in the cultivar Draper. The translocation affects pairing and recombination of chromosomes 6 and 10. Besides the translocation detected in Draper, no other structural genomic divergences were detected across tetraploid cultivars and highly inter-crossable wild diploid species. These findings and resources will facilitate new genetic and comparative genomic studies in Vaccinium and the development of genomic assisted selection strategy for this crop.

Keywords: autopolyploid; blueberry (Vaccinium corymbosum L.); centromeric repeat; chromosomal translocation; chromosome structure; phased genome; polyploid genetic behavior.


Conflict of interest statement

None declared.

Figures

Fig. 1
Fig. 1
Chromosomal features of Vaccinium caesariense W85 genome (2n = 2x = 24) and representative V. corymbosum tetraploid blueberry cultivars (2n = 4x = 48). (a) Circular multi‐track plot illustrating the following chromosomal features: gene density, LTR/gypsy density, satellite repeat VacSat1, VacSat218 and VacSat169 and genome wide recombination rates estimated from two mapping populations (DS × J and R × A). The density of each feature was estimated considering a 200 kb window of W85_v2 genome assembly p0; b–l) Fluorescence in situ hybridization (FISH) of satellite repeats and 45S rDNA on the chromosomes of W85 (2n = 2x = 24) and Jewel (2n = 4x = 48). (b–d) Distribution of VacSat1 (b, red signals) and VacSat218 (c, green signals) on meiotic metaphase I chromosomes (in blue) of W85; (d) image merged from (b) and (c). (e, f) Localization of VacSat1 (red) and VacSat169 (green, arrow) on W85 meiotic metaphase I chromosomes (blue); (f) the chromosomes in (e) shown in gray scale to better visualize the location of VacSat1 on stretched terminal regions of most bivalents. (g) Localization of VacSat1 (red) on W85 meiotic pachytene chromosomes; (h) pachytene chromosomes in (g) shown in gray scale to enhance the visualization of the heterochromatic domains overlapped by VacSat1. Two chromosomes each had two adjacent VacSat1 signals separated by a short gap on unlabeled chromatin (asterisks). (i) Distribution of VacSat1 (red) and VacSat169 (green) on mitotic metaphase chromosomes (blue) of W85; VacSat169 is located on two chromosomes lacking VacSat1 signals (arrows); (j) the same chromosome plate used in (i) hybridized with 45S rDNA (red, arrows). (k) Localization of VacSat1 (red) and VacSat169 (green) on mitotic metaphase chromosomes of Jewel (2n = 4x = 48); VacSat169 is located on four chromosomes lacking VacSat1 signals (arrows); (l) the same chromosome plate used in (k) hybridized with 45S rDNA (red, arrows). Bar, 5 μm.
Fig. 2
Fig. 2
Haplotype diversity in the Vaccinium caesariense W85 genome. The central blue bars represent the two haplotypes of chromosome 1. Haplotype on the left represent the phase 0 (p0) assembly and the one on the right represent the phase 1 (p1) assembly. The gray lines indicate paired allelic genes. The green, cyan, violet and red color bar plots indicate gene density, single‐nucleotide polymorphism density, indel density and the density of potential deleterious effect variants, respectively. All numbers were determined considering a 200 kb windows.
Fig. 3
Fig. 3
Comparative analysis of putative satellite centromeric repeat VacSat1 (147 bp monomer) in Vaccinium species. (a) VacSat1 sequence logo representing monomers extracted from four Vaccinium species, Draper (tetraploid, V. corymbosum), W85 (diploid, V. caesariense), bilberry (diploid, V. myrtillus) and evergreen blueberry (diploid, V. darrowii). Numbers next to the arrows indicate the average percent similarity of VacSat1 monomers across species estimated using the Maximum Composite Likelihood. (b) Phylogenetic analysis of VacSat1 monomer sequences inferred using the Neighbor‐Joining method implemented in Mega11 (Tamura et al., 2021). For the sequence logo and phylogenetic analysis, 300 VacSat1 monomer sequences/species were used. (c) Synteny analysis between W85_v2 against V. darrowii genome and distribution of VacSat1 and VacSat169 in V. darrowii physical maps (1 Mb windows). (d–f) Localization of VacSat1 and VacSat169 repeats on V. darrowii chromosomes using fluorescence in situ hybridization (FISH). (d) A somatic metaphase chromosomes of V. darrowii hybridized with (e) VacSat1 (red signals) and (f) VacSat169 (green). Arrows (in d and e) indicate the chromosomes with a terminal VacSat169 signal and no detectable VacSat1 repeats.
Fig. 4
Fig. 4
Development of ultra‐dense linkage maps and comparative analysis between Vaccinium caesariense diploid genome (W85) and V. corymbosum tetraploid genome (Draper). (a, b) Integrated linkage maps representing the DS × J (a) and R × A (b) mapping populations. Single‐nucleotide polymorphism positions are marked in red for markers representing Arlen (A) and Draper Selection‐44392 (DS), green for marker representing Reveille (R) and Jewel (J) and blue for markers that are common to the two parents. (c, d) xy plots represent the collinearity between DS × J and R × A LG6 (c) and LG9 (d) with W85 and Draper chr‐6 and chr‐9, respectively. The gray bars represent the alignment between W85 and Draper chr‐6 (c) and W85 and Draper chr9 (d). Red lines between Draper and W85 chromosomes represent potential rearrangements or chimeric regions, gray line represent collinear regions. Transparent green boxes indicate rearranged regions that were collinear between W85 chr‐6 and chr‐9 assemblies (0) and the DS × J and R × A linkage maps. The same regions highlighted in transparent red boxes were not collinear with Draper chr‐6 and chr‐9. Those regions represent chimeric sequences in the Draper assembly rather that true chromosome rearrangements.
Fig. 5
Fig. 5
Reciprocal inter‐chromosome translocation and its impact on chromosome pairing and recombination in Vaccinium corymbosum cv. Draper. (a) Synteny analysis between W85 (V. caesariense) chr‐6 and chr‐10 (p0) (gray bars) with Draper Chr 6 haplotypes (VaccDscaff6, 18, 30, 42) (blue bars) and chr‐10 haplotypes (VaccDscaff10, 22, 34 and 46) (orange bars). Blue and beige lines represent regions that were collinear. Violet lines represent regions that were translocated between W85 chr‐6 and chr‐10. Heat map with green and red shades in the W85 chr‐6 and chr‐10 represent the density (200 kb windows) of VacSat169 and VacSat1, respectively. Green and red dots in the Draper haplotypes represent the expected position of VacSat169 and VacSat1, respectively. (b, c) Fluorescence in situ hybridization (FISH) of VacSat1 (red) and VacSat169 (green) on mitotic metaphase chromosomes of Draper (2n = 4x = 48). VacSat169 signals were located on three chr‐6 homologs with no detectable VacSat1 signals and on the translocation chromosome chr‐106 carrying also VacSat1 repeats (arrows). (d–k) Meiotic pairing behavior of the four chromosomes carrying VacSat169 repeats (green signals) at diakinesis‐metaphase I in Draper. (d) Gray‐scale image of a Draper metaphase I cell with 24 bivalents; (e, inset) the same image with VacSat1 (red) and VacSat169 (green) FISH signals; the arrows (in d and e) indicate 6–6 bivalent, 6–610 bivalent and 106–10 bivalent. Chr‐610 has no detectable FISH signals of either probe, whereas chr‐106 has both VacSat169 and VacSat1 signals. (f) Gray‐scale image of a Draper metaphase I cell containing a tetravalent ring; (g) the same cell hybridized with VacSat1 and VacSat169 repeats. The arrows point to the tetravalent involving a chr‐6, chr‐610, a chr‐10, and chr‐106, and to a 6–6 bivalent. (h) Gray‐scale image of a Draper metaphase I cell containing a hexavalent chain. (i) The same cell hybridized with VacSat1 and VacSat169 repeats. The arrows indicate the hexavalent made of three chr‐6 homologs, chr‐106, and other two chromosomes. (j) Gray‐scale image of a Draper metaphase I cell containing a hexavalent chain; (k) the same cell with VacSat1 (red) and VacSat169 FISH signals. The arrows indicate a 6–6 bivalent, and the hexavalent made of one copy of chr‐6, chr‐106, and other four chromosomes. Bar, 5 μm. (l) Clustering of Draper single‐nucleotide polymorphism markers obtained from the D × B population into respective linkage groups based on logarithms of odds (LOD) score. Black circles represent markers grouped in linkage groups, and representing the four haplotypes. Lines between circles represent linkage between markers grouped in each LG. Orange and blue color inside the LGs representing chr‐6 and chr‐10, indicates the marker composition of each haplotype. Circles with orange and blue colors contain markers from both chr‐6 and chr‐10.
Fig. 6
Fig. 6
Chromosome pairing behavior evaluated using molecular markers and cytogenetic work in Vaccinium corymbosum cv. Draper, Biloxi, Arlen, Reveille, Jewel and selection Draper Selection‐44392 (DS). (a) Summary of quadrivalent formation (%) in parents of three linkage maps developed here. (b) Representative diakinesis‐metaphase I cells from the tetraploid blueberries Arlen containing two tetravalent rings, a tetravalent chain and 18 bivalents; Draper with a tetravalent ring, two univalents and 21 bivalents; chr‐6 homologs and translocation chromosomes paired as bivalent (arrowheads) and are shown in the inset with their fluorescence in situ hybridization (FISH) signals of VacSat169 (green) and VacSat1 (red); DS with a tetravalent ring and 22 bivalents; Jewel with three tetravalent rings and 18 bivalents. Arrows point to the tetravalents (IV) and univalent (I). Bar, 5 μm.

Similar articles

Cited by

References

    1. Benjamini Y, Hochberg Y. 1995. Controlling the false discovery rate: a practical and powerful approach to multiple testing. Journal of the Royal Statistical Society: Series B (Methodological) 57: 289–300.
    1. Bourke PM, Arens P, Voorrips RE, Esselink GD, Koning‐Boucoiran CFS, van't Westende WPC, Santos Leonardo T, Wissink P, Zheng C, van Geest G et al. 2017. Partial preferential chromosome pairing is genotype dependent in tetraploid rose. The Plant Journal 90: 330–343. - PubMed
    1. Bourke PM, van Geest G, Voorrips RE, Jansen J, Kranenburg T, Shahin A, Visser RGF, Arens P, Smulders MJM, Maliepaard C. 2018. polymapr—linkage analysis and genetic map construction from F1 populations of outcrossing polyploids. Bioinformatics 34: 3496–3502. - PMC - PubMed
    1. Bourke PM, Voorrips RE, Visser RGF, Maliepaard C. 2015. The double‐reduction landscape in tetraploid potato as revealed by a high‐density linkage map. Genetics 201: 853–863. - PMC - PubMed
    1. Brevis PA, Bassil NV, Ballington JR, Hancock JF. 2008. Impact of wide hybridization on highbush blueberry breeding. Journal of the American Society for Horticultural Science 133: 427–437.

Publication types

LinkOut - more resources