. 2023 Jan;290(1):225-246.
doi: 10.1111/febs.16595. Epub 2022 Aug 24.

Loss of mitochondrial fatty acid β-oxidation protein short-chain Enoyl-CoA hydratase disrupts oxidative phosphorylation protein complex stability and function

Affiliations

Loss of mitochondrial fatty acid β-oxidation protein short-chain Enoyl-CoA hydratase disrupts oxidative phosphorylation protein complex stability and function

Harrison Burgin et al. FEBS J. 2023 Jan.

Abstract

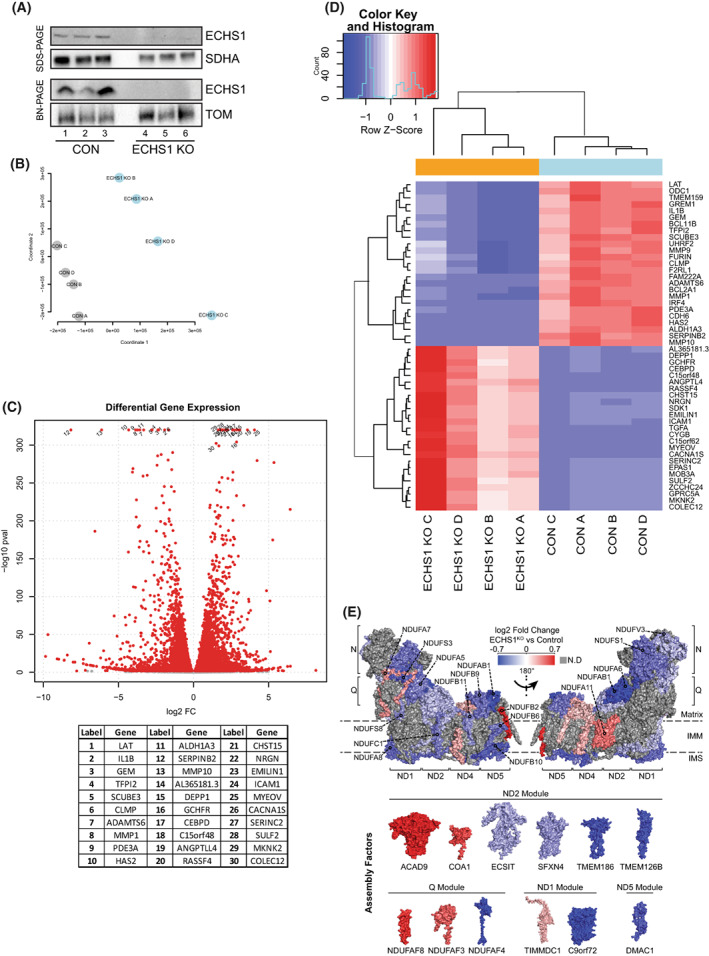
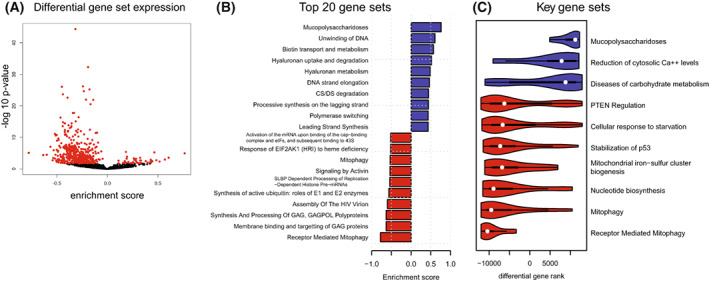
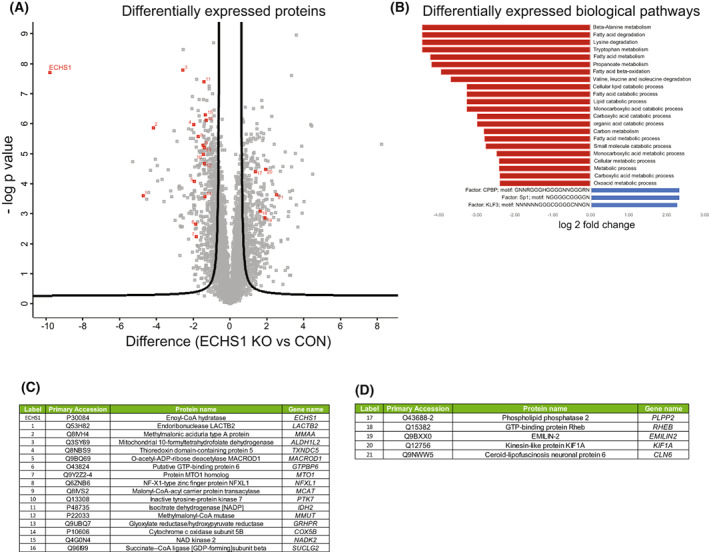
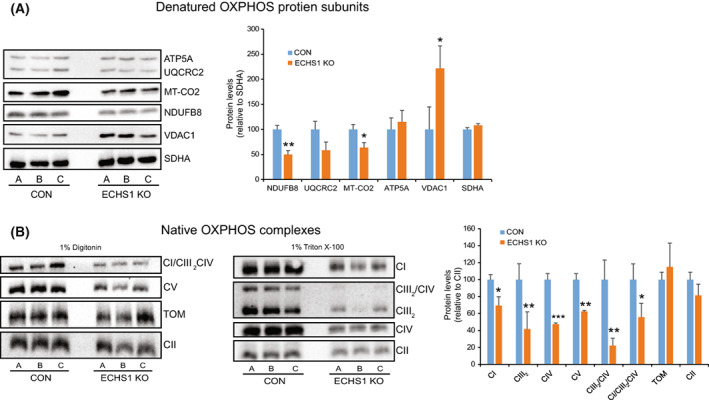
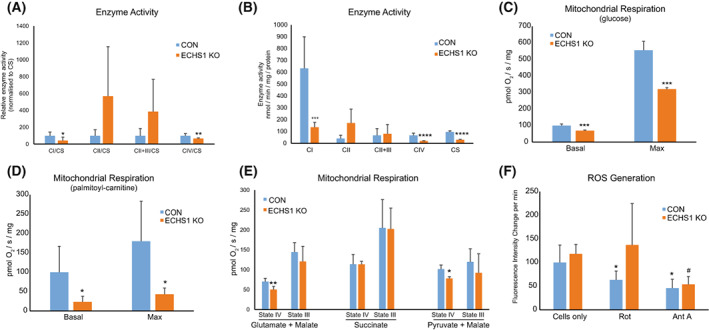
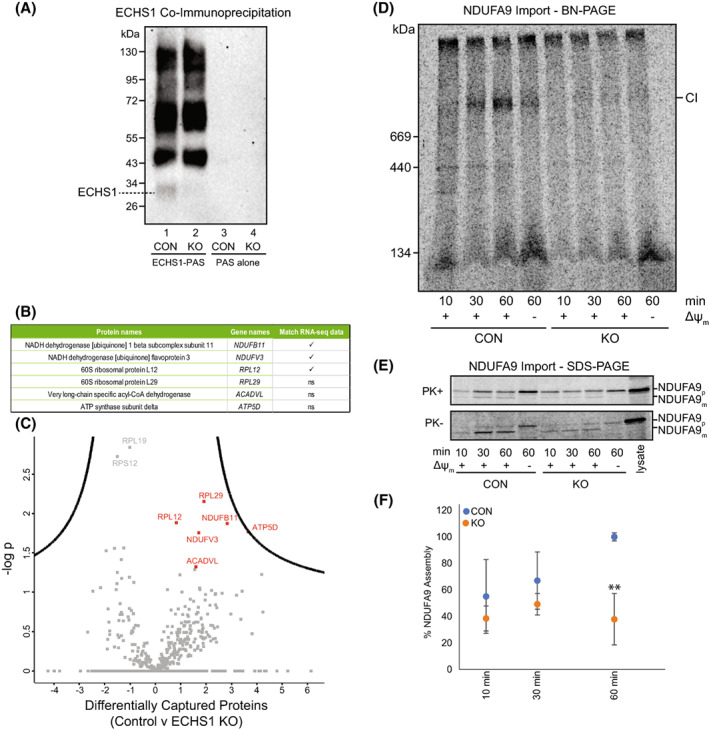
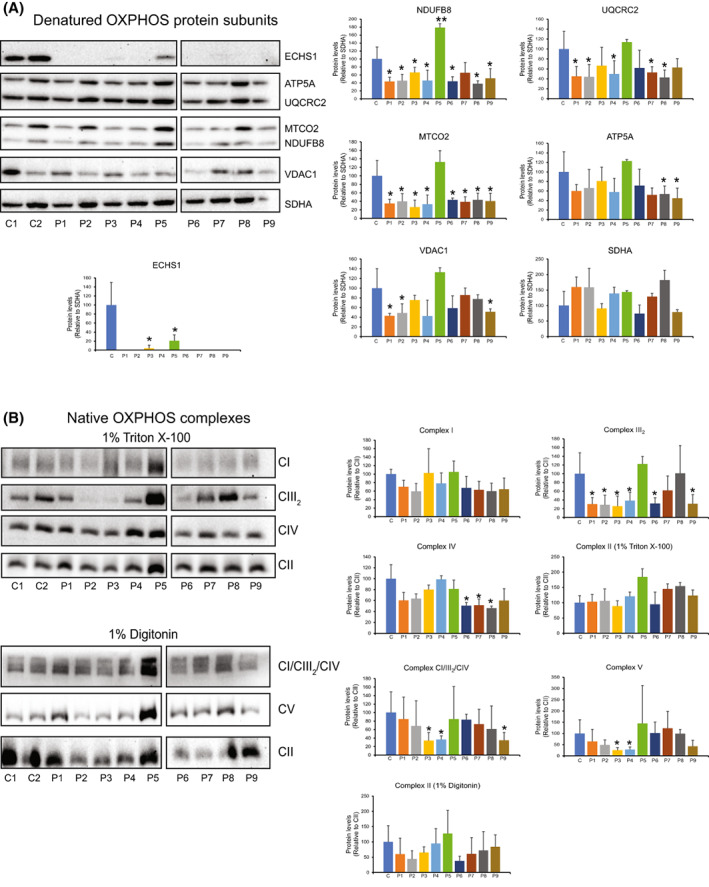
Short-chain enoyl-CoA hydratase 1 (ECHS1) is involved in the second step of mitochondrial fatty acid β-oxidation (FAO), catalysing the hydration of short-chain enoyl-CoA esters to short-chain 3-hyroxyl-CoA esters. Genetic deficiency in ECHS1 (ECHS1D) is associated with a specific subset of Leigh Syndrome, a disease typically caused by defects in oxidative phosphorylation (OXPHOS). Here, we examined the molecular pathogenesis of ECHS1D using a CRISPR/Cas9 edited human cell 'knockout' model and fibroblasts from ECHS1D patients. Transcriptome analysis of ECHS1 'knockout' cells showed reductions in key mitochondrial pathways, including the tricarboxylic acid cycle, receptor-mediated mitophagy and nucleotide biosynthesis. Subsequent proteomic analyses confirmed these reductions and revealed additional defects in mitochondrial oxidoreductase activity and fatty acid β-oxidation. Functional analysis of ECHS1 'knockout' cells showed reduced mitochondrial oxygen consumption rates when metabolising glucose or OXPHOS complex I-linked substrates, as well as decreased complex I and complex IV enzyme activities. ECHS1 'knockout' cells also exhibited decreased OXPHOS protein complex steady-state levels (complex I, complex III2 , complex IV, complex V and supercomplexes CIII2 /CIV and CI/CIII2 /CIV), which were associated with a defect in complex I assembly. Patient fibroblasts exhibit varied reduction of mature OXPHOS complex steady-state levels, with defects detected in CIII2 , CIV, CV and the CI/CIII2 /CIV supercomplex. Overall, these findings highlight the contribution of defective OXPHOS function, in particular complex I deficiency, to the molecular pathogenesis of ECHS1D.

Keywords: ECHS1 deficiency; OXPHOS; fatty acid oxidation; mitochondria; mitochondrial disease; short-chain enoyl-CoA hydratase.


Conflict of interest statement

The authors declare no conflict of interest.

Figures

Fig. 1
Fig. 1
Knockout of ECHS1 impacts global gene expression. (A) Western blot analysis of ECHS1 KO cells confirming the absence of ECHS1 protein via both SDS/PAGE and BN‐PAGE. Image shown is representative of three independent experiments. (B) Multidimensional scaling analysis shows sample clustering based on sample type, either ECHS1 KO cells or control (CON) cells. (C) Volcano plot depicting gene expression changes in ECHS1 KO cells. In total, 11 278 genes were differentially expressed, with 5359 upregulated and 5919 downregulated. Red points indicate False discovery rate; false positive to total positive rate; FDR < 0.05. Top 30 genes with differential expression (as determined by P value) labelled. (D) Heatmap of the 50 most significantly differentially expressed genes in ECHS1 KO cells. (E) Topographical heatmap showing RNA‐Seq log2 fold‐changes mapped onto the structure of complex I, and its assembly factors, from ESCH1 KO cells. Complex I assembly factors are grouped according to their associated complex I assembly modules. Grey subunits had no significant differences in expression.
Fig. 2
Fig. 2
Downregulated mitochondrial metabolic pathways in ECHS1 KO cells. (A) Volcano plot of Reactome gene set enrichment. Out of 1472 gene sets analysed, 43 were upregulated and 464 were downregulated in ECHS1 KO cells. Red points indicate FDR < 0.05. (B) Mitch pathway analysis indicating top 20 differentially expressed gene sets as ranked by effect size in ECHS1 KO cells. (C) Ridge plot of 10 key gene sets that are differentially expressed in ECHS1 KO cells (FDR < 0.05).
Fig. 3
Fig. 3
Biological pathways impacted by the loss of ECHS1 protein. (A) Volcano plot of 274 differentially expressed proteins from isolated ECHS1 KO mitochondria; 142 are upregulated and 132 are downregulated compared to control. ECHS1 is shown in red in the top left quadrant. Permutation‐based FDR set at < 1% and s0 = 1. ECHS1 was present in control (CON) cells but at negligible levels in ECHS1 KO cells. Significantly altered proteins which also had significantly altered transcript levels are numbered in red. (B) Functional enrichment of mitochondrial proteins using GO terms and KEGG pathways. Shown are top tier terms with Fisher's exact test and Bonferroni post hoc testing with P < 0.05. (C) Significantly decreased proteins in ECHS1 KO mitochondria that also had significantly reduced transcript levels detected by RNA‐seq (proteins 1–16 in Volcano plot, ranked by protein log2 fold change). (D) Significantly increased proteins in ECHS1 KO mitochondria that also had increased transcript levels detected by RNA‐seq (proteins 17–21 in Volcano plot, ranked by protein log2 fold change).
Fig. 4
Fig. 4
ECHS1 KO cells have decreased OXPHOS protein steady‐state levels. (A) Steady‐state levels of NDUFB8 and MT‐CO2 were decreased in ECHS1 KO mitochondria, whereas levels of the voltage‐dependent anion‐selective channel protein 1 (VDAC1) were increased. (B) Steady‐state levels of complex I (CI), the complex III dimer (CIII2), complex IV (CIV), complex V (CV), the CIII2/CIV supercomplex and the CI/CIII2/CIV supercomplex were all reduced in ECHS1 KO mitochondria compared to control (CON) mitochondria. Data shown as mean ± SD, n = 3. *P < 0.05, **P < 0.01 and ***P < 0.001 compared to control values (Student's two‐tailed t‐test).
Fig. 5
Fig. 5
Loss of ECHS1 expression reduces mitochondrial respiratory and enzymatic function. (A) ECHS1 KO mitochondria have reduced levels of CI and CIV activity (normalised to citrate synthase, CS, activity), whereas CII and CII + CIII activity is unchanged compared to control (CON). (B) ECHS1 KO mitochondria have reduced complex I, complex IV and citrate synthase activities (raw rates) compared to control (CON) rates. (C) Basal and maximal respiration rates in ECHS1 KO cells were both significantly reduced when metabolising glucose. (D) Basal and maximal respiration rates in ECHS1 KO cells were both significantly reduced when metabolising the fatty acid ester palmitoyl‐l‐carnitine. (E) ECHS1 KO mitochondria have reduced state IV respiratory rates when metabolising glutamate and malate or pyruvate and malate, but not succinate. (F) Average change in H2DCFDA fluorescence intensity in CON and ECHS1 KO cells under basal and inhibitory conditions. Cellular H2O2 production was decreased after treatment with rotenone (Rot) or antimycin A (AntA) in CON cells. However, only antimycin A treatment reduced H2O2 production in ECHS1 KO cells. Data shown as mean ± SD, n = 3. *P < 0.05, **P < 0.01, ***P < 0.001, ****P < 0.0001 relative to control (CON), # P < 0.05 compared to ECHS1 KO (Student's two‐tailed t‐test).
Fig. 6
Fig. 6
Co‐immunoprecipitation of ECHS1 identifies putative OXPHOS complex I binding partners, with loss of ECHS1 disrupting complex I assembly. Co‐immunoprecipitation with ECHS1 antibodies (ECHS1‐PAS) or PAS alone, followed by western blotting and immunodetection with anti‐ECHS1 antibodies. (A) ECHS1‐PAS pull‐down captured ECHS1 (Lane 1) from control (CON) mitochondria, with non‐specific proteins also pulled down (lane 1). ECHS1 was not captured from ECHS1 KO mitochondria as expected, however non‐specific proteins were pulled down (lane 2). PAS alone did not capture any non‐specific proteins detectable with anti‐ECHS1 antibodies (Lanes 3 and 4) from either CON or ECHS1 KO mitochondria. Image shown is representative of three independent experiments. (B) Six proteins specific for ECHS1 immunocapture identified by comparative analyses of co‐immunoprecipitated proteins captured from CON mitochondria with those captured from ECHS1 KO mitochondria. Of these, RNA‐seq identified reduced transcript levels of NDUFB11, NDUFV3 and RPL12 (ns, not significant). (C) Volcano plot of captured proteins by ECHS1 coimmunoprecipitation. Permutation‐based FDR set at < 1% and s0 = 1. RPL12, RPL29, NDUFB11, NDUFV3, ATP5D and ACADVL (shown in red) present in capture from CON mitochondria but not ECHS1 KO mitochondria (n = 3, Student's two‐tailed t‐test, P < 0.05). (D) BN‐PAGE showing the assembly of NDUFA9 into mature complex I (CI) following solubilisation of 40 μg mitochondria per lane in 1% TX‐100. (E) SDS/PAGE showing NDUFA9 following import into both CON and ECHS1 KO mitochondria. NDUFA9 is detectable in its precursor (p) form and as a proteinase K (PK+) resistant mature (m) form. (F) Quantitation of NDUFA9 assembly into mature complex I after 10, 30 and 60 min of import, normalised to maximum amount of NDUFA9 imported after 60 min in CON. The amount of NDUFA9 assembled into complex I (CI) after 60 min in ECHS1 KO mitochondria was only 37.9 ± 19.3% of CON levels. Data shown are mean ± SD with n = 3, **P < 0.01 relative to control (CON; Student's two‐tailed t‐test). Images shown are representative of three independent experiments.
Fig. 7
Fig. 7
ECHS1‐deficient patient fibroblasts have reduced steady‐state levels of OXPHOS subunits and mature complexes. (A) ECHS1 was detectable in patients P3 and P5, but not in any other patients. NDUFB8 was reduced in all patients, except P5, where NDUFB8 levels were increased, and P7, where NDUFB8 levels were not reduced. UQCRC2 levels were decreased in all patients except P5 and P9. MTCO2 levels were decreased in all patients except P5. ATP5A was decreased in P8 and P9. VDAC1 levels were decreased in P1, P2 and P9. (B) Steady‐state levels of CIII2 were reduced in P2, P3, P4, P6 and P9 compared to control (CON) mitochondria. CIV levels were reduced in P6, P7 and P8. CV levels were reduced in P3 and P4. CI/CIII2/CIV supercomplex levels were reduced in P3, P4 and P9. Images shown are representative of three independent experiments. Values shown are mean ± SD, n = 3. *P < 0.05, **P < 0.01 relative to control (CON; Student's two‐tailed t‐test).

Similar articles

Cited by

References

    1. Burgin HJ, McKenzie M. Understanding the role of OXPHOS dysfunction in the pathogenesis of ECHS1 deficiency. FEBS Lett. 2020;594:590–610. - PubMed
    1. Peters H, Buck N, Wanders R, Ruiter J, Waterham H, Koster J, et al. ECHS1 mutations in Leigh disease: a new inborn error of metabolism affecting valine metabolism. Brain. 2014;137:2903–8. - PubMed
    1. Haack TB, Jackson CB, Murayama K, Kremer LS, Schaller A, Kotzaeridou U, et al. Deficiency of ECHS1 causes mitochondrial encephalopathy with cardiac involvement. Ann Clin Transl Neurol. 2015;2:492–509. - PMC - PubMed
    1. Lake NJ, Compton AG, Rahman S, Thorburn DR. Leigh syndrome: one disorder, more than 75 monogenic causes. Ann Neurol. 2016;79:190–203. - PubMed
    1. Ferdinandusse S, Friederich MW, Burlina A, Ruiter JP, Coughlin CR 2nd, Dishop MK, et al. Clinical and biochemical characterization of four patients with mutations in ECHS1. Orphanet J Rare Dis. 2015;10:79. - PMC - PubMed

Publication types