. 2025 Aug;10 Suppl 1(Suppl 1):S136-S182.
doi: 10.1002/epi4.12643. Epub 2022 Sep 22.

A companion to the preclinical common data elements and case report forms for in vivo rodent neuroimaging: A report of the TASK3-WG3 Neuroimaging Working Group of the ILAE/AES Joint Translational Task Force

Affiliations

A companion to the preclinical common data elements and case report forms for in vivo rodent neuroimaging: A report of the TASK3-WG3 Neuroimaging Working Group of the ILAE/AES Joint Translational Task Force

Erwin A van Vliet et al. Epilepsia Open. 2025 Aug.

Abstract

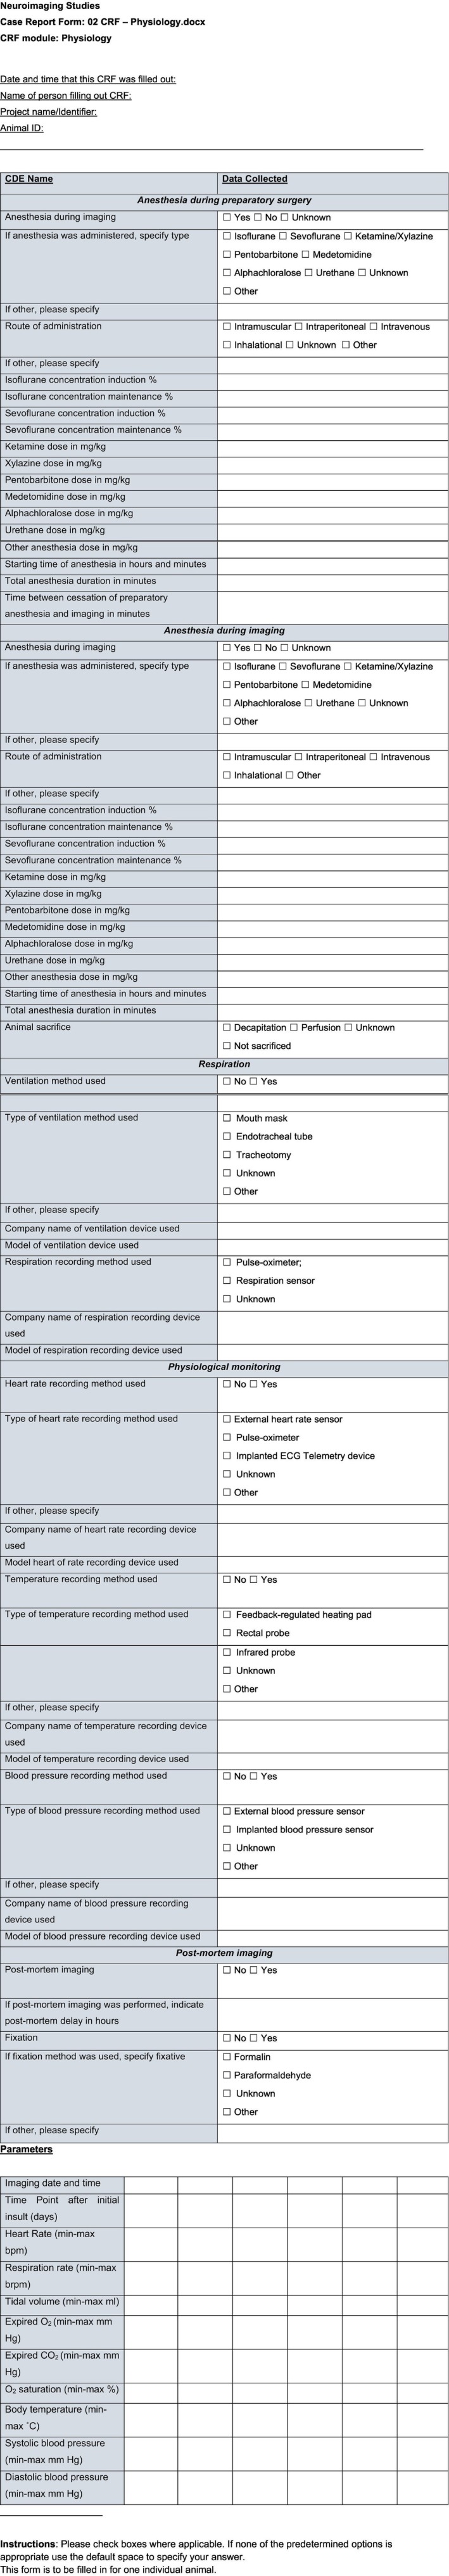
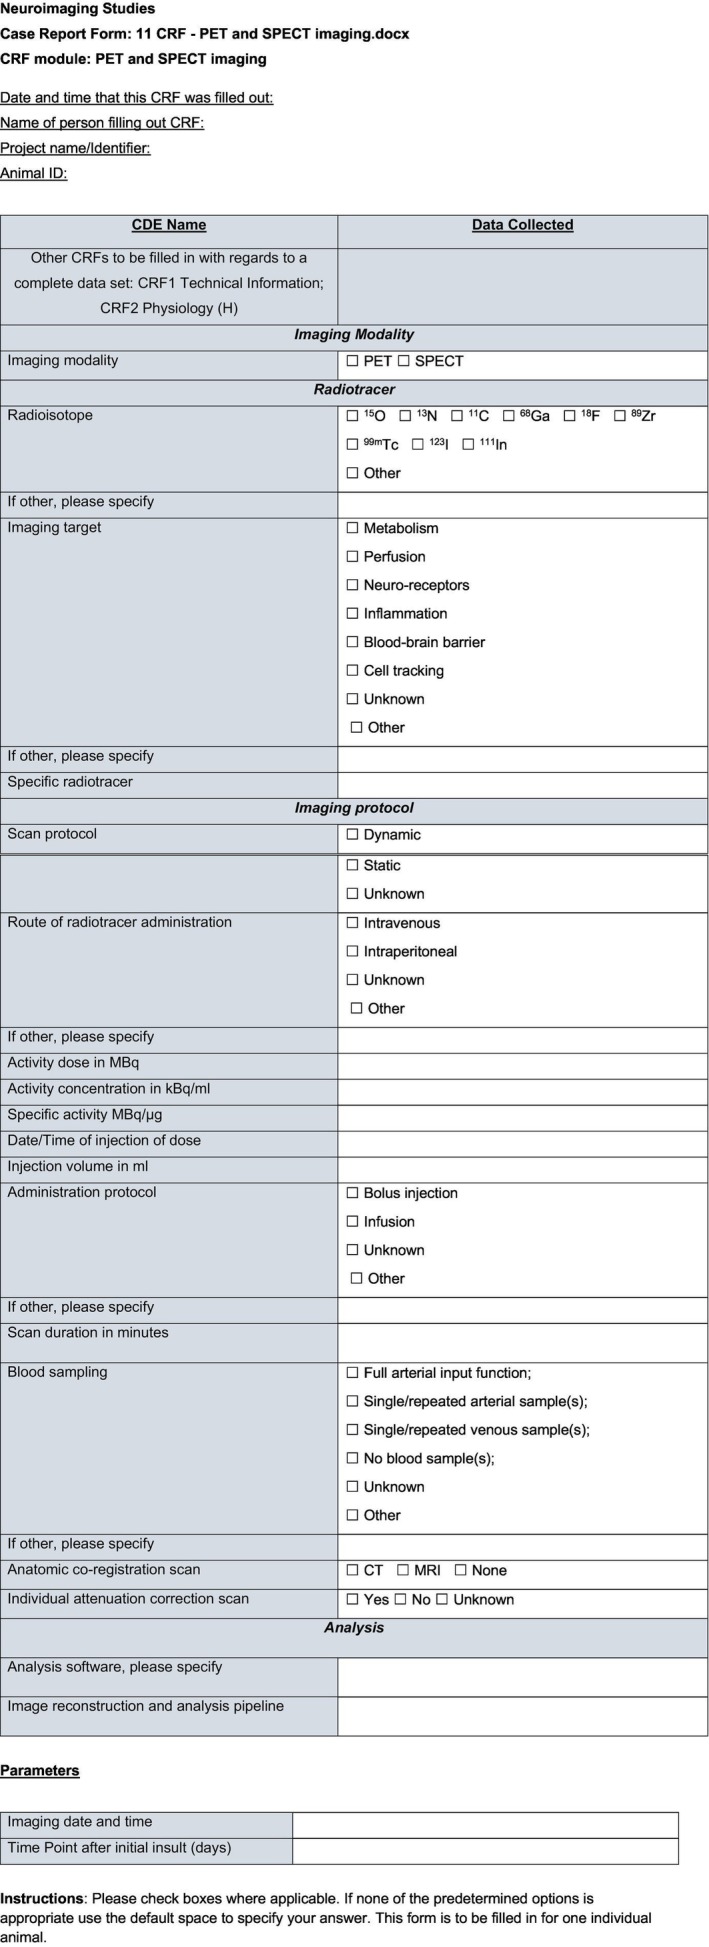
The International League Against Epilepsy/American Epilepsy Society (ILAE/AES) Joint Translational Task Force established the TASK3 working groups to create common data elements (CDEs) for various aspects of preclinical epilepsy research studies, which could help improve the standardization of experimental designs. In this article, we discuss CDEs for neuroimaging data that are collected in rodent models of epilepsy, with a focus on adult rats and mice. We provide detailed CDE tables and case report forms (CRFs), and with this companion manuscript, we discuss the methodologies for several imaging modalities and the parameters that can be collected.

Keywords: epilepsy; magnetic resonance imaging; magnetic resonance spectroscopy; mouse; positron emission tomography; rat; single photon emission computed tomography.


Conflict of interest statement

Alon Friedman is Associate Editor for Epilepsia Open. None of the authors has any conflict of interest to disclose. We confirm that we have read the Journal's position on issues involved in ethical publication and affirm that this report is consistent with those guidelines.

Figures

FIGURE 1
FIGURE 1
Overview of neuroimaging techniques to detect changes in the epileptic brain. ASL, arterial spin labeling; CE‐MRI, contrast‐enhanced magnetic resonance imaging; DWI, diffusion‐weighted magnetic resonance imaging; fMRI, functional magnetic resonance imaging; MEMRI, manganese‐enhanced magnetic resonance imaging; MRS, magnetic resonance spectroscopy; PET, positron emission tomography; SPECT, single photon emission computed tomography.
FIGURE 2
FIGURE 2
Technical information case report form (see main text for details)
FIGURE 3
FIGURE 3
Physiology case report form (see main text for details)
FIGURE 4
FIGURE 4
Blood–brain barrier permeability was assessed after the induction of status epilepticus (SE) in rats using T1‐weighted MR images (gradient echo; repetition/echo time, 160/4 ms; flip angle, 70°; acquisition matrix, 256 × 128; voxel resolution, 125 × 125 μm2, slice thickness 1.0 mm, that were acquired before and 45 min after the start of a 20 min step‐down infusion with Gadolinium (Gd) Using the pre‐post approach, “leakage maps” were created, in which the precontrast T1‐weighted signal intensity is subtracted from the postcontrast signal intensity and divided by the precontrast signal intensity. A threshold of 20% (0.2) was set. Data acquired by Erwin van Vliet.
FIGURE 5
FIGURE 5
Contrast‐enhanced imaging case report form (see main text for details)
FIGURE 6
FIGURE 6
Fluorescent angiography to study BBB integrity. (A) Following craniotomy, electrocorticography (ECoG) is recorded, and seizures are induced using 4‐AP. (B) The BBB nonpermeable tracer sodium fluorescein is injected intravenously and simultaneously high‐frequency images of pial vessels are repeatedly obtained before (control) and following 4‐AP‐induced seizures. (C) Permeability maps, before (left) and following seizures (right). Warm colors over the extravascular regions indicate BBB dysfunction. Data acquired by Ofer Prager and Alon Friedman.
FIGURE 7
FIGURE 7
Magnetic resonance angiography in a mouse brain. Time of flight (TOF) images were acquired at 9.4T using a 4‐channel receive only cryocoil in ~5 min with an isotropic spatial resolution of 75 μm3. Vessel enhancement filtering, and maximum intensity projections were reconstructed using MATLAB. Data acquired by David Wright.
FIGURE 8
FIGURE 8
Angiography case report form (see main text for details)
FIGURE 9
FIGURE 9
Cerebral blood flow maps acquired with continuous arterial spin labeling (CASL) from sham‐operated (A) or traumatic brain injury (B) rats at 8 months after induction of lateral fluid percussion induced injury. The yellow arrow indicates a hypoperfused area within the perilesional cortex, and the white on the image indicates a hyperperfused area of thalamus. Quantification of the CBF in corresponding ipsilateral and contralateral areas (C, D). Figure reproduced with modifications from with permission of Mary Ann Liebert, Inc.
FIGURE 10
FIGURE 10
Arterial spin‐labeling case report form (see main text for details)
FIGURE 11
FIGURE 11
Diffusion‐weighted imaging (DWI) in the adult mouse brain. Example fractional anisotropy (FA, left column) and tractography images (right column) acquired in vivo at 9.4 T using a single‐channel, anatomically shaped surface coil. Two diffusion shells (b‐values = 1500 and 3000 s/mm2) with 81 directions were acquired at 250 μm isotropic resolution in <10 min. DWIs were upsampled to 125 μm isotropic resolution, and FA and tractography images were reconstructed using MRtrix3 software. Color bar shows FA values from 0 (black) to 1 (white). Tractography streamlines are color‐encoded according to orientation: red, medial‐lateral; green, anterior‐posterior; and blue, superior‐inferior. Data acquired by David Wright.
FIGURE 12
FIGURE 12
Diffusion‐weighted imaging case report form (see main text for details)
FIGURE 13
FIGURE 13
T2‐weighted images of the lateral fluid percussion injury rat model of post‐traumatic epilepsy in the acute and chronic stages. Two representative animals (A and C) shown 2 days postinjury, and 5 months later (B and D). T2‐weighted images show the acute edema in the cortex (white arrow in A), along white matter tracts (arrowhead in A), and in the hippocampus (white arrowhead in C). Five months later, the progressive atrophy has formed a cortical CSF‐filled cavity (asterisk in B). Note, how despite the similar edema size at 2 days, the chronic lesion size differs evidently (B versus D). On T2‐weighted images, intracortical hematomas (black arrow in A) and white matter bleeds (black arrowhead in C) are also evident. Atrophy can be quantified by whole brain volumetry (E), or by segmenting, e.g., the enlarged ventricles and lesion cavity (F). These examples are made by ITK‐SNAP on isotropic 3D high‐resolution images in (G). Images were acquired at 7T with actively decoupled volume transmitter and quadrature surface receiver coils. Fast spin echo sequence (TurboRARE, effective TE = 45 ms, TR = 3400 ms, RAREfactor = 8) was used to obtain T2‐weighted images, 23 slices 0.8‐mm‐thick with 117 × 117 μm in‐plane resolution in 5 min. 3D images with T1/T2* mixed contrast and 160 μm3 isotropic resolution were obtained with a multi‐echo gradient echo sequence (TR = 66 ms, 13 echoes with TE from 2.7 ms to 43 ms, flip angle 16°, averaged over echoes) in 11 min. Courtesy of EpiBioS4Rx project, data acquired by Riikka Immonen.
FIGURE 14
FIGURE 14
Volumetry case report form (see main text for details).
FIGURE 15
FIGURE 15
Manganese‐enhanced MRI (MEMRI) highlights the perforant pathway and mossy fiber sprouting in the dentate gyrus, allowing longitudinal studies of hippocampal axonal plasticity during epileptogenesis. Panel shows T1‐weighted images 24 h after intraperitoneal MnCl2 administration 12 days (A, A2) and 3 months (B, B2) after kainic acid (KA)‐induced status epilepticus. The area of manganese‐enhanced signal in the dentate gyrus (black arrows) increases upon axonal sprouting. Intensity profiles across hippocampi (lines) allow assessing the thickness of different hippocampal layers. Histological assessment has shown manganese to accumulate into mossy fibers but also co‐located astrogliosis may contribute to the contrast. T1‐weighted 3D images were acquired at 4.7T with quadrature surface RF coil using gradient echo sequence with an adiabatic 70‐degree BIR‐4 excitation pulse to reduce the influence of B1 inhomogeneity (TR = 120 ms, TE = 2.7 ms, volume of 2.5 × 2.5 × 3.5 cm3 was covered with 192 × 64 × 256 points). Data acquired by Riikka Immonen.
FIGURE 16
FIGURE 16
Manganese contrast‐enhanced magnetic resonance imaging case report form (see main text for details)
FIGURE 17
FIGURE 17
Functional parcellation of a normal rat brain obtained by independent component analysis with 45 components (A). Functional connectivity matrices from correlation analysis between atlas‐based brain areas from 20 rats before (B) and 10 days after traumatic brain injury (C). Data acquired by Lenka Dvorakova and Olli Gröhn at the University of Eastern Finland. _c, contralateral to injury; _i, ipsilateral to injury; AU, auditory cortex; CA, Hippocampus; cG, cingula cortex; CPu, caudate putamen; HTh, Hypothalamus; M1M2, motor cortex; mPFC, medial prefrontal cortex; MTh, medial thalamus; PtA, parietal cortex; RSc, retrosplenial cortex; S1S2, somatosensory cortex; V1V2, visual cortex; VLTh, ventrolateral thalamus.
FIGURE 18
FIGURE 18
fMRI case report form (see main text for details)
FIGURE 19
FIGURE 19
Example spectra acquired from the mouse hippocampus. A cryogenically cooled 4‐channel surface coil and PRESS sequence were used to acquire 384 averages in 16 min. The volume of interest had dimensions of 2 × 1 × 1.5 mm3. The spectra were processed with LCModel using an additional acquisition without water suppression. Data acquired by David Wright.
FIGURE 20
FIGURE 20
MRS case report form (see main text for details)
FIGURE 21
FIGURE 21
Translocator Protein (TSPO) positron emission tomography (PET) targeting activated microglia during epileptogenesis in rats (systemic pilocarpine poststatus epilepticus (SE) model). (A) Coronal and horizontal brain PET images of [11C]PK11195 uptake before and at different time points during epileptogenesis. (B) Microglia staining (CD11b) in control and 14‐d post‐SE rats (CA1 region of hippocampus; insert displays 4‐times‐higher magnification of pyramidal cell layer). (C) Semiquantitative evaluation of microglial activation during epileptogenesis. Data are mean ± SEM. Significant changes are indicated by asterisk (P < 0.05). (D) Spearman correlation analysis of 11C‐PK11195 in vivo binding potential BPND and immunohistochemistry scores. The figure was originally published in the Journal of Nuclear Medicine (Brackhan et al. 2016, © SNMMI).
FIGURE 22
FIGURE 22
PET and SPECT case report form (see main text for details)

References

    1. Wilkinson MD, Dumontier M, Aalbersberg IJ, Appleton G, Axton M, Baak A, et al. The FAIR Guiding Principles for scientific data management and stewardship. Sci Data. 2016;3:160018. - PMC - PubMed
    1. Immonen R, Smith G, Brady RD, Wright D, Johnston L, Harris NG, et al. Harmonization of pipeline for preclinical multicenter MRI biomarker discovery in a rat model of post‐traumatic epileptogenesis. Epilepsy Res. 2019;150:46–57. - PMC - PubMed
    1. Harte‐Hargrove LC, French JA, Pitkanen A, Galanopoulou AS, Whittemore V, Scharfman HE. Common data elements for preclinical epilepsy research: standards for data collection and reporting. A TASK3 report of the AES/ILAE Translational Task Force of the ILAE. Epilepsia. 2017;58(Suppl 4):78–86. - PMC - PubMed
    1. Harte‐Hargrove LC, Galanopoulou AS, French JA, Pitkanen A, Whittemore V, Scharfman HE. Common data elements (CDEs) for preclinical epilepsy research: introduction to CDEs and description of core CDEs. A TASK3 report of the ILAE/AES joint translational task force. Epilepsia Open. 2018;3:13–23. - PMC - PubMed
    1. Barker‐Haliski M, Harte‐Hargrove LC, Ravizza T, Smolders I, Xiao B, Brandt C, et al. A companion to the preclinical common data elements for pharmacologic studies in animal models of seizures and epilepsy. A Report of the TASK3 Pharmacology Working Group of the ILAE/AES Joint Translational Task Force. Epilepsia Open. 2018;3:53–68. - PMC - PubMed