. 2022 Sep 13;55(9):1609-1626.e7.
doi: 10.1016/j.immuni.2022.07.007. Epub 2022 Aug 12.

The matricellular protein SPARC induces inflammatory interferon-response in macrophages during aging

Affiliations

The matricellular protein SPARC induces inflammatory interferon-response in macrophages during aging

Seungjin Ryu et al. Immunity. .

Abstract

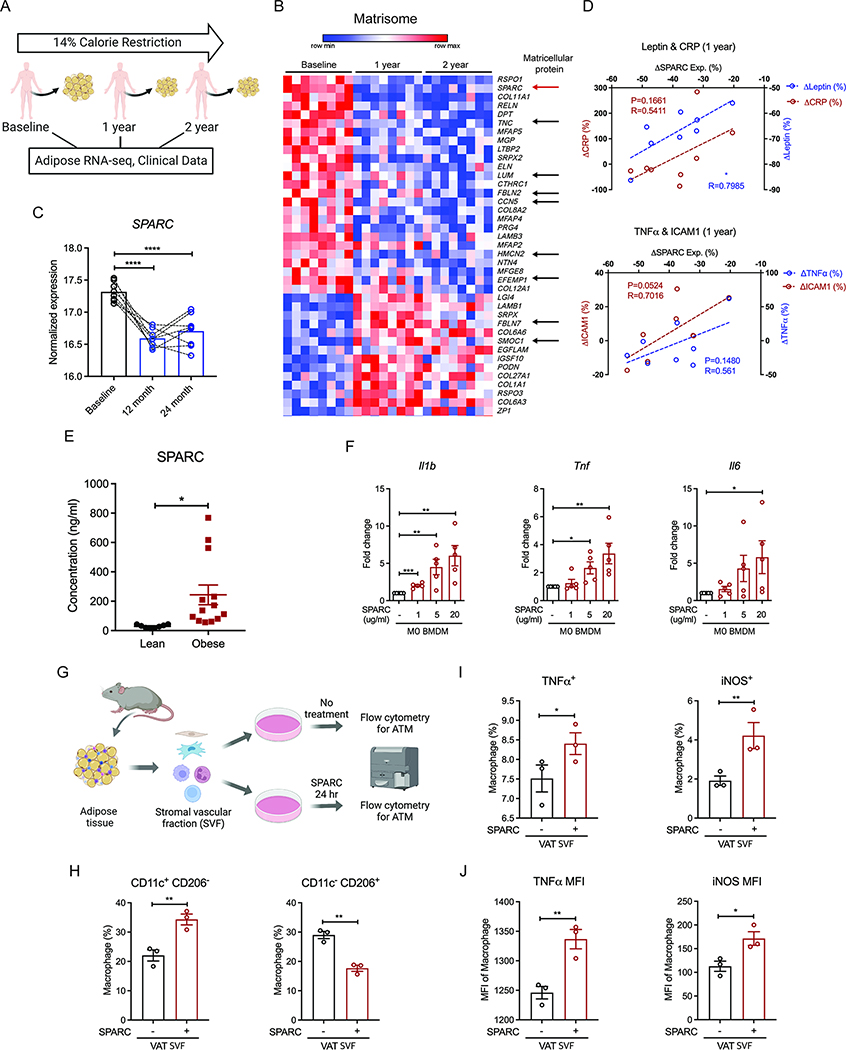
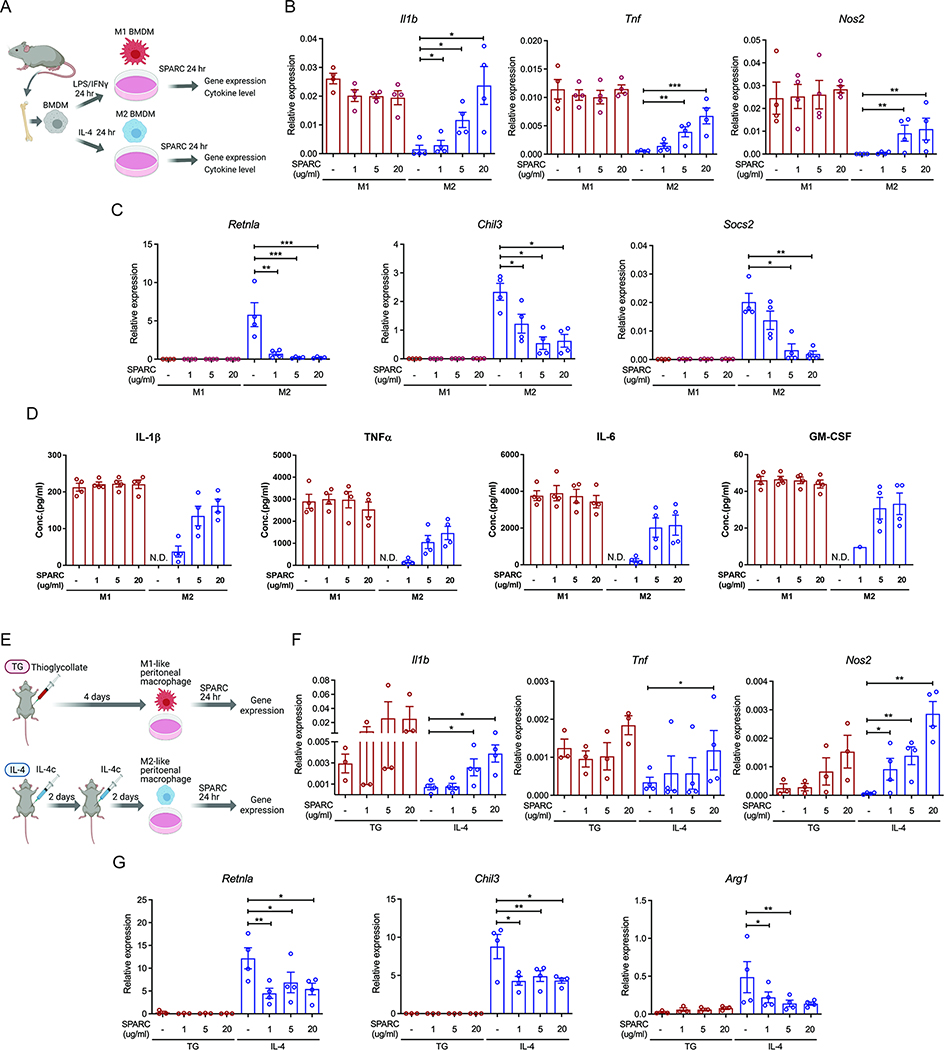
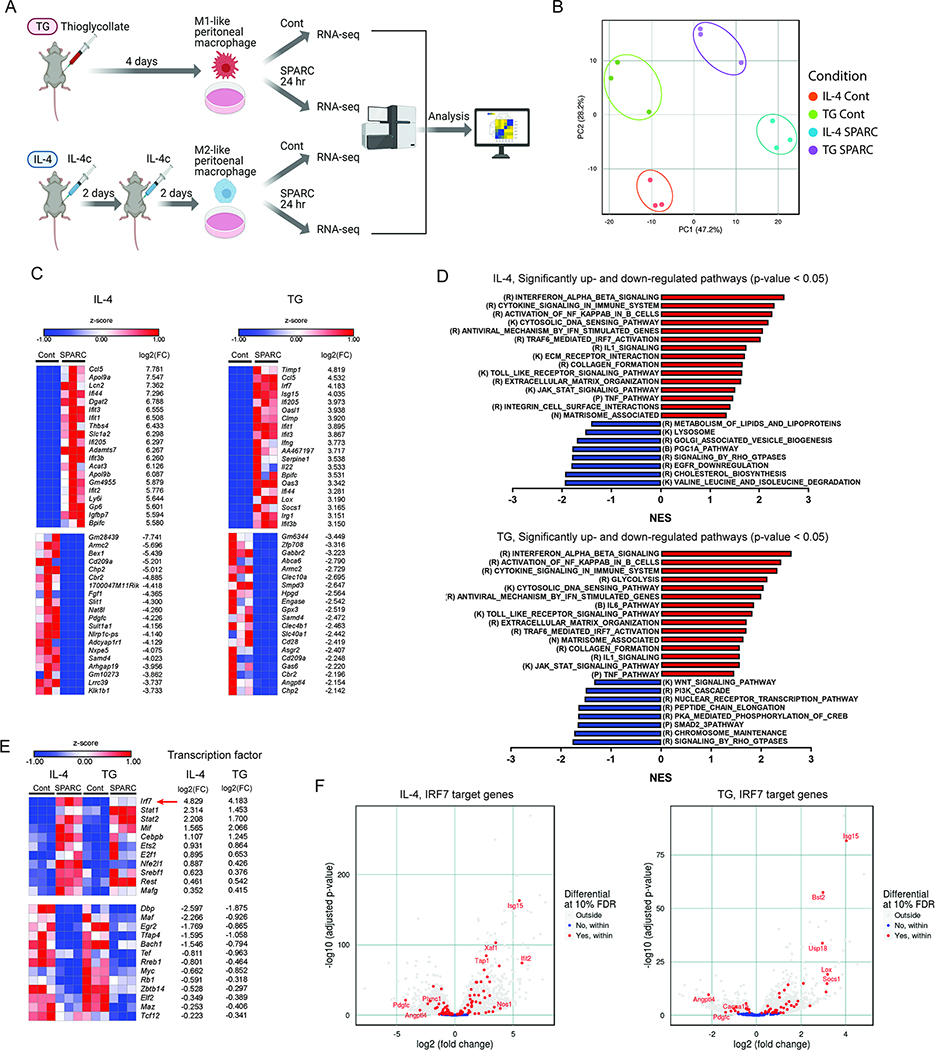
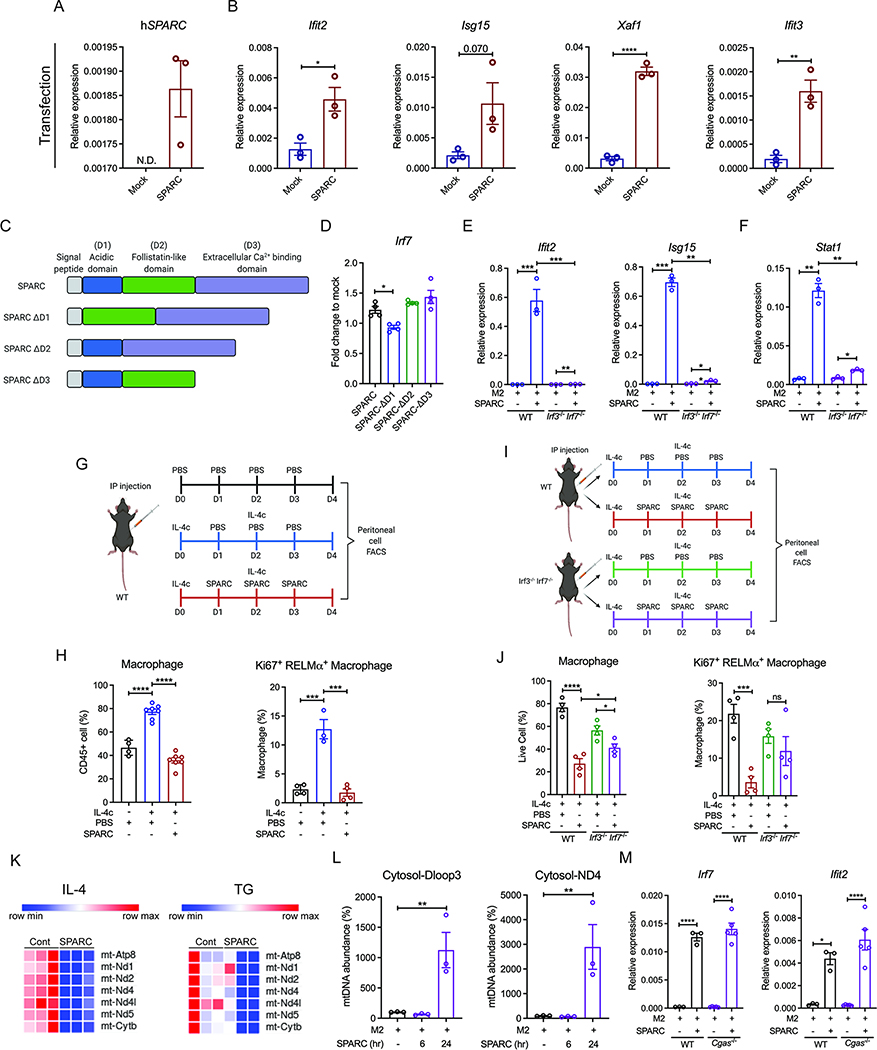
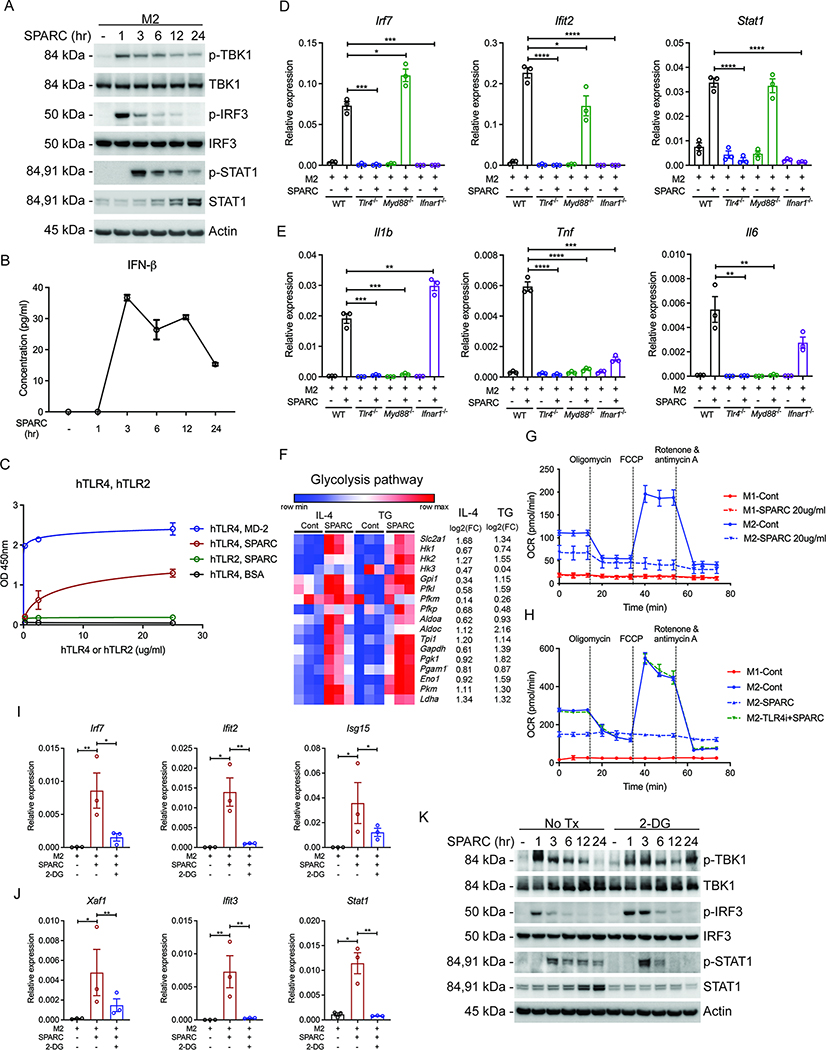
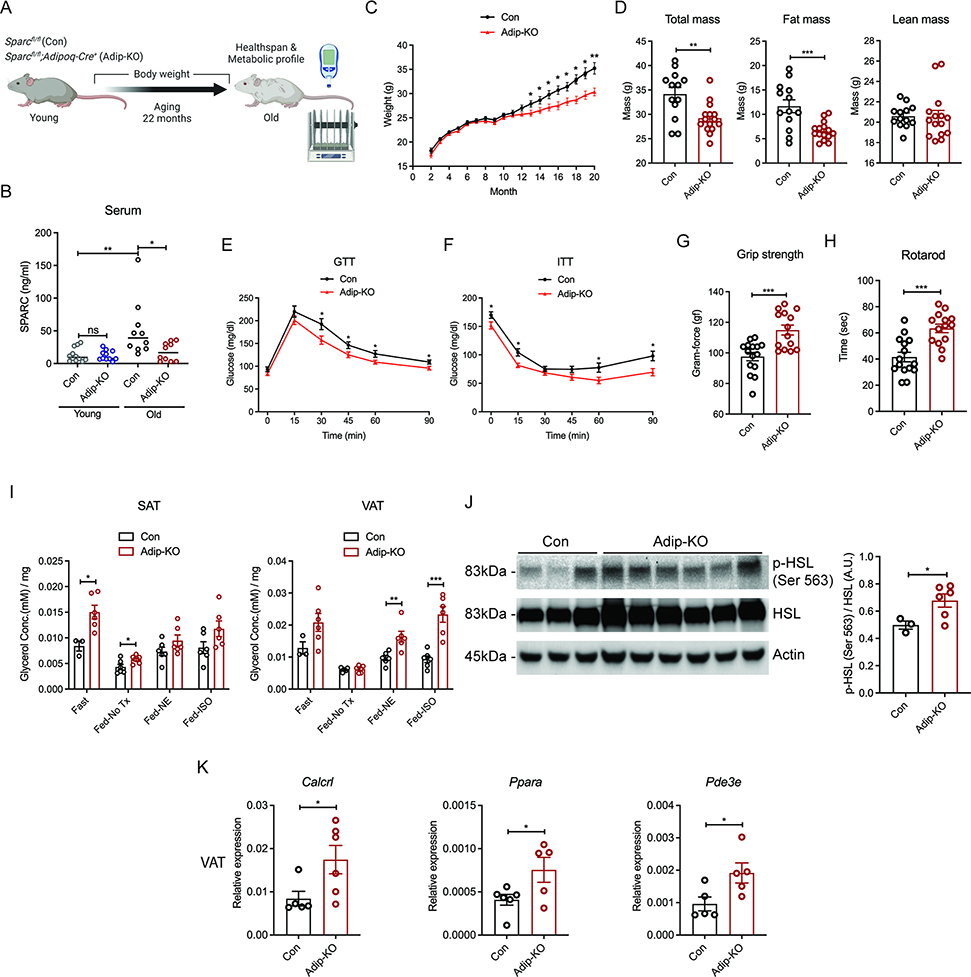
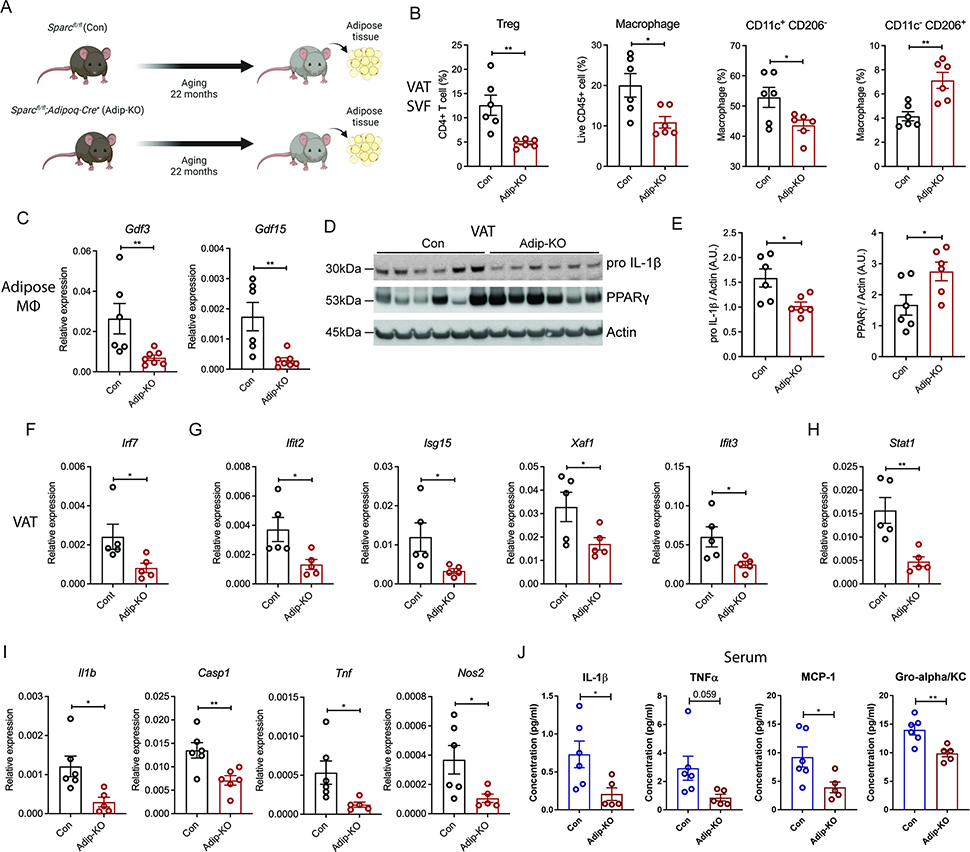
The risk of chronic diseases caused by aging is reduced by caloric restriction (CR)-induced immunometabolic adaptation. Here, we found that the matricellular protein, secreted protein acidic and rich in cysteine (SPARC), was inhibited by 2 years of 14% sustained CR in humans and elevated by obesity. SPARC converted anti-inflammatory macrophages into a pro-inflammatory phenotype with induction of interferon-stimulated gene (ISG) expression via the transcription factors IRF3/7. Mechanistically, SPARC-induced ISGs were dependent on toll-like receptor-4 (TLR4)-mediated TBK1, IRF3, IFN-β, and STAT1 signaling without engaging the Myd88 pathway. Metabolically, SPARC dampened mitochondrial respiration, and inhibition of glycolysis abrogated ISG induction by SPARC in macrophages. Furthermore, the N-terminal acidic domain of SPARC was required for ISG induction, while adipocyte-specific deletion of SPARC reduced inflammation and extended health span during aging. Collectively, SPARC, a CR-mimetic adipokine, is an immunometabolic checkpoint of inflammation and interferon response that may be targeted to delay age-related metabolic and functional decline.

Keywords: SPARC; TLR4; caloric restriction; inflammation; interferon-stimulated gene; macrophage; matricellular protein.


Conflict of interest statement

Declaration of interests The authors declare no competing interests.

Figures

Figure 1.
Figure 1.. Excess adipokine SPARC causes macrophage-derived inflammation
(A) Schematic of human calorie restriction (CR) study. Clinical data and adipose RNA-sequencing results of baseline, 1 year, and 2 years post CR were used for analysis. (B) Expression pattern of significantly up-and down-regulated genes involved in matrisome post 1 year and 2 years of CR. Arrows indicate matricellular proteins, including SPARC (red). (C) Normalized expression amounts of SPARC from RNA-sequencing analysis before and after CR. (D) Correlation analysis between the percentage of SPARC expression change and percentage of phenotype changes, including Leptin, CRP (upper), TNFα, and ICAM1 (lower) concentration of participants after 1 year CR. (E) SPARC concentrations in the plasma of lean and obese individuals (n=8, 13). (F) Q-PCR analysis for pro-inflammatory gene (Il1b, Tnf, and Il6) expression in M0 BMDMs after SPARC treatment with indicated concentration (1, 5, and 20 μg/ml) for 24 hours (n=5). (G) Schematic of flow cytometry analysis with adipose tissue macrophages (ATMs). (H-J) Quantification of flow cytometry analysis for the macrophages proportion (H, I) and MFI in macrophages (J) with or without ex vivo 20 μg/ml SPARC treatment for 24 hours (n=3). All in vitro or ex vivo experiments were repeated independently at least twice. Error bars represent the mean ± S.E.M. Pearson correlation analysis, two-tailed paired and unpaired t-tests were performed for statistical analysis. * P < 0.05; ** P < 0.01; *** P < 0.001; **** P < 0.0001. Please also see Figure S1.
Figure 2.
Figure 2.. SPARC switches M2 macrophages to pro-inflammatory macrophages
(A) Schematic of BMDM experiments with SPARC treatment. (B, C) Q-PCR analysis for pro-inflammatory genes (Il1b, Tnf, and Nos2) (B) and M2 macrophage genes (Retnla, Chil3, and Socs2) (C) in M1 and M2 polarized BMDMs. (D) Luminex assay to detect pro-inflammatory cytokines in supernatants of SPARC treated M1 and M2 polarized BMDMs (n=4). N.D. is non-detected. (E) Schematic of peritoneal macrophage experiments with SPARC treatment. (F, G) Gene expression analysis by Q-PCR for pro-inflammatory genes (F) and M2 macrophage genes (G) in control and ex vivo SPARC treated peritoneal macrophages from thioglycollate (TG) or IL-4 complex injected (IL-4) mice (n=3, 4 each). All in vitro or ex vivo experiments were repeated independently at least twice. Error bars represent the mean ± S.E.M. Two-tailed paired t-tests were performed for statistical analysis. * P < 0.05; ** P < 0.01; *** P < 0.001. Please also see Figure S1.
Figure 3.
Figure 3.. Transcriptomic signature of the interferon-stimulated gene is induced by SPARC
(A) Schematic of experimental design for RNA-sequencing analysis to determine the impact of SPARC on peritoneal macrophages. (B) PCA analysis of RNA-sequencing results of controls and ex vivo SPARC treated peritoneal macrophages from thioglycollate (TG Cont and TG SPARC), or IL-4 complex injected (IL-4 Cont and IL-4 SPARC) mice (n=3 each). (C) Top 20 significantly up-and down-regulated genes in SPARC treated peritoneal macrophages from IL-4 complex injected (IL-4, left), and thioglycollate injected (TG, right) mice compared to each control (Cont). (D) Significantly up-and down-regulated pathways (p < 0.05) in SPARC treated peritoneal macrophages from IL-4 complex injected (IL-4, upper) and thioglycollate injected (TG, lower) mice by GSEA. R, K, P, N, B refer to pathways in Reactome, KEGG, PID, NABA, BioCarta database. (E) Significantly differentially expressed common transcription factors in SPARC treated macrophages from both IL-4 complex injected (IL-4, left) and thioglycollate injected (TG, right) mice. The red arrow indicates the top transcription factor IRF7. (F) IRF7 regulated, significantly changed genes in SPARC treated macrophages from IL-4 complex injected (IL-4, left) and thioglycollate injected (TG, right) mice. Please also see Figure S2.
Figure 4.
Figure 4.. SPARC upregulates the expression of ISGs via IRF3 and IRF7 signaling
(A, B) Q-PCR analysis for human SPARC (A) and ISGs (B) in RAW 264.7 cells with mock or SPARC transient transfection. (C) Schematic of constructs used for transfection experiments with intact and deletion of specific domains (D1, D3, D3) of SPARC. (D) Q-PCR analysis for Irf7 in SPARC and domain deleted SPARC (D1, D2, D3) transfected RAW 264.7 cell lines (n=4). Fold changes were calculated based on mock vector-transfected RAW 264.7 cell lines. (E, F) Q-PCR analysis for ISGs (E), Stat1 (F) in M2 polarized BMDMs from wide-type (WT) and Irf3−/− Irf7−/− mice with or without 20 μg/ml SPARC treatment for 24 hours (n=3). (G) Schematic of IL-4c and SPARC co-injection experiments used to perform FACS analysis of peritoneal cells. (H) Quantification of flow cytometry analysis for macrophages (n=4, 8, 8) and proliferating M2 macrophages (n=4, 3, 4) in PBS, IL-4c with PBS, or IL-4c with SPARC injected mice. (I) Schematic of IL-4c and SPARC co-injection experiments used to perform FACS analysis of peritoneal cells from WT controls and Irf3−/− Irf7−/− mice. (J) Quantification of flow cytometry analysis for macrophages and proliferating M2 macrophages in peritoneal cells from IL-4c with PBS or IL-4c with SPARC injected WT and Irf3−/− Irf7−/− mice (n=4). (K) Expression pattern for mitochondrial genes in RNA-sequencing analysis of peritoneal macrophages from IL-4c injected (IL-4), and thioglycollate injected (TG) mice with or without SPARC treatment ex vivo (n=3). (L) Cytosolic mitochondrial DNA abundance measurement in M2 BMDMs with or without SPARC treatment for 6 and 24 hours by Q-PCR for Dloop3 and ND4 (n=3). (M) Q-PCR analysis for Irf7 and ISG Ifit2 in M2 BMDMs from WT and Cgas−/− mice with or without SPARC treatment (20 μg/ml) for 24 hours (n=3, 5). All in vitro or ex vivo experiments were repeated independently at least twice. Error bars represent the mean ± S.E.M. Two-tailed paired and unpaired t-tests were performed for statistical analysis. * P < 0.05; ** P < 0.01; *** P < 0.001; **** P < 0.0001. Please also see Figure S3, 4.
Figure 5.
Figure 5.. SPARC-mediated ISG induction is through TLR4 activation
(A) Immunoblot analysis for activated interferon signaling proteins (p-TBK1, p-IRF3, and p-STAT1) in M2 BMDMs with the treatment of 20 μg/ml SPARC for 1, 3, 6, 12, and 24 hours as well as non-treated control. (B) ELISA assay for IFN-β detection in supernatants of SPARC treated M2 BMDMs in (A) (n=3). (C) Solid-phase binding assay to detect the interaction between SPARC and human TLR4 (hTLR), SPARC and human TLR2 (hTLR2), SPARC and human MD-2 (MD-2), SPARC and BSA (BSA). The indicated amount of TLR4s or TLR2s were coated on plates, and 20 μg/ml SPARC, MD-2, or BSA were added for interaction (n=3). Nonlinear regression analyses were performed for the values in the graph. (D, E) Q-PCR analysis for Irf7, Ifit2, Stat1 (D), and pro-inflammatory genes (E) in M2 polarized BMDMs from WT, Tlr4−/−, Myd88−/−, and Ifnar1−/− mice with or without SPARC (20 μg/ml) treatment (n=3). (F) Expression pattern of glycolysis pathway genes in RNA-sequencing analysis of peritoneal macrophages induced by IL-4c (IL-4) and thioglycollate (TG) injection with or without SPARC treatment ex vivo (n=3). (G) Oxygen consumption rate (OCR) for M1 and M2 BMDMs with or without SPARC (20 μg/ml) treatment measured by seahorse mitostress assay (n=3). (H) Oxygen consumption rate (OCR) of M1, M2, and 20 μg/ml SPARC treated M2 BMDMs with or without pre-treatment of TLR4 inhibitor, TAK-242 (2.5 μM). (I, J) Gene expression analysis of Irf7, ISGs, and Stat1 in non-teated and SPARC (20 μg/ml, 24 hours) treated M2 BMDMs with or without pre-treatment of glycolysis inhibitor (2-DG, 10 mM) (n=3). (K) Immunoblot analysis for activated interferon signaling proteins (p-TBK1, p-IRF3, and p-STAT1) in M2 polarized BMDMs treated with SPARC (20 μg/ml) for indicated time with or without pre-treatment of glycolysis inhibitor (2-DG, 10 mM) (n=3). All in vitro or ex vivo experiments were repeated independently at least twice. Error bars represent the mean ± S.E.M. Two-tailed paired and unpaired t-tests were performed for statistical analysis. * P < 0.05; ** P < 0.01; *** P < 0.001; **** P < 0.0001. Please also see Figure S5.
Figure 6.
Figure 6.. Reduction of adipokine SPARC improves healthspan during aging.
(A) Schematic of experiment with Sparcfl/fl (Con) and Sparcfl/fl;Adipoq-Cre+ (Adip-KO) mice with age over 20 months. (B) ELISA assay of circulating SPARC amounts from young (2-month-old) and old (20-month-old) control and Adip-KO mice by ELISA assay (n=12, 12, 10, 10) (C) Weight change of control and Adip-KO mice with age over 20 month (n=13, 15). (D) Body composition of 20-month-old control and Adip-KO mice measured by MRI (n=13, 15). (E) GTT and (F) ITT of 20-month-old control and Adip-KO mice (n=13, 15). (G, H) Healthspan test results of 21-month-old control and Adip-KO mice (n=14, 14). Grip strength test (G) and rotarod test (H) are shown. (I) Glycerol measurement with supernatants of adipose explants (SAT and VAT) derived from 22-month-old control and Adip-KO mice fed or fasted for 24h and stimulated with NE and isoproterenol ex vivo (n=6, 6). (J) Western-blot analysis of p-HSL in VAT explants from 22-month-old control and Adip-KO mice after 24 hour of fasting. (n=3, 6). (K) Q-PCR analysis for Calcrl, Pde3e and Ppara genes in VAT of 22-month-old control and Adip-KO mice (n=6, 5). All ex vivo and in vitro experiments were repeated independently at least twice. Error bars represent the mean ± S.E.M. Two-tailed unpaired and t-tests were performed for statistical analysis. * P < 0.05; ** P < 0.01; *** P < 0.001. Please also see Figure S6.
Figure 7.
Figure 7.. Inhibition of adipocyte-derived SPARC reduces age-related increase in chronic interferon response and inflammation
(A, B) Schematic and FACS quantification of immune cell population in stromal vascular fraction (SVF) of VAT from 22-month-old control and Sparc Adip-KO mice (n=6, 6). Treg (CD4+CD25+Foxp3+), macrophage, CD11c+ CD206- macrophage, and CD11c- CD206+ macrophage were identified by flow cytometry. (C) Q-PCR analysis for GDF3 and GDF15 from ATMs of 22-month-old control and Adip-KO mice (n=6, 7). (D, E) Immunoblot analysis of pro IL-1β and PPARγ in VATs from 22-month-old control and Adip-KO mice (n=6, 6) and quantification. (F-I) Q-PCR analysis of Irf7 (F), ISGs (G), Stat1 (H), and pro-inflammatory genes (I) in VAT of 22-month-old control and Adip-KO mice (n=6, 5). (J) Serum concentration of inflammatory cytokines in 22-month-old control and Adip-KO mice (n=6, 5). All ex vivo and in vitro experiments were repeated independently at least twice. Error bars represent the mean ± S.E.M. Two-tailed unpaired t-tests were performed for statistical analysis. * P < 0.05; ** P < 0.01. Please also see Figure S7.

Comment in

References

    1. Adler MI, Cassidy EJ, Fricke C, and Bonduriansky R (2013). The lifespan-reproduction trade-off under dietary restriction is sex-specific and context-dependent. Exp Gerontol 48, 539–548. - PubMed
    1. Bai J, Cervantes C, Liu J, He S, Zhou H, Zhang B, Cai H, Yin D, Hu D, Li Z, et al. (2017). DsbA-L prevents obesity-induced inflammation and insulin resistance by suppressing the mtDNA release-activated cGAS-cGAMP-STING pathway. Proceedings of the National Academy of Sciences 114, 12196–12201. - PMC - PubMed
    1. Bapat SP, Myoung Suh J, Fang S, Liu S, Zhang Y, Cheng A, Zhou C, Liang Y, LeBlanc M, Liddle C, et al. (2015). Depletion of fat-resident Treg cells prevents age-associated insulin resistance. Nature 528, 137–141. - PMC - PubMed
    1. Benayoun BA, Pollina EA, Singh PP, Mahmoudi S, Harel I, Casey KM, Dulken BW, Kundaje A, and Brunet A (2019). Remodeling of epigenome and transcriptome landscapes with aging in mice reveals widespread induction of inflammatory responses. Genome Res 29, 697–709. - PMC - PubMed
    1. Bornstein P (1995). Diversity of function is inherent in matricellular proteins: an appraisal of thrombospondin 1. J Cell Biol 130, 503–506. - PMC - PubMed

Publication types