. 2022 Sep 26;32(18):3952-3970.e8.
doi: 10.1016/j.cub.2022.07.038. Epub 2022 Aug 12.

Gliotransmission of D-serine promotes thirst-directed behaviors in Drosophila

Affiliations

Gliotransmission of D-serine promotes thirst-directed behaviors in Drosophila

Annie Park et al. Curr Biol. .

Abstract

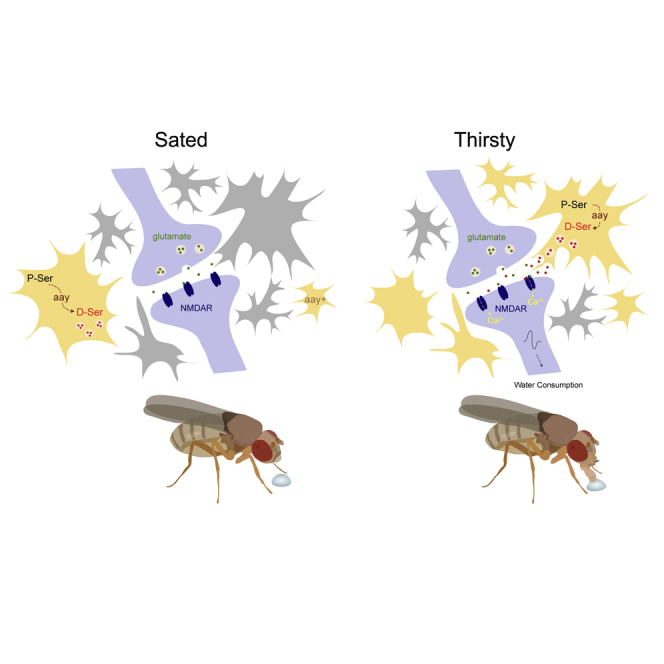
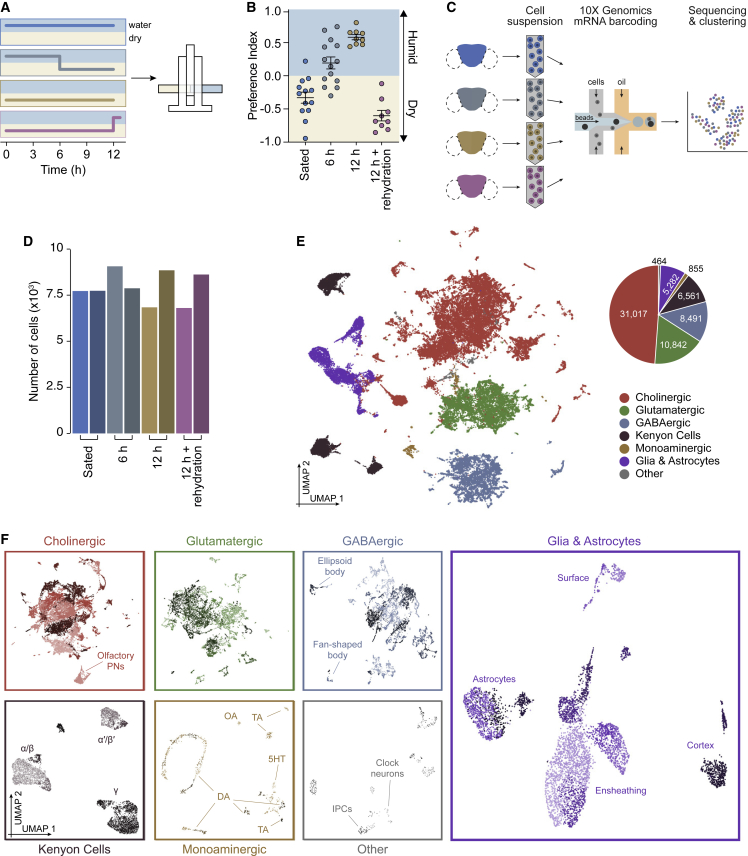
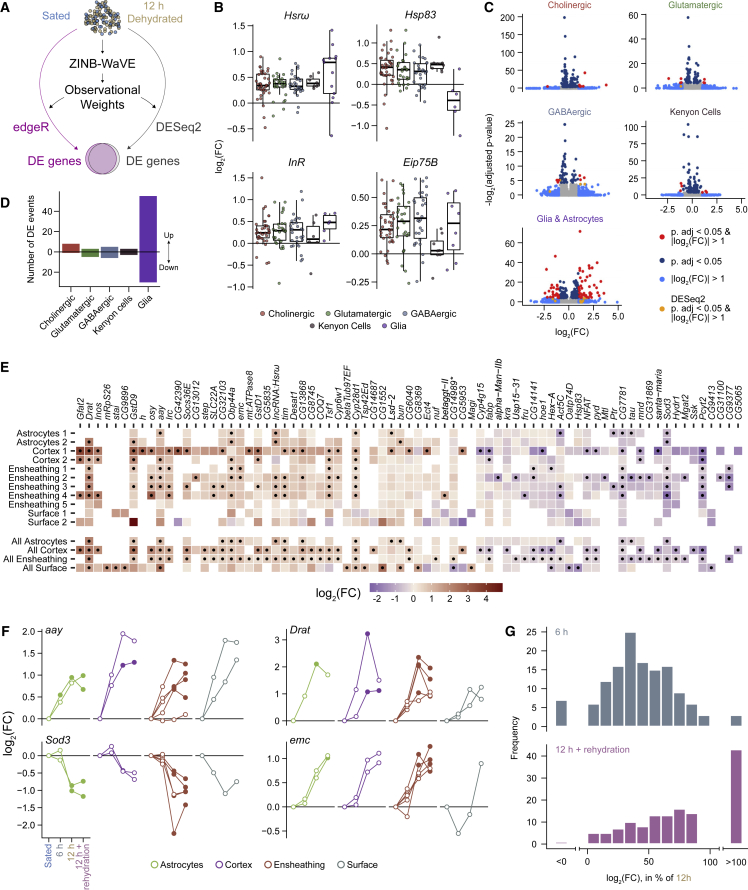
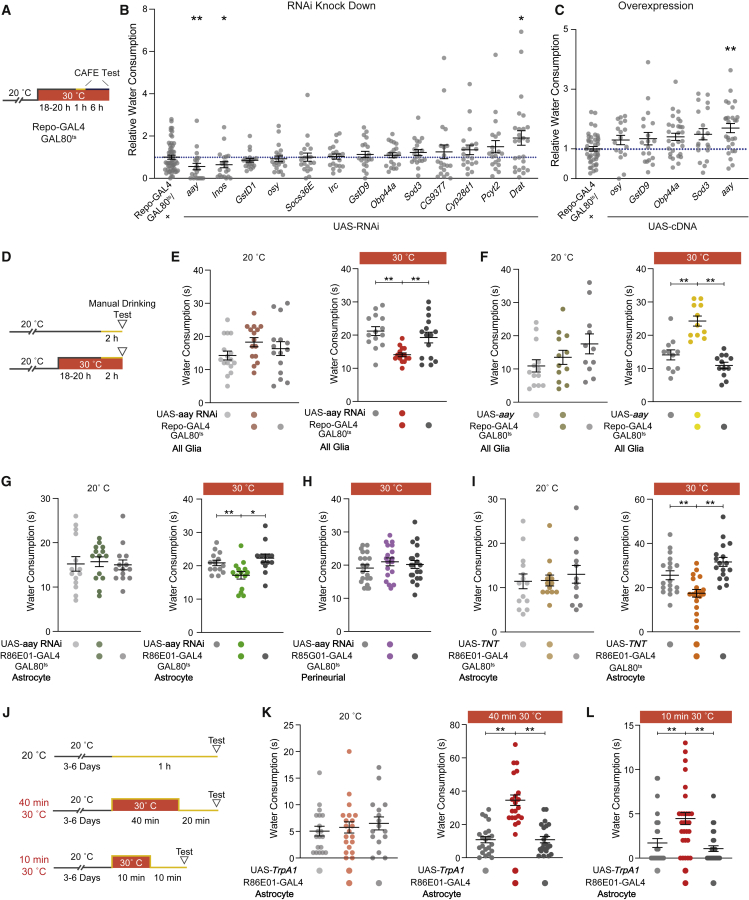
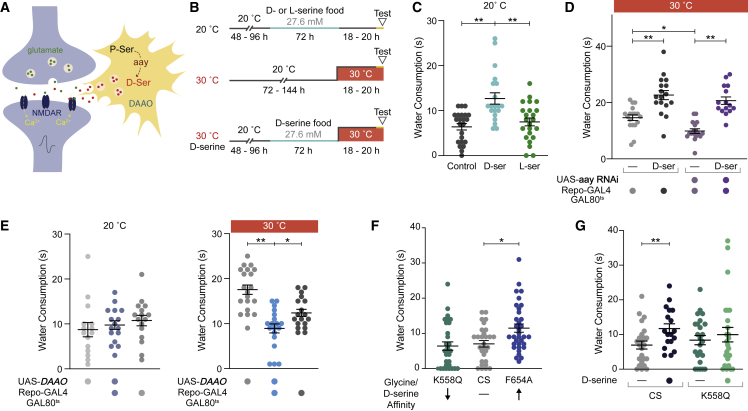
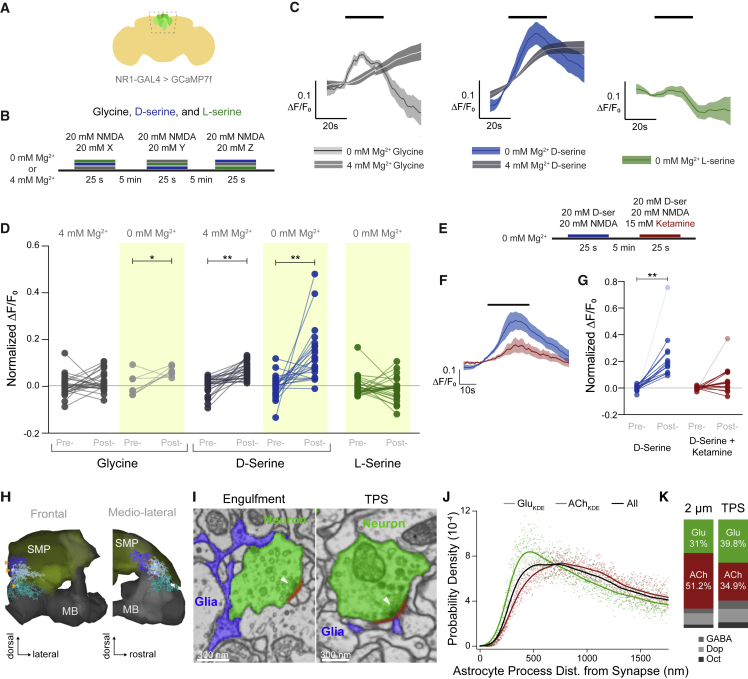
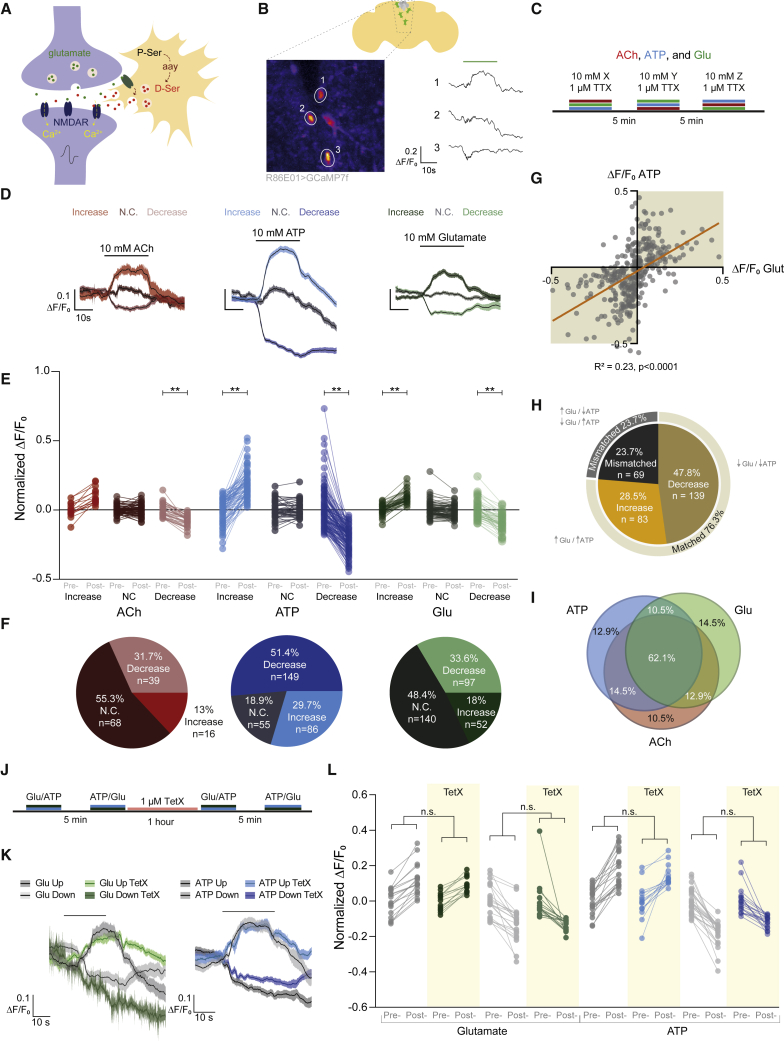
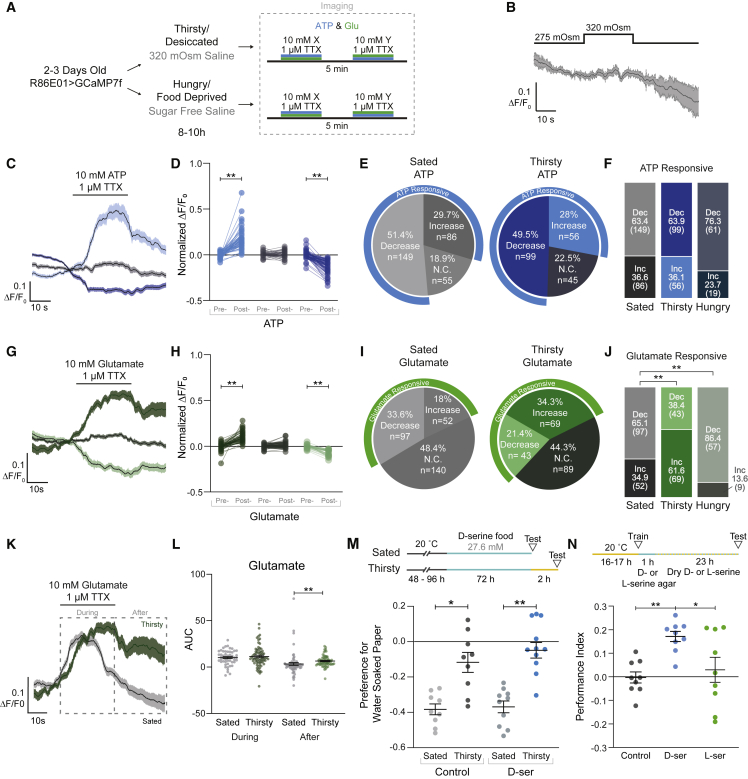
Thirst emerges from a range of cellular changes that ultimately motivate an animal to consume water. Although thirst-responsive neuronal signals have been reported, the full complement of brain responses is unclear. Here, we identify molecular and cellular adaptations in the brain using single-cell sequencing of water-deprived Drosophila. Water deficiency primarily altered the glial transcriptome. Screening the regulated genes revealed astrocytic expression of the astray-encoded phosphoserine phosphatase to bi-directionally regulate water consumption. Astray synthesizes the gliotransmitter D-serine, and vesicular release from astrocytes is required for drinking. Moreover, dietary D-serine rescues aay-dependent drinking deficits while facilitating water consumption and expression of water-seeking memory. D-serine action requires binding to neuronal NMDA-type glutamate receptors. Fly astrocytes contribute processes to tripartite synapses, and the proportion of astrocytes that are themselves activated by glutamate increases with water deprivation. We propose that thirst elevates astrocytic D-serine release, which awakens quiescent glutamatergic circuits to enhance water procurement.

Keywords: D-serine; Drosophila; NMDA receptors; astrocytes; behavior; glia; gliotransmission; single-cell transcriptomics; thirst; water procurement.


Conflict of interest statement

Declaration of interests S.W. is a member of the advisory board of Current Biology.

Figures

None
Graphical abstract
Figure 1
Figure 1
Single-cell transcriptomics of thirsty Drosophila (A) Schematic protocols for humidity preference assay. Flies were kept in vials with or without water for the indicated times, then given a T-maze choice between a humid and a dry chamber. (B) Increasing dehydration converts humidity avoidance behavior into attraction. Attraction returns to avoidance with thirst quenching. (C) Schematic of the process of single-cell transcriptomics analyses comparing flies from the four conditions in (B). Two independent samples were processed for each condition. (D) Total number of cells obtained from each sample, after filtration of low-quality barcodes and doublets. (E) Left: UMAP plot from first clustering step, and identification of seven main cell classes. Right: pie chart showing the number of cells obtained from each of these classes. (F) UMAP plots showing sub-clustering of each of the seven cell classes shown in (E). Known cell types within each class are labeled. Kenyon cell labels represent known subtypes that innervate corresponding mushroom body lobes. Withing the monoaminergic cells labels are OA, octopaminergic; TA, tyraminergic; 5HT, serotonergic; DA, dopaminergic. Within other, IPCs, insulin-producing cells. See also Figure S1.
Figure 2
Figure 2
The transcriptional signature of thirst in the fly brain (A) Schematic of differential expression analysis. Observational weights calculated with ZINB-WaVE were used in edgeR and DESeq2 to correct for zero-inflation. (B) Boxplots showing differential expression of the four genes most broadly regulated in each cluster after 12 h dehydration, grouped by main cell class. (C) Volcano plots representing statistical significance against fold change for all genes tested in cholinergic neurons, glutamatergic neurons, GABAergic neurons, Kenyon cells, and glia, calculated with edgeR. Each plot represents pooled data from all clusters in each cell class. Genes with adjusted p value < 0.05 and |log2(FC)| > 1 in DESeq2 but not edgeR are labeled orange. (D) Number of differential expression events identified in the five cell classes shown in (C). Values above the bar represent genes upregulated in thirsty flies and below the bar represents downregulated genes. (E) Heatmap showing fold change for each of the most regulated genes in glia, for each cluster (top) and for clusters grouped by glia type (bottom), calculated with edgeR. Black dots: adjusted p value < 0.05. Empty tiles: transcript levels below detection threshold. : CG14989 is the only gene significantly upregulated and downregulated in different clusters. (F) Changes in expression for four differentially expressed genes across glia clusters, and through all four hydration conditions. In most cases, expression gradually increases or decreases during dehydration. After rehydration, mRNA levels tended to remain similar to levels measured in dehydrated flies. Full circles indicate adjusted p value < 0.05, and empty circles indicate adjusted p value ≥ 0.05. (G) Comparisons of log2(FC) values (versus sated controls) after 6 h dehydration (top) or after rehydration (bottom), as a percentage of log2(FC) values after 12 h dehydration. Percentages were calculated for each of the significant gene-cluster pairs shown in (E) (black dots) and represented in histograms in 10% increments. Changes in expression are lower (<100%) after 6 h than after 12 h dehydration (top) for most genes. However, expression of many genes remains high (>100%) after thirsty flies are allowed to drink (bottom). See also Figure S2.
Figure 3
Figure 3
Astrocytic aay is a novel regulator of water consumption (A) Schematic for temperature control of GAL80ts/GAL4 driven expression of UAS-RNAi or UAS-cDNA transgenes with CAFE test. Orange section of line indicates period of water restriction. (B) Water consumption in the CAFE assay of flies with RNAi knock down of candidate genes. Dotted blue line indicates normalization to control Repo-GAL4 flies, equal to 1. p < 0.05, ∗∗p < 0.01 two-tailed Mann-Whitney test nRNAi = 20–25, nRepo-GAL4 = 50. (C) Water consumption in CAFE for UAS overexpression of targets. ∗∗p < 0.01 two-tailed Mann-Whitney test nRNAi = 17–29, nRepo-GAL4 = 43. (D) Schematic for temperature control of GAL80ts/GAL4-driven UAS-RNAi or UAS-cDNA transgenes with manual water feeding assay. Orange section of line indicates period of water restriction. (E) RNAi knockdown of aay reduces water consumption (n = 14–16). (F) Overexpression of aay increases water consumption (n = 11–13). (G) Astrocyte-specific RNAi knockdown of aay reduces water consumption (n = 13 and 14). (H) RNAi knockdown of aay in perineurial glia does not alter water consumption (n = 18–20). (I) Preventing vesicular transmission with tetanus-toxin (TNT) expression in astrocytes reduces water consumption (n = 12–19). (J) Temperature regimen for TrpA1 activation of astrocytes in (K) and (L). Orange section of line indicates period of water restriction. (K) Astrocyte activation for 40 min increases water consumption (n = 16–22). ∗∗p < 0.01, Kruskal-Wallis ANOVA with Dunn’s multiple comparisons test. (L) Astrocyte activation for 10 min increases water consumption (n = 28–30). ∗∗p < 0.01, Kruskal-Wallis ANOVA with Dunn’s multiple comparisons test. Normality was assessed using Shapiro-Wilk test. p < 0.05, ∗∗p < 0.01, ∗∗∗p < 0.001, ∗∗∗∗p < 0.0001 Ordinary one-way ANOVA with Dunnett’s multiple comparisons test, unless otherwise stated. Individual data points are single flies. Data are mean ± standard error of the mean (SEM). See also Figure S3.
Figure 4
Figure 4
D-serine modulates water consumption via NMDARs (A) Model of tripartite glutamatergic synapse showing aay-dependent synthesis of D-serine in astrocytes. (B) Protocol for D-serine feeding and RNAi induction with water consumption experiments. (C–G) Light blue section of lines indicate time on D- or L-serine food. Orange section of lines indicate period of water restriction. (C) D- but not L-serine feeding increases water consumption (n = 20–23). ∗∗p < 0.01, Kruskal-Wallis ANOVA with Dunn’s multiple comparisons test. (D) D-serine feeding rescues the water consumption defect in flies with aay knockdown (n = 15–18). p < 0.05, ∗∗p < 0.01, ordinary one-way ANOVA with Dunnett’s multiple comparisons test. (E) Glial overexpression of D-amino acid oxidase (DAAO) reduces water consumption (n = 16–20). p < 0.05, ∗∗p < 0.01, ordinary one-way ANOVA with Dunnett’s multiple comparisons test. (F) Flies harboring the F654A single site mutation in NMDAR1 exhibit increased water consumption. This mutation increases affinity for glycine/D-serine (n = 29–34). p < 0.05, Kruskal-Wallis ANOVA with Dunn’s multiple comparisons test. (G) Flies harboring the K558Q amino acid substitution in NMDAR1 are insensitive to the D-serine induced increase in water consumption (n = 18–25). ∗∗p < 0.01, two-tailed Mann-Whitney test. Individual data points are single flies. Data are mean ± SEM. See also Figure S4.
Figure 5
Figure 5
Astrocytes form tripartite synapses and D-serine is a co-agonist for NMDARs (A) Illustration of imaging window for recording of Ca2+ responses in NMDAR1 expressing PI neurons. (B) Protocol of drug application for (C) and (D). Order of application was randomized for each fly. (C) Average traces for glycine, D-serine, and L-serine application in 0 or 4 mM Mg2+ (ngly = 8, 25; nD-ser = 25, 26; nL-ser = 28, respectively). Line is a moving average and shaded band is SEM. (D) D-serine, but not L-serine, activates NR1+ PI neurons (from left to right, n = 25, 25, 8, 8, 25, 25, 23, 23, 28, and 28). p < 0.05, ∗∗p < 0.001, Kruskal-Wallis ANOVA with Dunn’s multiple comparisons test. (E) Protocol for ketamine application with NMDA, TTX, and D-serine. (F) Averaged traces for D-serine and NMDA (blue) and D-serine, NMDA, and ketamine (red) (n = 15). (G) Ketamine inhibits D-serine induced activation of NR1+ PI neurons. ∗∗p < 0.01, Kruskal-Wallis ANOVA with Dunn’s multiple comparisons test. Transparent dots indicate outliers that are >2 SD from the mean. When outliers are excluded from the analysis, the relationship still holds (see Figure S5F). (H) Astrocytes tile the SMP. 3D representation of three astrocytes (shades of blue) reconstructed from EM data shown with the mushroom body neuropil (gray) and the SMP neuropil (yellow), shown in frontal and lateral views. Cell bodies are located outside the neuropil (yellow arrow heads), and processes in the neuropil have little overlap (). (I) Astrocytes engulf synaptic boutons and contribute processes to tripartite synapses (TPSs). Grayscale EM data with labeled glutamatergic boutons (green) and glial processes (blue). Presynaptic densities (arrow) and synaptic cleft (red) are indicated. Left: example where glial processes contact a large proportion of a bouton’s membrane but not the synapse. Right: example of a glial process directly adjacent to the synaptic cleft and opposite the presynaptic density (white arrow head). (J) Astrocytic processes are significantly closer to glutamatergic than cholinergic synapses in the SMP. Kernel density estimates (lines) of the probability distributions (points) of distances of Glu or Ach synapses or a random draw from both sets to 3 SMP based astrocytes. Only synapses in direct vicinity (2 μm radius around processes <600 nm thick) are considered. Statistical analyses shown in Figure S5. (K) Glutamatergic synapses are overrepresented in tripartite synapses versus their representation in synapses in the general 2 μm vicinity of astrocytic processes. Ratios of synapses by predicted neurotransmitter usage are shown. See also Figure S5 and Video S1 for anatomy of astrocyte processes engulfing a presynapse and contributing to TPS.
Figure 6
Figure 6
Astrocytes are differentially responsive to neurotransmitters (A) Illustration of possible glutamate-evoked D-serine release from astrocytes. (B) Astrocytes adjacent to the pars intercerebralis show differential responses to glutamate application (green bar). (C) Protocol for drug application with randomized order for acetylcholine (ACh), ATP, and glutamate (Glu). (D) Average traces for ACh, ATP, and glutamate partitioned by the type of response (activated, no change, or inhibited). Responses were determined as follows: activated if μpost-drug > σpre-drug + μpre-drug, no change if μpost-drug fell within σpre-drug + μpre-drug and inhibited if μpost-drug < σpre-drug − μpre-drug. Line is smoothed average and shaded band is SEM. (E) Neurotransmitters induce both excitatory and inhibitory responses in astrocytes. Paired datapoints represent responses from a single astrocyte, and group is assembled from multiple flies (nAch = 16, 68, 39; nATP = 86, 55, 149; nglut = 52, 140, 97). ∗∗p < 0.01, Kruskal-Wallis ANOVA with Dunn’s multiple comparisons test. (F) Proportions of astrocytes sorted by response direction following acetylcholine, ATP, and glutamate application. (G) Average ΔF/F0 during drug application for glutamate plotted against ΔF/F0 for ATP shows most astrocytes that are excited by glutamate are also excited by ATP and vice versa. (H) Astrocytes are more likely to have matched responses between glutamate and ATP. Chi-square test between matched versus mismatched astrocytes. Fisher’s exact test matched versus mismatched p = 2.35e−11, OR = 3.24. (I) Venn diagram showing considerable overlap of matched responses of astrocytes to all three neurotransmitters. (J) Protocol for tetanus toxin (TetX) application. (K) Average traces for glutamate- and ATP-evoked excitatory and inhibitory responses with and without TetX. Line is smoothed average and shaded band SEM. (L) Blocking vesicular transmission does not suppress astrocyte responses to transmitter application (left to right, nPre-TetXATP = 21, 6; nPost-TetXATP = 16, 35; nPre-TetXGlut = 18, 11; nPost-TetXGlut = 14, 9). n.s. > 0.05 Kruskal-Wallis ANOVA with Dunn’s multiple comparisons test. Individual data points are single astrocytes across multiple animals. See also Figure S6.
Figure 7
Figure 7
Water deprivation changes physiological properties of astrocytes (A) Protocol for water and food deprivation with calcium imaging experiments. (B) Acute exposure of high osmolarity saline does not induce a calcium response in astrocytes. (C) Average traces for ATP partitioned by response type in thirsty flies. Line is smoothed average and shaded band is SEM. (D) Responses pre- and post-treatment of ATP separated by categorical responses in water-deprived flies. ∗∗p < 0.01, Kruskal-Wallis ANOVA with Dunn’s multiple comparisons test. (E) Proportion of astrocyte responses to ATP application in sated and thirsty flies. (F) Astrocyte responses to ATP do not change with deprivation states. n.s. > 0.05 Fisher’s exact test with Bonferroni correction. (G) Average traces for glutamate partitioned by response type in thirsty flies. Line is smoothed average and shaded band SEM. (H) Responses pre- and post-treatment of glutamate separated by categorical responses in water-deprived flies. ∗∗p < 0.01, Kruskal-Wallis ANOVA with Dunn’s multiple comparisons test. (I) Proportions of astrocyte responses type to glutamate application in sated and thirsty flies. (J) Deprivation states differentially regulate astrocyte responsivity to glutamate application. The number of glutamate responsive astrocytes increases in thirsty flies and decreases in hungry flies. ∗∗p < 0.01, Fisher’s exact test with Bonferroni correction. (K) Excitatory astrocyte responses to glutamate application are prolonged in thirsty animals. (L) Area under the curve (AUC) of sections of traces marked in (K). ∗∗p < 0.01, Kruskal-Wallis ANOVA with Dunn’s multiple comparisons test. (M) Flies pre-fed D-serine do not show differences in innate water seeking in the T-maze. p < 0.05, ∗∗p < 0.01, Kruskal-Wallis ANOVA with Dunn’s multiple comparisons test. (N) Flies fed D-serine between training and testing show increased water memory performance. p < 0.05, ∗∗p < 0.01, Kruskal-Wallis ANOVA with Dunn’s multiple comparisons test. For (D), (H), and (L), individual data points are single astrocytes across multiple animals. See also Figure S7.

Comment in

References

    1. Bourque C.W. Central mechanisms of osmosensation and systemic osmoregulation. Nat. Rev. Neurosci. 2008;9:519–531. - PubMed
    1. Fitzsimons J.T. Angiotensin, thirst, and sodium appetite. Physiol. Rev. 1998;78:583–686. - PubMed
    1. Pool A.-H., Wang T., Stafford D.A., Chance R.K., Lee S., Ngai J., Oka Y. The cellular basis of distinct thirst modalities. Nature. 2020;588:112–117. - PMC - PubMed
    1. Augustine V., Lee S., Oka Y. Neural control and modulation of thirst, sodium appetite, and hunger. Cell. 2020;180:25–32. - PMC - PubMed
    1. Johnson A.K., Thunhorst R.L. The neuroendocrinology of thirst and salt appetite: visceral sensory signals and mechanisms of central integration. Front. Neuroendocrinol. 1997;18:292–353. - PubMed

Publication types