. 2022 Sep;298(9):102363.
doi: 10.1016/j.jbc.2022.102363. Epub 2022 Aug 10.

Phosphatidic acid inhibits inositol synthesis by inducing nuclear translocation of kinase IP6K1 and repression of myo-inositol-3-P synthase

Affiliations

Phosphatidic acid inhibits inositol synthesis by inducing nuclear translocation of kinase IP6K1 and repression of myo-inositol-3-P synthase

Pablo Lazcano et al. J Biol Chem. 2022 Sep.

Abstract

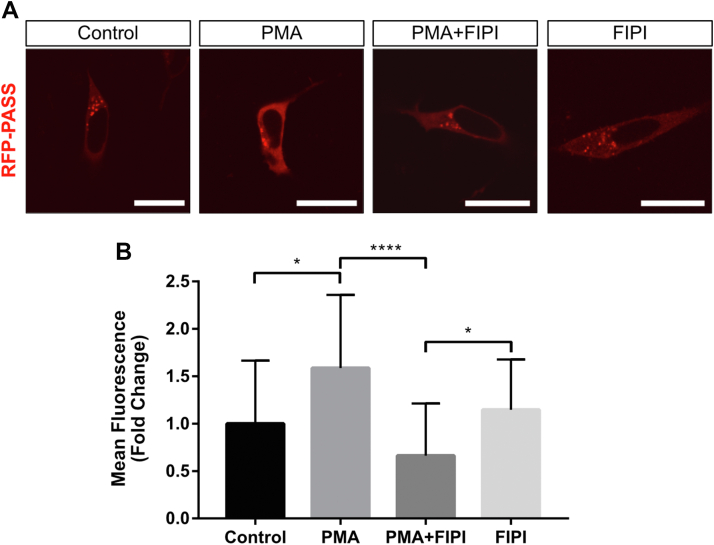
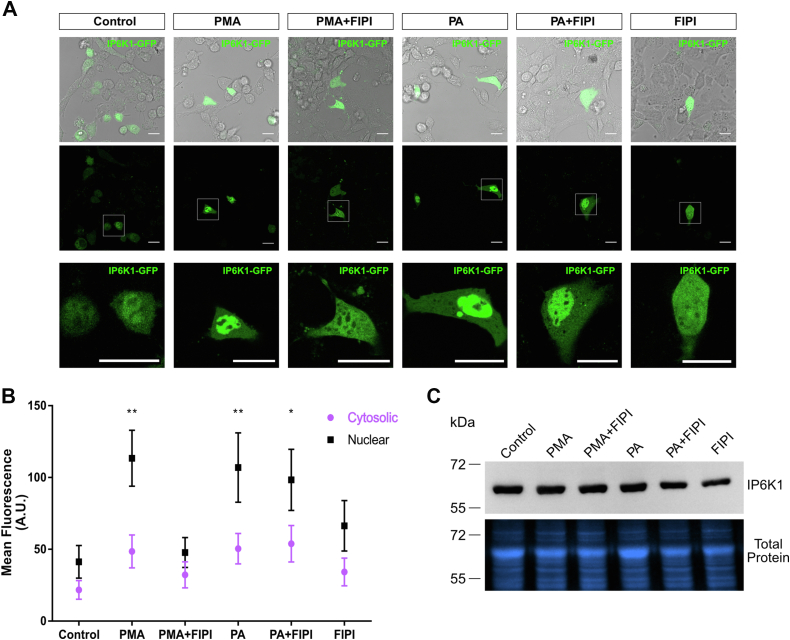
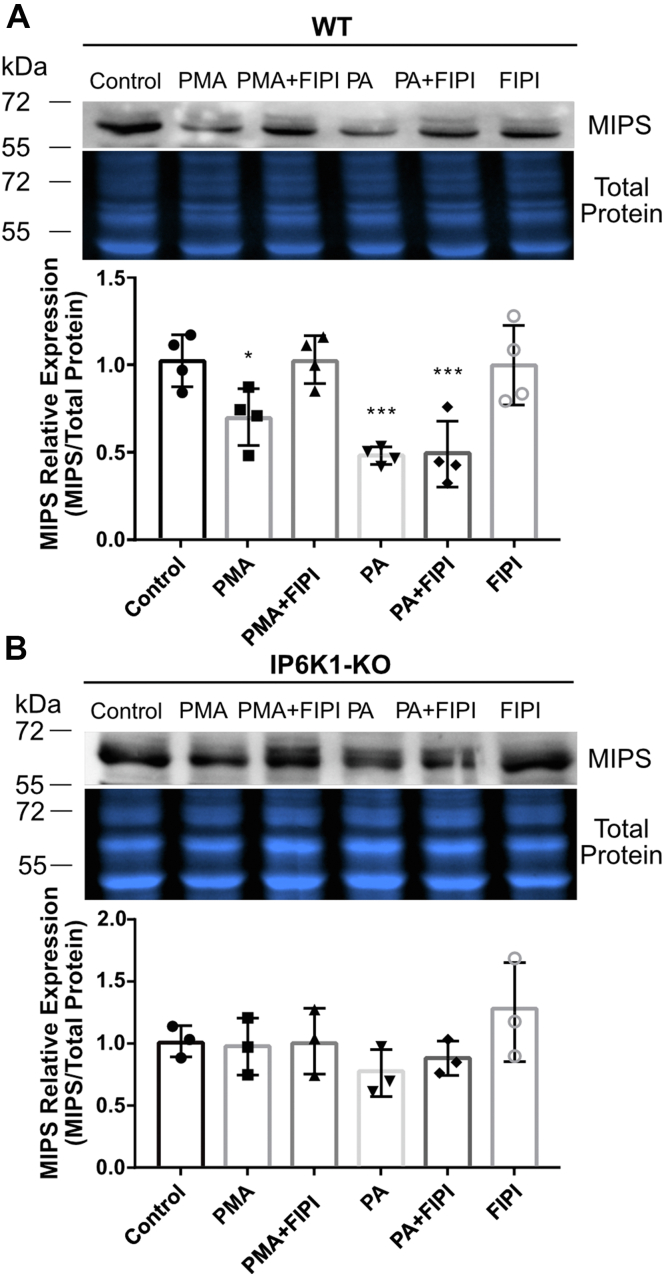
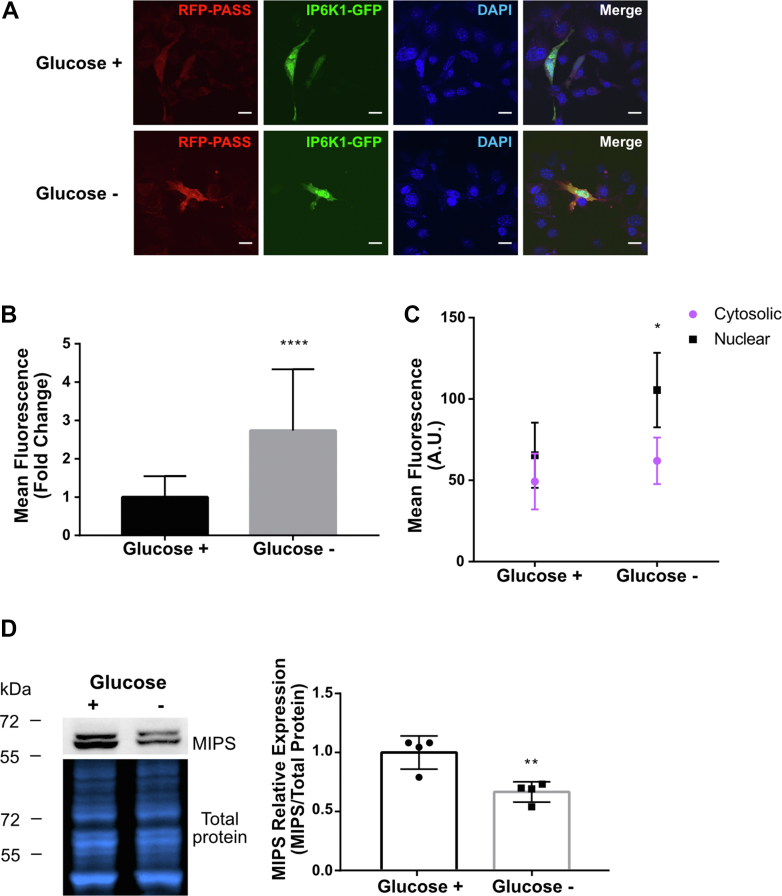
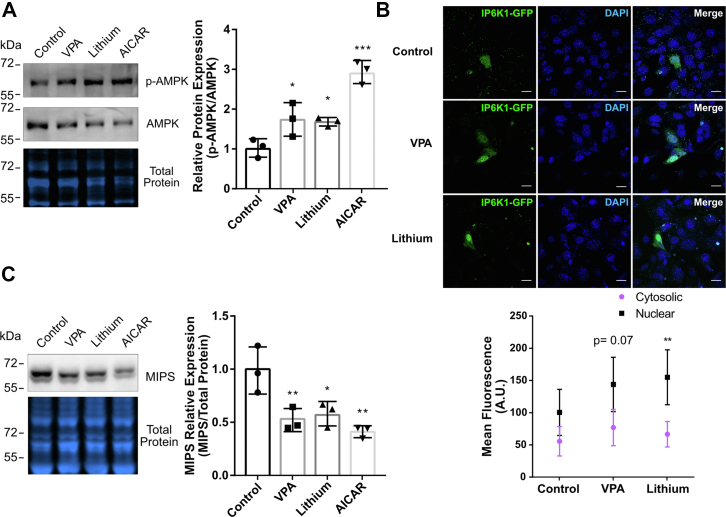
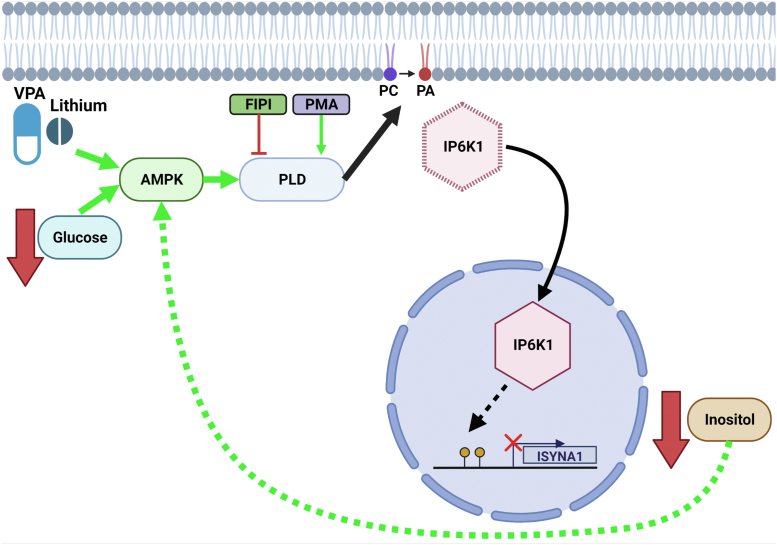
Inositol is an essential metabolite that serves as a precursor for structural and signaling molecules. Although perturbation of inositol homeostasis has been implicated in numerous human disorders, surprisingly little is known about how inositol levels are regulated in mammalian cells. A recent study in mouse embryonic fibroblasts demonstrated that nuclear translocation of inositol hexakisphosphate kinase 1 (IP6K1) mediates repression of myo-inositol-3-P synthase (MIPS), the rate-limiting inositol biosynthetic enzyme. Binding of IP6K1 to phosphatidic acid (PA) is required for this repression. Here, we elucidate the role of PA in IP6K1 repression. Our results indicate that increasing PA levels through pharmacological stimulation of phospholipase D (PLD) or direct supplementation of 18:1 PA induces nuclear translocation of IP6K1 and represses expression of the MIPS protein. We found that this effect was specific to PA synthesized in the plasma membrane, as endoplasmic reticulum-derived PA did not induce IP6K1 translocation. Furthermore, we determined that PLD-mediated PA synthesis can be stimulated by the master metabolic regulator 5' AMP-activated protein kinase (AMPK). We show that activation of AMPK by glucose deprivation or by treatment with the mood-stabilizing drugs valproate or lithium recapitulated IP6K1 nuclear translocation and decreased MIPS expression. This study demonstrates for the first time that modulation of PA levels through the AMPK-PLD pathway regulates IP6K1-mediated repression of MIPS.

Keywords: AMPK; IP6K1; MIPS; glucose; inositol; inositol phosphate; lithium; phosphatidic acid; phospholipase D; valproate.


Conflict of interest statement

Conflict of interest The authors declare that they have no conflicts of interest with the contents of this article.

Figures

Figure 1
Figure 1
PA levels are modulated by treatment with PMA or FIPI.A, cells transfected with RFP-PASS (red fluorescence) were treated with PMA alone (100 nM for 5 h) or in the presence of FIPI (0.75 μM, applied 30 min before PMA). n = 3 independent experiments, images are representative of the observed effect in most cells. The scale bars represent 20 μm. B, mean fluorescence quantification of the experiment depicted in (A). Arbitrary fluorescence units were normalized to untreated (control) cells and expressed as fold change ± SD. Statistical significance was analyzed by one-way ANOVA with a Tukey post hoc test, ∗p < 0.05, ∗∗∗∗p < 0.0001 where n = 3 independent experiments in which 20 to 30 cells were analyzed per condition. FIPI, 5-fluoro-2-indolyl des-chlorohalopemide; PA, phosphatidic acid; PMA, phorbol 12-myristate 13-acetate.
Figure 2
Figure 2
IP6K1 localization is regulated by PA.A, IP6K1-KO cells transfected with IP6K1-GFP (green) were treated with 100 nM PMA for 16 h or 100 μM 18:1 PA for 5 h, in the presence or absence of FIPI (0.75 μM, applied 30 min before PMA or PA). Top panel: merged image of transmitted light with green fluorescence image to evaluate transfection efficiency. Middle panel: green fluorescence alone; the boxed region is magnified to show further detail in the lower panel. The scale bars represent 20 μm. B, mean fluorescence (arbitrary units, A.U.) of cytosolic and nuclear sections of cells as shown in (A). Statistical significance was analyzed by a Kolmogorov–Smirnov test, ∗p < 0.05, ∗∗p < 0.01 where n = 3 independent experiments in which 20 to 30 cells were analyzed per condition. C, representative Western blot analysis of IP6K1 in WT MEF cells treated as in (A). n = 3 independent experiments, image is representative of the effect observed in all the experiments. Total protein staining was used to normalize for protein loading. FIPI, 5-fluoro-2-indolyl des-chlorohalopemide; IP6K1, inositol hexakisphosphate kinase; MEF, mouse embryonic fibroblast; PA, phosphatidic acid; PMA, phorbol 12-myristate 13-acetate.
Figure 3
Figure 3
Plasma membrane–derived PA induces IP6K1 nuclear localization.A, MEF cells were cotransfected with GFP-PASS (green) and either optoPLD-PM, optoPLD-PM ‘dead’, optoPLD-ER, or optoPLD-ER ‘dead’ as indicated. Cells were stimulated using intermittent blue light with a 5-s pulse every 2 min for a total of 30 min. PA localization was evaluated by GFP-PASS fluorescence using confocal microscopy. The scale bar represents 20 μm. Images are representative of the observed phenotype. B, IP6K1-KO MEF cells were cotransfected with IP6K1-GFP (green) and optoPLD-PM (red, top left), optoPLD-ER (red, top right), optoPLD-PM ‘dead’ (red, bottom left), or optoPLD-ER ‘dead’ (red, bottom right). Cells were stimulated using intermittent blue light with a 5-s pulse every 2 min for a total of 30 min. IP6K1 localization was determined by confocal microscopy. DAPI was used as nuclear staining. The scale bar represents 20 μm. C, mean fluorescence (arbitrary units, A.U.) of cytosolic and nuclear sections of cells as shown in (B). Statistical significance was analyzed by a Kolmogorov–Smirnov test, ∗∗p < 0.01 where n = 3 independent experiments in which 20 to 30 cells were analyzed per condition. IP6K1, inositol hexakisphosphate kinase; MEF, mouse embryonic fibroblast; ER, endoplasmic reticulum; PA, phosphatidic acid; PLD, phospholipase D; PMA, phorbol 12-myristate 13-acetate.
Figure 4
Figure 4
MIPS expression is regulated by PA in the presence of IP6K1.A, Western blot against MIPS protein in WT MEF cells treated with 100 nM PMA for 16 h or 100 μM 18:1 PA for 5 h, in the presence or absence of FIPI (0.75 μM, applied 30 min before PMA or PA). B, Western blot against MIPS protein in IP6K1-KO MEF cells treated with 100 nM PMA for 16 h or 100 μM 18:1 PA for 5 h, in the presence or absence of FIPI (0.75 μM, applied 30 min before PMA or PA). Graphs depict band quantification. Total protein staining was used to normalize for protein loading. n = 4 independent experiments for (A) and n = 3 independent experiments for (B). Statistical significance was analyzed by one-way ANOVA with a Tukey post hoc test, ∗p < 0.05 and ∗∗∗p < 0.001. FIPI, 5-fluoro-2-indolyl des-chlorohalopemide; IP6K1, inositol hexakisphosphate kinase; MEF, mouse embryonic fibroblast; MIPS, myo-inositol-3-phosphate synthase; PA, phosphatidic acid; PMA, phorbol 12-myristate 13-acetate.
Figure 5
Figure 5
Glucose deprivation induces PA synthesis, IP6K1 nuclear translocation, and MIPS repression.A, IP6K1-KO MEF cells were cotransfected with IP6K1-GFP and RFP-PASS. Cells were deprived of glucose for 16 h, and PA synthesis and IP6K1 localization were monitored by confocal microscopy. DAPI was used to stain nuclei. The scale bar represents 20 μm. B, mean fluorescence quantification of RFP-PASS from the experiment depicted in (A). Arbitrary fluorescence units (A.U.) were normalized to control and expressed as fold change ± SD. Statistical significance was analyzed by an unpaired t test, ∗∗∗∗p < 0.0001, where n = 3 independent experiments and between 20 to 30 cells were analyzed per condition. C, mean fluorescence (A.U.) of peripheral cytosolic and nuclear sections of cells as shown in (A). Statistical significance was analyzed by a Kolmogorov–Smirnov test, ∗p < 0.05 where n = 3 independent experiments and between 20 to 30 cells were analyzed per condition. D, Western blot against MIPS protein in WT MEF cells grown in control conditions (glucose +) or deprived of glucose for 16 h (glucose −). Graphs depict band quantification (right). Total protein staining was used to normalize for protein loading. n = 4 independent experiments for each condition. Statistical significance was analyzed by an unpaired t test, ∗∗p < 0.01. IP6K1, inositol hexakisphosphate kinase; MEF, mouse embryonic fibroblast; MIPS, myo-inositol-3-phosphate synthase; PA, phosphatidic acid.
Figure 6
Figure 6
VPA and lithium activate AMPK, induce IP6K1 nuclear translocation, and repress MIPS protein expression.A, cells were treated with 1 mM VPA or 10 mM lithium for 24 h or 500 μM AICAR for 1 h, and AMPK activation was determined by Western blot. Samples were probed for p-AMPK, stripped until no signal was detected, and reprobed for total AMPK. Total protein staining was used to normalize for protein loading. The graph shows the relative protein expression of p-AMPK normalized against total AMPK and then total protein. Statistical significance was analyzed by parametric t test, ∗p < 0.05 and ∗∗∗p < 0.001, where n = 3 independent experiments. B, cells were treated with either 1 mM VPA or 10 mM lithium for 24 h and IP6K1 localization was determined by fluorescence confocal microscopy. DAPI was used as nuclear staining. The scale bar represents 20 μm. Graph (lower panel) shows mean fluorescence (arbitrary units, A.U.) of cytosolic and nuclear sections of cells. Statistical significance was analyzed by a Kolmogorov–Smirnov test, ∗∗p < 0.01 where n = 3 independent experiments in which 20 to 30 cells were analyzed per condition. C, Western blot against MIPS protein in WT MEF cells treated with either 1 mM VPA, 10 mM lithium for 24 h, or 500 μM AICAR for 1 h. Graphs depict band quantification (right). Total protein staining was used to normalize for protein loading. n = 3 independent experiments for each condition. Statistical significance was analyzed by one-way ANOVA with a Tukey post hoc test, ∗p < 0.05 and ∗∗p < 0.01. AICAR, 5-aminoimidazole-4-carboxamide; AMPK, 5′ AMP-activated protein kinase; MEF, mouse embryonic fibroblast; MIPS, myo-inositol-3-phosphate synthase; VPA, valproate; IP6K1, inositol hexakisphosphate kinase 1.
Figure 7
Figure 7
Model of PA-mediated MIPS regulation and feedback. PA can be synthesized through PLD, which converts PC into PA. PA synthesis in the plasma membrane leads to increased nuclear translocation of IP6K1 as a result of PA-IP6K1 binding. Once in the nucleus, IP6K1 induces methylation of the ISYNA1 gene promoter and inhibits MIPS expression (17). As a result, inositol levels are decreased. Inositol has been shown to negatively regulate AMPK activation (28); therefore, a decrease in inositol is predicted to lead to an increase in AMPK activity. AMPK can also be activated by low glucose or by treatment with the mood stabilizers VPA or lithium. Activated AMPK can in turn directly activate PLD (22). AMPK, 5′ AMP-activated protein kinase; IP6K1, inositol hexakisphosphate kinase; PA, phosphatidic acid; PC, phosphatidylcholine; PLD, phospholipase D; VPA, valproate; MIPS, myo-inositol-3-P synthase; IP6K1, inositol hexakisphosphate kinase 1. Figure created with BioRender.com.

Similar articles

Cited by

References

    1. Case K.C., Salsaa M., Yu W., Greenberg M.L. Regulation of inositol biosynthesis: balancing health and pathophysiology. Handb. Exp. Pharmacol. 2020;259:221–260. - PubMed
    1. Keith A.D., Pollard E.C., Snipes W. Inositol-less death in yeast results in a simultaneous increase in intracellular viscosity. Biophys. J. 1977;17:205–212. - PMC - PubMed
    1. Matile P. Inositol deficiency resulting in death: an explanation of its occurrence in Neurospora crassa. Science. 1966;151:86–88. - PubMed
    1. Minskoff S.A., Gaynor P.M., Greenberg M.L. Mutant enrichment of Schizosaccharomyces pombe by inositol-less death. J. Bacteriol. 1992;174:4078–4085. - PMC - PubMed
    1. Eagle H., Oyama V.I., Levy M., Freeman A.E. Myo-Inositol as an essential growth factor for normal and malignant human cells in tissue culture. J. Biol. Chem. 1957;226:191–205. - PubMed

Publication types

LinkOut - more resources