

Cerebral blood flow and cardiovascular risk effects on resting brain regional homogeneity
- PMID: 35963506
- PMCID: PMC10044499
- DOI: 10.1016/j.neuroimage.2022.119555
Cerebral blood flow and cardiovascular risk effects on resting brain regional homogeneity
Abstract
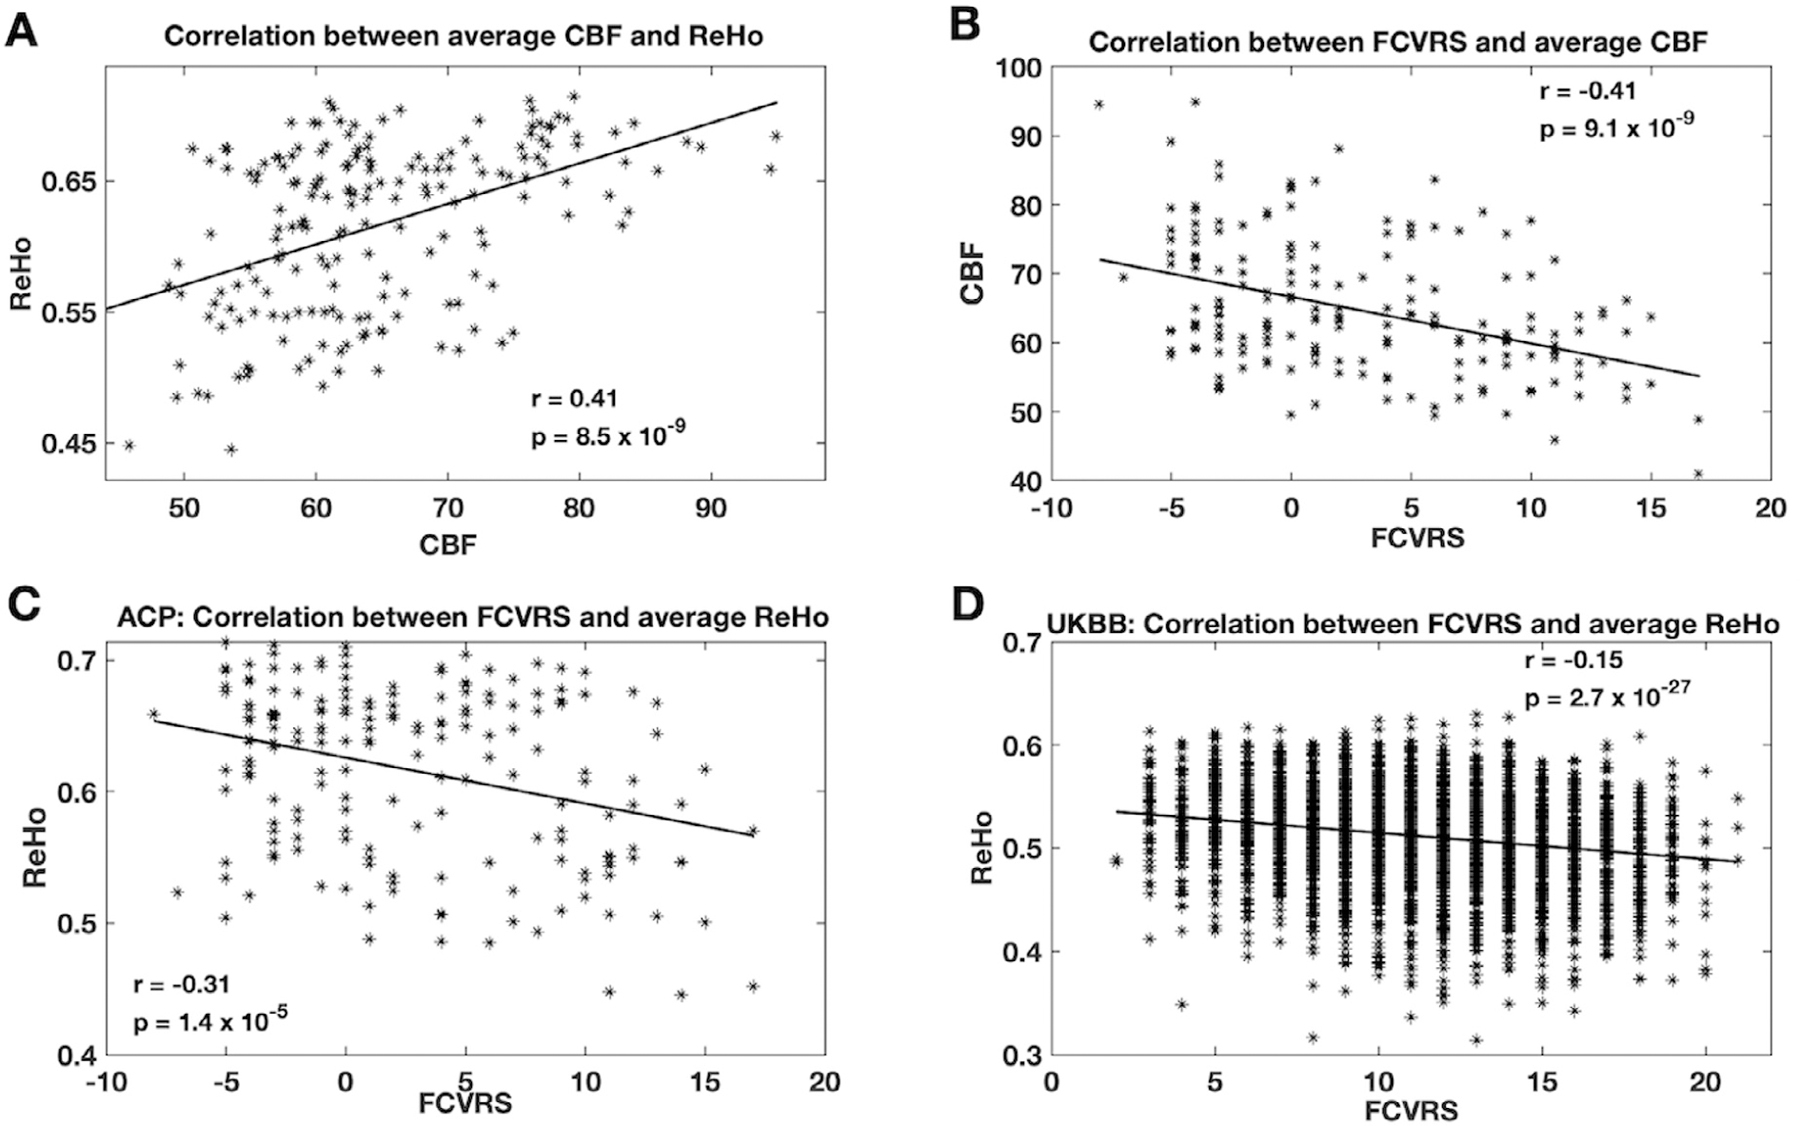
Regional homogeneity (ReHo) is a measure of local functional brain connectivity that has been reported to be altered in a wide range of neuropsychiatric disorders. Computed from brain resting-state functional MRI time series, ReHo is also sensitive to fluctuations in cerebral blood flow (CBF) that in turn may be influenced by cerebrovascular health. We accessed cerebrovascular health with Framingham cardiovascular risk score (FCVRS). We hypothesize that ReHo signal may be influenced by regional CBF; and that these associations can be summarized as FCVRS→CBF→ReHo. We used three independent samples to test this hypothesis. A test-retest sample of N = 30 healthy volunteers was used for test-retest evaluation of CBF effects on ReHo. Amish Connectome Project (ACP) sample (N = 204, healthy individuals) was used to evaluate association between FCVRS and ReHo and testing if the association diminishes given CBF. The UKBB sample (N = 6,285, healthy participants) was used to replicate the effects of FCVRS on ReHo. We observed strong CBF→ReHo links (p<2.5 × 10⁻³) using a three-point longitudinal sample. In ACP sample, marginal and partial correlations analyses demonstrated that both CBF and FCVRS were significantly correlated with the whole-brain average (p<10-6) and regional ReHo values, with the strongest correlations observed in frontal, parietal, and temporal areas. Yet, the association between ReHo and FCVRS became insignificant once the effect of CBF was accounted for. In contrast, CBF→ReHo remained significantly linked after adjusting for FCVRS and demographic covariates (p<10-6). Analysis in N = 6,285 replicated the FCVRS→ReHo effect (p = 2.7 × 10⁻²⁷). In summary, ReHo alterations in health and neuropsychiatric illnesses may be partially driven by region-specific variability in CBF, which is, in turn, influenced by cardiovascular factors.
Keywords: Arterial-spin labeling; Correlation; Local functional connectivity; Multivariate mediation analysis; Resting state functional MRI.
Published by Elsevier Inc.
Conflict of interest statement
Competing Interests LEH has received or plans to receive research funding or consulting fees on research projects from Mitsubishi, Your Energy Systems LLC, Neuralstem, Taisho, Heptares, Pfizer, Luye Pharma, Sound Pharma, Takeda, and Regeneron. None was involved in the design, analysis or outcomes of the study. NJ and PT received a research grant from Biogen, Inc., for research unrelated to this project. All other authors declare no conflicts of interest.
Figures


Similar articles
-
Functional vs Structural Cortical Deficit Pattern Biomarkers for Major Depressive Disorder.JAMA Psychiatry. 2025 Jun 1;82(6):582-590. doi: 10.1001/jamapsychiatry.2025.0192. JAMA Psychiatry. 2025. PMID: 40172866 Free PMC article.
-
Prescription of Controlled Substances: Benefits and Risks.2025 Jul 6. In: StatPearls [Internet]. Treasure Island (FL): StatPearls Publishing; 2025 Jan–. 2025 Jul 6. In: StatPearls [Internet]. Treasure Island (FL): StatPearls Publishing; 2025 Jan–. PMID: 30726003 Free Books & Documents.
-
Signs and symptoms to determine if a patient presenting in primary care or hospital outpatient settings has COVID-19.Cochrane Database Syst Rev. 2022 May 20;5(5):CD013665. doi: 10.1002/14651858.CD013665.pub3. Cochrane Database Syst Rev. 2022. PMID: 35593186 Free PMC article.
-
Regional cerebral blood flow single photon emission computed tomography for detection of Frontotemporal dementia in people with suspected dementia.Cochrane Database Syst Rev. 2015 Jun 23;2015(6):CD010896. doi: 10.1002/14651858.CD010896.pub2. Cochrane Database Syst Rev. 2015. PMID: 26102272 Free PMC article.
-
The effect of sample site and collection procedure on identification of SARS-CoV-2 infection.Cochrane Database Syst Rev. 2024 Dec 16;12(12):CD014780. doi: 10.1002/14651858.CD014780. Cochrane Database Syst Rev. 2024. PMID: 39679851 Free PMC article.
Cited by
-
Mediation Analysis for High-Dimensional Mediators and Outcomes with an Application to Multimodal Imaging Data.Comput Stat Data Anal. 2023 Sep;185:107765. doi: 10.1016/j.csda.2023.107765. Epub 2023 Apr 24. Comput Stat Data Anal. 2023. PMID: 37251499 Free PMC article.
-
Functional vs Structural Cortical Deficit Pattern Biomarkers for Major Depressive Disorder.JAMA Psychiatry. 2025 Jun 1;82(6):582-590. doi: 10.1001/jamapsychiatry.2025.0192. JAMA Psychiatry. 2025. PMID: 40172866 Free PMC article.
-
Additional comments on foot reflexology treatment for sensorineural hearing loss in infant.World J Clin Cases. 2024 Oct 26;12(30):6407-6409. doi: 10.12998/wjcc.v12.i30.6407. World J Clin Cases. 2024. PMID: 39464327 Free PMC article.
-
The neural plasticity and efficacy of acupuncture for post-stroke dysphagia: protocol for a randomized controlled trial with fMRI and DTI.BMC Complement Med Ther. 2024 Oct 4;24(1):357. doi: 10.1186/s12906-024-04657-1. BMC Complement Med Ther. 2024. PMID: 39367391 Free PMC article.
-
Interactive effect of air pollution and genetic risk of depression on processing speed by resting-state functional connectivity of occipitoparietal network.BMC Med. 2024 Sep 13;22(1):392. doi: 10.1186/s12916-024-03614-6. BMC Med. 2024. PMID: 39272182 Free PMC article.
References
-
- Adhikari BM, Jahanshad N, Shukla D, Glahn DC, Blangero J, Reynolds RC, Cox RW, Fieremans E, Veraart J, Novikov DS, Nichols TE, Hong LE, Thompson PM, Kochunov P, 2018a. Comparison of heritability estimates on resting state fMRI connectivity phenotypes using the ENIGMA analysis pipeline. Hum. Brain Mapp 39, 4893–4902. - PMC - PubMed
-
- Adhikari BM, Jahanshad N, Shukla DK, Turner JA, Grotegerd D, Dannlowski U, Kugel H, Engelen J, Dietsche B, Krug A, Kircher T, Fieremans E, Veraart J, Novikov DS, Boedhoe PSW, van der Werf YD, van den Heuvel OA, Ipser J, Uhlmann A, Stein DJ, Dickie E, Voineskos AN, Malhotra AK, Pizzagalli F, Calhoun VC, Waller L, Veer IM, Walter H, Buchanan RW, Glahn DC, Hong LE, Thompson PM, Kochunov P, 2019. A resting state fMRI analysis pipeline for pooling inference across diverse cohorts: an ENIGMA rs-fMRI protocol. Brain Imaging Behav 13, 1453–1467. - PMC - PubMed
-
- Albrecht D, Isenberg AL, Stradford J, Monreal T, Sagare A, Pachicano M, Sweeney M, Toga A, Zlokovic B, Chui H, Joe E, Schneider L, Conti P, Jann K, Pa J, 2020. Associations between Vascular Function and Tau PET Are Associated with Global Cognition and Amyloid. J. Neurosci 40, 8573–8586. - PMC - PubMed
-
- Alfaro-Almagro F, Jenkinson M, Bangerter NK, Andersson JLR, Griffanti L, Douaud G, Sotiropoulos SN, Jbabdi S, Hernandez-Fernandez M, Vallee E, Vidaurre D, Webster M, McCarthy P, Rorden C, Daducci A, Alexander DC, Zhang H, Dragonu I, Matthews PM, Miller KL, Smith SM, 2018. Image processing and Quality Control for the first 10,000 brain imaging datasets from UK Biobank. Neuroimage 166, 400–424. - PMC - PubMed
Publication types
MeSH terms
Grants and funding
LinkOut - more resources
Full Text Sources
