. 2022 Dec:177:107608.
doi: 10.1016/j.ympev.2022.107608. Epub 2022 Aug 11.

Evaluation of various distance computation methods for construction of haplotype-based phylogenies from large MLST datasets

Affiliations

Evaluation of various distance computation methods for construction of haplotype-based phylogenies from large MLST datasets

David Jacobson et al. Mol Phylogenet Evol. 2022 Dec.

Abstract

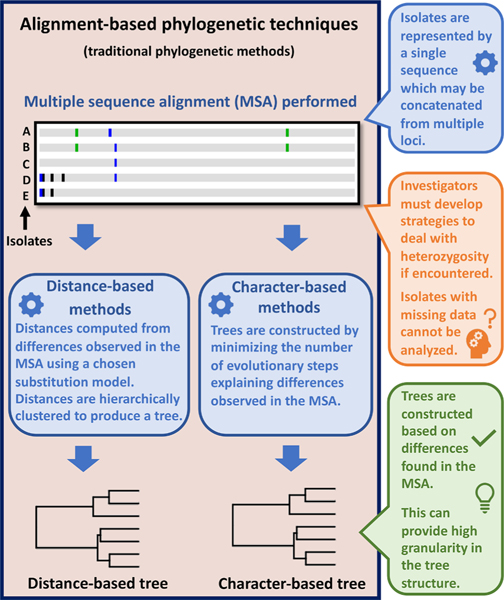
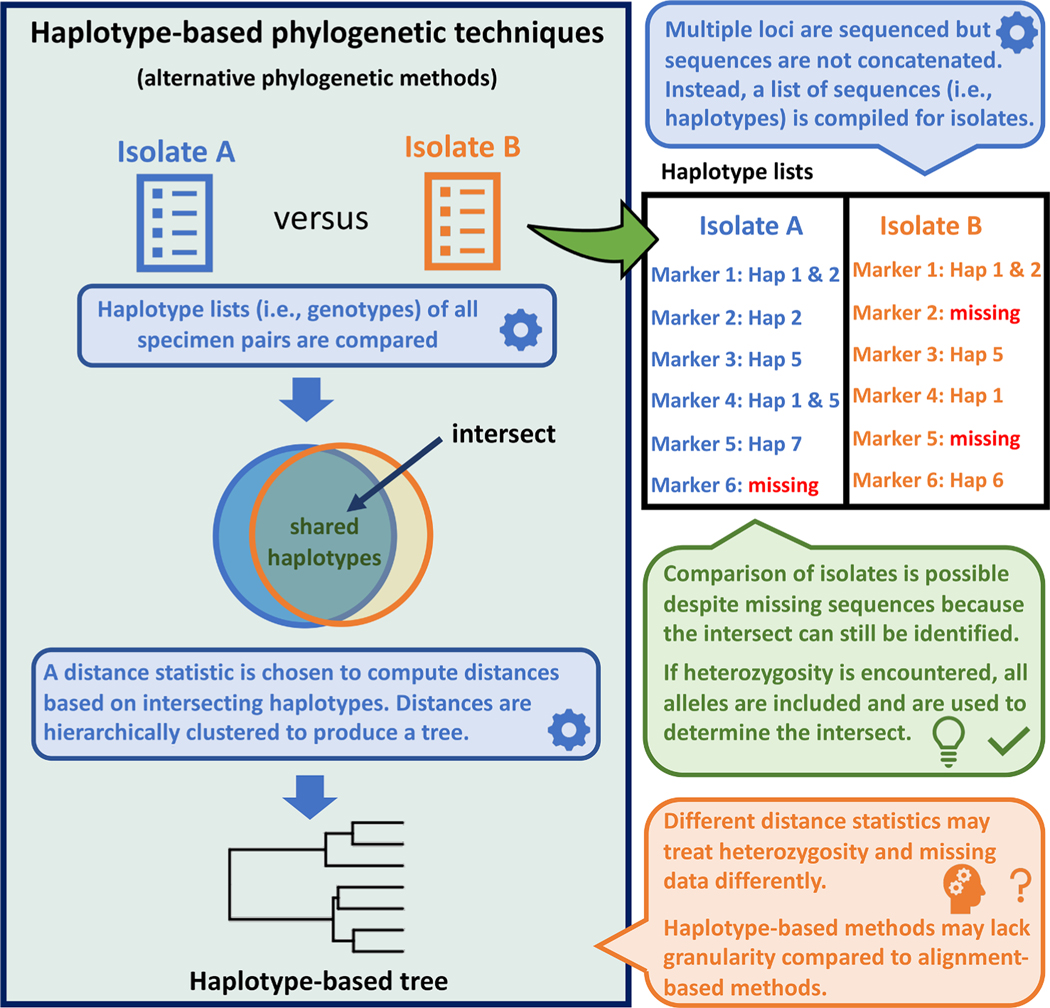
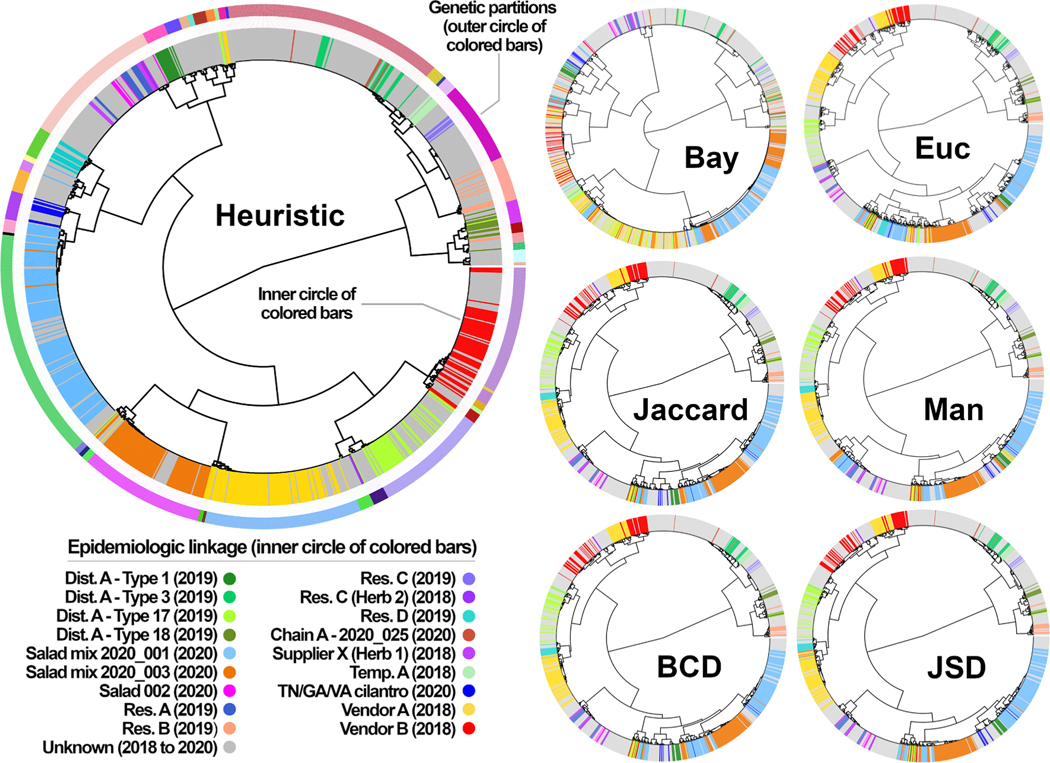
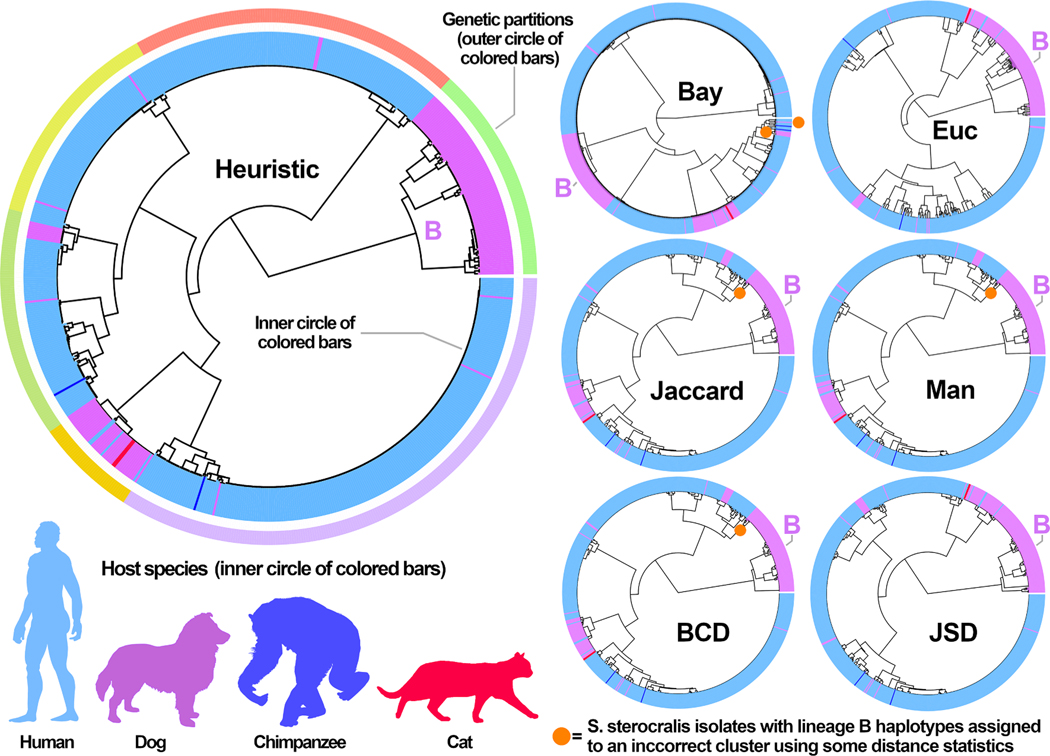
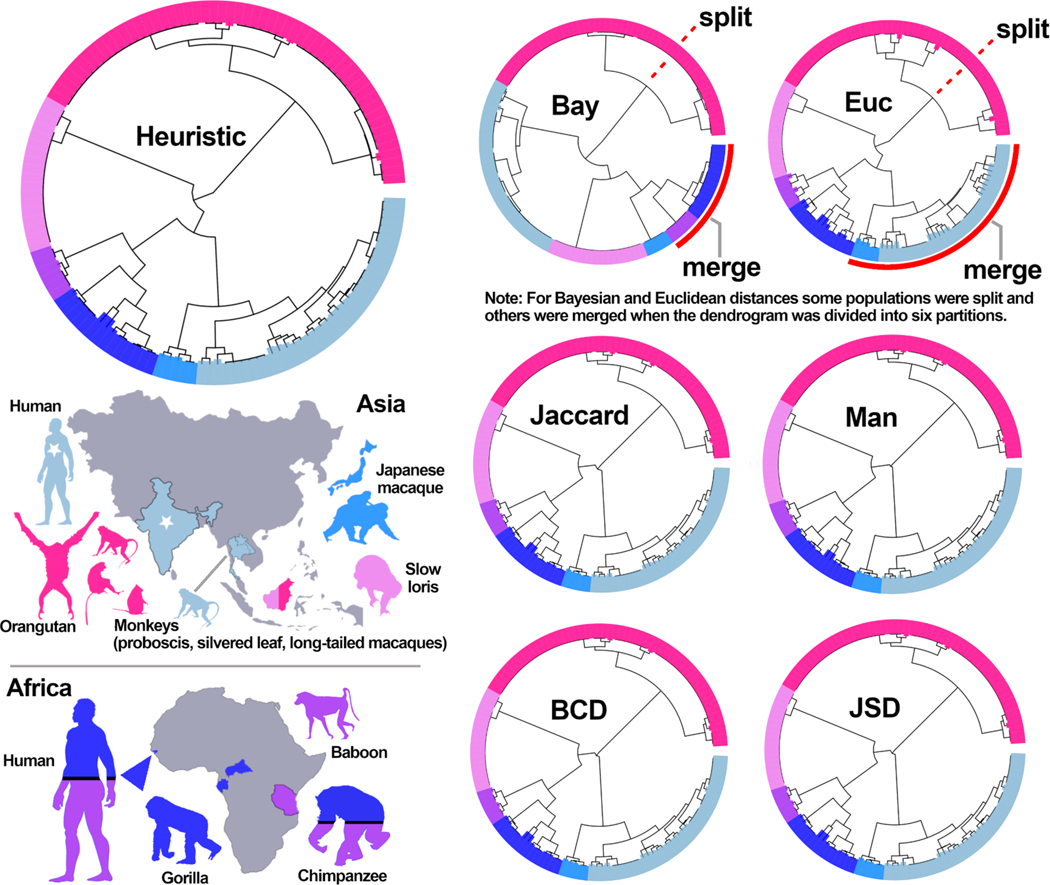
Multi-locus sequence typing (MLST) is widely used to investigate genetic relationships among eukaryotic taxa, including parasitic pathogens. MLST analysis workflows typically involve construction of alignment-based phylogenetic trees - i.e., where tree structures are computed from nucleotide differences observed in a multiple sequence alignment (MSA). Notably, alignment-based phylogenetic methods require that all isolates/taxa are represented by a single sequence. When multiple loci are sequenced these sequences may be concatenated to produce one tree that includes information from all loci. Alignment-based phylogenetic techniques are robust and widely used yet possess some shortcomings, including how heterozygous sites are handled, intolerance for missing data (i.e., partial genotypes), and differences in the way insertions-deletions (indels) are scored/treated during tree construction. In certain contexts, 'haplotype-based' methods may represent a viable alternative to alignment-based techniques, as they do not possess the aforementioned limitations. This is namely because haplotype-based methods assess genetic similarity based on numbers of shared (i.e., intersecting) haplotypes as opposed to similarities in nucleotide composition observed in an MSA. For haplotype-based comparisons, choosing an appropriate distance statistic is fundamental, and several statistics are available to choose from. However, a comprehensive assessment of various available statistics for their ability to produce a robust haplotype-based phylogenetic reconstruction has not yet been performed. We evaluated seven distance statistics by applying them to extant MLST datasets from the gastrointestinal parasite Cyclospora cayetanensis and two species of pathogenic nematode of the genus Strongyloides. We compare the genetic relationships identified using each statistic to epidemiologic, geographic, and host metadata. We show that Barratt's heuristic definition of genetic distance was the most robust among the statistics evaluated. Consequently, it is proposed that Barratt's heuristic represents a useful approach for use in the context of challenging MLST datasets possessing features (i.e., high heterozygosity, partial genotypes, and indel or repeat-based polymorphisms) that confound or preclude the use of alignment-based methods.

Keywords: Cyclospora; Eukaryotes; Genotyping; Parasites; Phylogeny; Strongyloides.


Conflict of interest statement

Declaration of Competing Interest The authors declare that they have no known competing financial interests or personal relationships that could have appeared to influence the work reported in this paper.

Figures

Fig. 1.
Fig. 1.
Overview of alignment-based phylogenetic workflows. Alignment-based (i.e., distance-based or character-based) phylogenetic methods generate tree structures based on nucleotide differences observed between isolates in an MSA, where each isolate must be represented by a single sequence. Consequently, heterozygosity is confounding for alignment-based methods. MLST analysis workflows often involve concatenating multiple sequenced loci into one sequence, as alignment-based methods require a single continuous, homologous sequence for each isolate. Therefore, if a sequence cannot be obtained for one or more genotyping loci for some isolates, these isolates must be excluded, or the concatenated sequence of all isolates may be truncated to maintain consistency across all isolates. An advantage of alignment-based methods is that tree structures reflect differences observed at each nucleotide position in the alignment, providing good granularity.
Fig. 2.
Fig. 2.
Overview of haplotype-based phylogenetic workflows and their advantages. Haplotype-based phylogenetic workflows produce a tree structure based on numbers of intersecting haplotypes. Isolates are represented by a list of haplotypes (i.e., their genotype), including loci possessing multiple alleles. For this reason, heterozygosity is not a confounding factor. Because distances are computed from the number of intersecting haplotypes, isolates with data missing for a small number of loci may still be retained for analysis, understanding that comparisons become increasingly tenuous as the number of missing values increases. Haplotype-based tree structures may lack granularity compared to alignment-based trees because haplotype-based methods consider haplotype matches in a binary manner: isolates either share a haplotype or they do not, and the fact that some haplotypes may be more similar in sequence than others is not considered during distance computation. However, the granularity of haplotype-based phylogenetic reconstructions can be increased by sequencing genotyping markers possessing certain features (discussed later in this paper). Importantly, the statistic selected for distance computation is the foundation of a haplotype-based method.
Fig. 3.
Fig. 3.
Cluster dendrograms showing the population structure predicted for the C. cayetanensis dataset using each of seven distance statistics. Seven distance matrices computed from 1137 C. cayetanensis genotypes were clustered using Ward’s method to generate the dendrograms shown. A partition number of 46 was used to dissect each dendrogram for calculation of the metrics in Table 2, Table 3, and Table 4. The largest dendrogram was generated using Barratt’s heuristic, where the outer circle of colored bars shows the boundary between each of the 46 partitions. The inner circle of bars on the larger dendrogram is color coded to indicate genotypes epidemiologically linked to clusters of cyclosporiasis. The color coding on the smaller dendrograms also reflects the epidemiologic linkage of the various genotypes. Examination of each dendrogram shows that genotypes labelled with the same color more frequently cluster within the same partition when Barratt’s heuristic definition of genetic distance is used to compute a distance matrix. Heuristic: Barratt’s heuristic, Bay: Plucinski’s Bayesian distances, Euc: Euclidean distances, Jaccard: Jaccard distances, Man: Manhattan distances, BCD: Bray-Curtis Dissimilarity, JSD: Jensen-Shannon Divergence, Dist: Distributor, Res: Restaurant, Temp: Temporo-spatial cluster.
Fig. 4.
Fig. 4.
Cluster dendrograms showing the population structure predicted for the S. stercoralis dataset using each of seven distance statistics. Distance matrices were computed from the 704 S. stercoralis genotypes using each of seven distance statistics. These matrices were clustered using Ward’s method to generate the dendrograms shown. Each dendrogram was dissected into 6 partitions to compute the Rand indices as shown in Table 4. The largest dendrogram was generated using Barratt’s heuristic, where the outer circle of colored bars shows the boundary between each of the 6 partitions. The inner circle of colored bars on the larger dendrogram is color coded to indicate genotypes obtained from one of four possible hosts (humans, dogs, cats, and chimpanzees). The color coding on the smaller dendrograms also reflects the host species from which the genotyped S. stercoralis isolates were derived. The orange circle shown on four of the smaller dendrograms is adjacent to or on a node that includes six specimens belonging to lineage B that were incorrectly assigned to lineage A using four of the distance statistics. The partition representing lineage B of S. stercoralis is labelled on each dendrogram. Isolates that were assigned incorrectly to lineage A are shown in Supplementary File S1 (colored in blue). Heuristic: Barratt’s heuristic, Bay: Plucinski’s Bayesian distances, Euc: Euclidean distances, Jaccard: Jaccard distances, Man: Manhattan distances, BCD: Bray-Curtis Dissimilarity, JSD: Jensen-Shannon Divergence.
Fig. 5.
Fig. 5.
Cluster dendrograms showing the population structure predicted for the S. fuelleborni dataset using each of seven distance statistics. Distances were computed from the 133 S. fuelleborni genotypes (including 18 from a distinct Strongyloides species) and were clustered using Ward’s method to generate the dendrograms shown. These dendrograms were divided into 6 partitions to compute the Rand indices as shown in Table 4. The largest dendrogram shows the result obtained using Barratt’s heuristic, where the bars are color coded to indicate genotypes obtained from various primates (i.e., monkeys, apes, humans, and lorises) from different locations, which match the boundary between the 6 partitions. Color coding on the smaller dendrograms also reflects the host species from which the Strongyloides isolates were derived. On the map of Asia, the star indicates a single isolate from an Indian human which was assigned to the partition colored in gray on each dendrogram. Long tailed macaques from Southeast Asia (gray without a star – indicating Laos and Thailand) were assigned to the same genetic partition as the Indian isolate. On the map of Africa, dark blue indicates S. fuelleborni isolates from chimpanzees, humans, and/or gorillas from Gabon, Guinea-Bissau (indicated with a triangle) and/or the Central African Republic. Purple indicates isolates from humans, chimpanzees, and baboons from Tanzania. Heuristic: Barratt’s heuristic, Bay: Plucinski’s Bayesian distances, Euc: Euclidean distances, Jaccard: Jaccard distances, Man: Manhattan distances, BCD: Bray-Curtis Dissimilarity, JSD: Jensen-Shannon Divergence.

References

    1. Anonymous. 2018. Domestically Acquired Cases of Cyclosporiasis — United States, May–August 2018. Centers for Disease Control and Prevention; 2018 [cited 2020]; Available from: https://www.cdc.gov/parasites/cyclosporiasis/outbreaks/2018/c-082318/ind....
    1. Anonymous. 2019a. Domestically Acquired Cases of Cyclosporiasis — United States, May–August 2019. Centers for Disease Control and Prevention; 2019 [cited 2020]; Available from: https://www.cdc.gov/parasites/cyclosporiasis/outbreaks/2019/a-050119/ind....
    1. Anonymous. 2019b. Outbreak of Cyclospora Infections Linked to Fresh Basil from Siga Logistics de RL de CV of Morelos, Mexico. Centers for Disease Control and Prevention; 2019 [cited 2020]; Available from: https://www.cdc.gov/parasites/cyclosporiasis/outbreaks/2019/weekly/index....
    1. Anonymous. 2020. Domestically Acquired Cases of Cyclosporiasis — United States, May–August 2020. Centers for Disease Control and Prevention; 2020 [cited 2021]; Available from: https://www.cdc.gov/parasites/cyclosporiasis/outbreaks/2020/seasonal/ind....
    1. Ashkenazy H, Cohen O, Pupko T, Huchon D, 2014. Nov 18. Indel reliability in indel-based phylogenetic inference. Genome Biol Evol. 6 (12), 3199–3209. - PMC - PubMed

Publication types

LinkOut - more resources