. 2022 Aug 13;13(1):4755.
doi: 10.1038/s41467-022-32395-w.

A method for Boolean analysis of protein interactions at a molecular level

Affiliations

A method for Boolean analysis of protein interactions at a molecular level

Doroteya Raykova et al. Nat Commun. .

Erratum in

Abstract

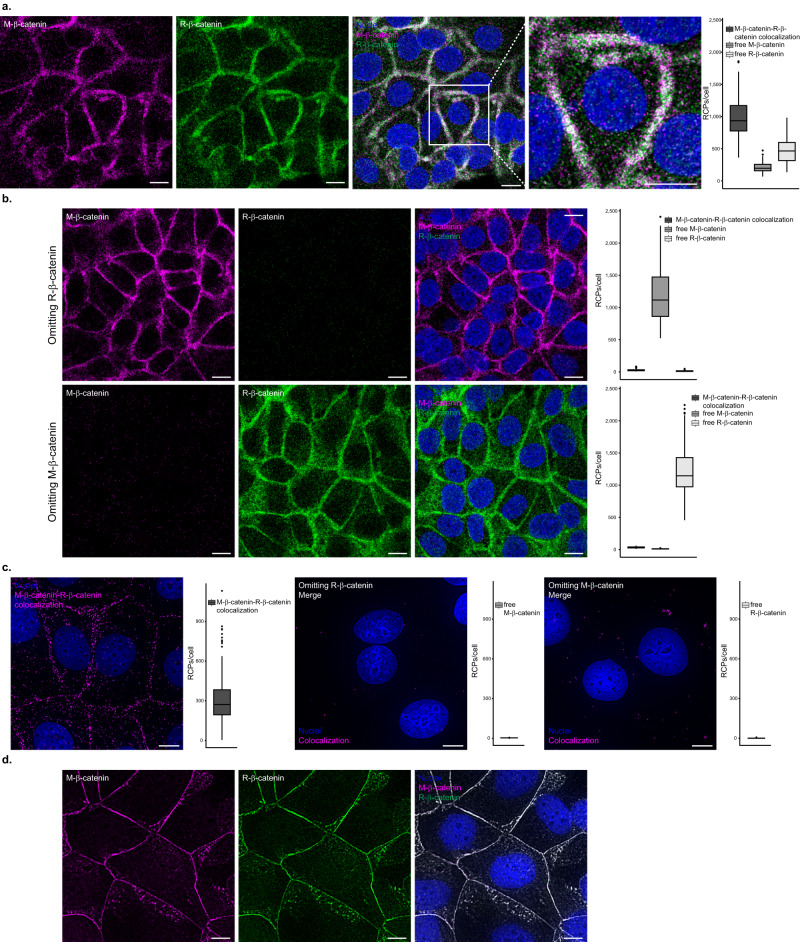
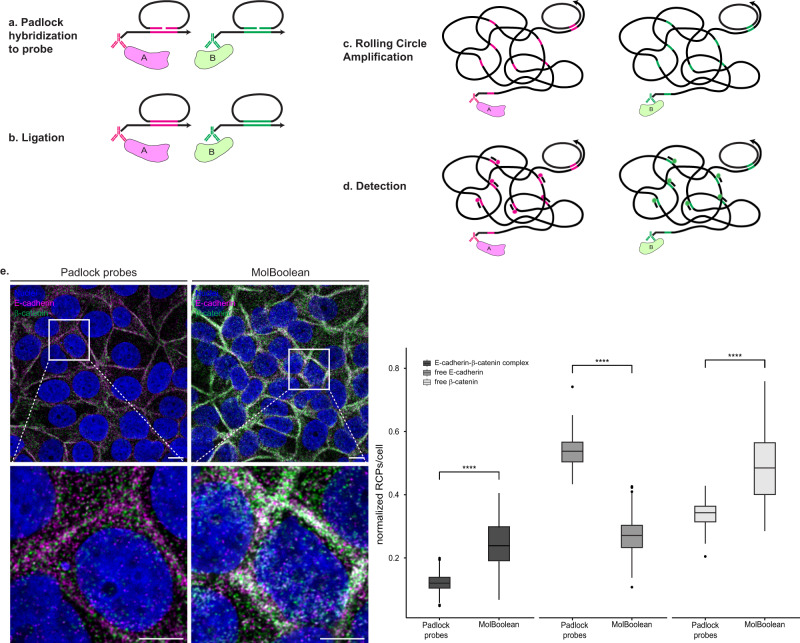
Determining the levels of protein-protein interactions is essential for the analysis of signaling within the cell, characterization of mutation effects, protein function and activation in health and disease, among others. Herein, we describe MolBoolean - a method to detect interactions between endogenous proteins in various subcellular compartments, utilizing antibody-DNA conjugates for identification and signal amplification. In contrast to proximity ligation assays, MolBoolean simultaneously indicates the relative abundances of protein A and B not interacting with each other, as well as the pool of A and B proteins that are proximal enough to be considered an AB complex. MolBoolean is applicable both in fixed cells and tissue sections. The specific and quantifiable data that the method generates provide opportunities for both diagnostic use and medical research.


Conflict of interest statement

The authors declare the following competing interests: O. Söderberg is the inventor of the MolBoolean method, with patent number: US2022042069A1-2022-02-10. The patent is now held by Atlas Antibodies, therefore, as employees of Atlas Antibodies, T.M. and C.K. declare financial interest. The remaining authors declare no competing interests.

Figures

Fig. 1
Fig. 1. Schematic representation of the MolBoolean principle for detection of interacting and free proteins A and B.
a After binding their respective target proteins A and B, proximity probes A (black and magenta) and B (black and green) hybridize to the circle. Arrows signify oligonucleotide polarity. b The circle gets enzymatically nicked (cyan arrowhead indicates nicking position). c The circle gets invaded by reporter tags (tag A in magenta, tag B in green). d Enzymatic ligation of the reporter tags to the circle follows. e Rolling circle amplification (RCA) creates long concatemeric products (RCPs). f RCPs are detected via fluorescently labeled tag-specific detection oligonucleotides.
Fig. 2
Fig. 2. Single protein targeting and antibody validation.
a MolBoolean staining and quantification with two antibodies, one raised in mouse (M, magenta), and the other raised in rabbit (R, green), against distinct epitopes of β-catenin in MCF7 cells. Dual staining is shown in white and Hoechst33342 staining of nuclei is shown in blue. b MolBoolean technical controls, in which either one of the primary antibodies was omitted from the reaction mix. c In situ PLA colocalization staining, omitting controls and quantifications with the same pair of anti-β-catenin antibodies in MCF7 cells. In situ PLA signals are shown in magenta and nuclei in blue. d Immunofluorescent staining of MCF7 cells with the same pair of anti-β-catenin antibodies. Mouse antibody (magenta), rabbit antibody (green), overlay (white) and nuclei (blue). White frames depict an area shown in enlarged view in the following panel. Scale bars = 10 μm. Quantification of protein complexes and free proteins (MolBoolean) or protein complexes only (in situ PLA) shown as number of RCPs per cell. Data pooled from three independent experiments. Box plots show median, Q1 to Q3 range, lower and upper whiskers at maximum 1.5 times the interquartile range. Outliers shown as solid circles. Source data are provided as a Source Data file.
Fig. 3
Fig. 3. MolBoolean staining of E-cadherin with an interaction partner vs no-interaction partner.
a Co-stain of E-cadherin which is differentially expressed in MCF7 (positive for E-cadherin) and U2OS cells (negative for E-cadherin) and interaction partner β-catenin. (p = 1.76e−55; p = 1.89e−55; p = 7.84e−52 for E-cadherin-β-catenin complex, free E-cadherin, free β-catenin respectively). MolBoolean signals are shown for E-cadherin (magenta), β-catenin (green), E-cadherin-β-catenin complex (white) and nuclei (blue). b E-cadherin and LMNA/C in HaCaT cells are expected not to colocalize. MolBoolean signals are shown for E-cadherin (magenta), LMNA/C (green), E-cadherin-LMNA/C complex (white) and nuclei (blue). In situ PLA signals are shown in magenta and nuclei in blue. White frames depict an area shown in enlarged view in the following panel. Scale bars = 10 μm. Quantification of protein complexes and free proteins (MolBoolean) or protein complexes only (in situ PLA) shown as number of RCPs per cell. In (a) nMCF7 = 243, nU2OS = 125 cells. Data pooled from three independent experiments. Kruskal–Wallis and two-sided Dunn’s test with Bonferroni correction was used to analyze statistical variance. Box plots show median, Q1 to Q3 range, lower and upper whiskers at maximum 1.5 times the interquartile range. Outliers shown as solid circles. ****p < 0.0001. Source data are provided as a Source Data file.
Fig. 4
Fig. 4. Padlock probe design and in situ application in fixed cells.
a After proximity probes A and B bind their respective target proteins A and B, padlock oligonucleotides A and B hybridize to their respective arm in place of the MolBoolean circle. Each padlock contains the complementary tag sequence (magenta corresponds to tag A and green corresponds to tag B). b Enzymatic ligation of the 5’ and 3’ ends of each padlock, templated by the corresponding arm, leads to padlock circularization. c RCA, primed by the arms, creates long concatameric RCPs. d RCPs are detected via fluorescently labeled tag-specific detection oligonucleotides. e In situ application of the padlock probes and signal quantification. E-cadherin and β-catenin co-stain in MCF7 cells with padlock probes vs MolBoolean. (p = 1,46e−57; p = 9,69e−68; p = 1,98e−50 for E-cadherin-β-catenin complex, free E-cadherin, free β-catenin respectively). E-cadherin is shown in magenta, β-catenin in green, E-cadherin-β-catenin complex (MolBoolean), or overlay (padlock probes) in white and nuclei in blue. White frames depict an area shown in enlarged view in the following panel. Scale bars = 10 μm. Quantification of protein complexes and free proteins shown as normalized number of RCPs per cell. npadlock = 173, nMolBoolean = 243 cells; data pooled from three independent experiments. Kruskal–Wallis and two-sided Dunn’s test with Bonferroni correction was used to analyze statistical variance. Box plots show median, Q1 to Q3 range, lower and upper whiskers at maximum 1.5 times the interquartile range. Outliers shown as solid circles. ****p < 0.0001. Source data are provided as a Source Data file.
Fig. 5
Fig. 5. MolBoolean and in situ PLA staining of E-cadherin and β-catenin under various conditions in fixed cells or in tissues.
a Co-stain in stable AGS cell clones transfected with wild-type E-cadherin (WT, top panel) or E-cadherin with a V832M mutation in the β-catenin binding site (AGS V832M, bottom panel). (p = 6.51e−48; p = 0.17; p = 4.53e−26 for E-cadherin-β-catenin complex, free E-cadherin, free β-catenin respectively). b Co-stain in HaCaT cells, in the absence (“control”, top) or presence (“TGF-β1 treated”, bottom) of TGF-β1. (p = 7.64e−24; p = 1.66e−15; p = 0.92 E-cadherin-β-catenin complex, free E-cadherin, free β-catenin respectively (MolBoolean) and p = 2,94e−55 (in situ PLA)). c Co-stain in FFPE kidney tissue sections. MolBoolean signals are shown for E-cadherin (magenta), β-catenin (green), E-cadherin-β-catenin complex (white), and nuclei (blue). In situ PLA signals are shown in magenta and nuclei in blue. White frames depict an area shown in enlarged view in the following panel. Scale bars = 10 μm. Quantification of protein complexes and free proteins (MolBoolean) or protein complexes only (in situ PLA) shown as number of RCPs per cell in the case of fixed cell analysis, or in percentage of RCPs in each category (free protein A, free protein B, and AB complex) per frame in the case of tissue analysis. nWT = 1160, nV832M = 810 cells (a), and ncontrol = 371, ntreated = 113 cells (b). Data pooled from three independent experiments, and in (a, b) normalized against total number of signal/cell. Two-sided Wilcoxon rank sum test was used to analyze statistical variance in fixed cell data. Box plots show median, Q1 to Q3 range, lower and upper whiskers at maximum 1.5 times the interquartile range. Outliers shown as solid circles. ****p < 0.0001, ns not significant. Source data are provided as a Source Data file.
Fig. 6
Fig. 6. MolBoolean and in situ PLA staining of nuclear proteins in MCF7 cells.
a EMD and LMNB1 co-stain. MolBoolean signals are shown for EMD (magenta), LMNB1 (green), EMD-LMNB1 complex (white) and nuclei (blue). In situ PLA signals for EMD-LMNB1 complex are shown in magenta and nuclei in blue. b FUS and HNRNPM co-stain. MolBoolean signals are shown for FUS in magenta, HNRNPM (green), FUS-HNRNPM complex (white) and nuclei (blue). In situ PLA signals for FUS-HNRNPM complex are shown in magenta and nuclei in blue. White frames depict an area shown in enlarged view in the following panel. Scale bars = 10 μm. Quantification of protein complexes and free proteins (MolBoolean) or protein complexes only (in situ PLA) shown as number of RCPs per cell. Data pooled from three independent experiments. Box plots show median, Q1 to Q3 range, lower and upper whiskers at maximum 1.5 times the interquartile range. Source data are provided as a Source Data file.
Fig. 7
Fig. 7. MolBoolean staining in dynamic conditions.
a PDIA3 and CALR co-stain in untreated HaCaT cells (“control”, top), and after 72 h treatment with siPDIA3 (“PDIA3 knock-down”, bottom). Membrane represents Western blot, and Western blot quantification of silencing efficiency (92.5% knockdown, based on normalization against total protein stain) is shown in the bar chart below. (p = 2.56e−32; p = 2.81e−35; p = 1.94e−15 for PDIA3-CALR complex, free PDIA3 and free CALR respectively (MolBoolean); p = 2.19e-38 (in situ PLA)). MolBoolean signals are shown for PDIA3 (magenta), CALR (green), PDIA3-CALR complex (white) and nuclei (blue). In situ PLA signals for PDIA3-CALR complex are shown in magenta and nuclei in blue. b Clathrin and PDGFR-β co-stain in BJ-hTERT cells, in the absence (“control”, top) or presence (“PDGF-BB treated”, bottom) of PDGF-BB. (p = 6.76e−20; p = 5.88e−05; p = 1.36e−17 for Clathrin-PDGFR-β complex, free Clathrin and free PDGFR-β respectively (MolBoolean); p = 3.85e−22 (in situ PLA)). MolBoolean signals are shown for Clathrin (magenta), PDGFR-β (green), Clathrin-PDGFR-β complex (white) and nuclei (blue). In situ PLA signals for Clathrin-PDGFR-β complex are shown in magenta and nuclei in blue. White frames depict an area shown in enlarged view in the following panel. Scale bars = 10 μm. Quantification of protein complexes and free proteins (MolBoolean) or protein complexes only (in situ PLA) shown as number of RCPs per cell. ncontrol = 103, nknock-down = 104 cells (a). ncontrol = 150, ntreated = 140 cells (b). Data pooled from three independent experiments. Two-sided Wilcoxon rank sum test was used to analyze statistical variance. Box plots show median, Q1 to Q3 range, lower and upper whiskers at maximum 1.5 times the interquartile range. Outliers shown as solid circles. ****p < 0.0001. Source data are provided as a Source Data file.
Fig. 8
Fig. 8. MolBoolean and in situ PLA staining and quantification in FFPE tissue sections.
a ACE2 and TMPRSS2 co-stain in kidney. MolBoolean signals are shown for ACE2 (magenta), TMPRSS2 (green), ACE2-TMPRSS2 complex (white) and nuclei (blue). In situ PLA signals for ACE2-TMPRSS2 complex are shown in magenta and nuclei in blue. b SATB2 and HDAC1 co-stain in colon. MolBoolean signals are shown for SATB2 (magenta), HDAC1 (green), SATB2-HDAC1 complex (white) and nuclei (blue). In situ PLA signals for SATB2-HDAC1 complex are shown in magenta and nuclei in blue. White frames depict an area shown in enlarged view in the following panel. Scale bars = 10 μm. MolBoolean quantification shown in percentage of RCPs in each category (free protein A, free protein B and AB complex) per frame. Data collected from three independent experiments. Source data are provided as a Source Data file.

References

    1. Fields S, Song O. A novel genetic system to detect protein - protein interactions. Lett. Nat. 1989;340:245–246. doi: 10.1038/340245a0. - DOI - PubMed
    1. Petschnigg J, et al. The mammalian-membrane two-hybrid assay (mamth) for probing membrane-protein interactions in human cells. Artic. Nat. Methods. 2014;11:585. doi: 10.1038/nmeth.2895. - DOI - PubMed
    1. Hu C-D, Chinenov Y, Kerppola TK. Visualization of interactions among bZIP and Rel family proteins in living cells using bimolecular fluorescence complementation. Mol. Cell. 2002;9:789–798. doi: 10.1016/S1097-2765(02)00496-3. - DOI - PubMed
    1. Nguyen AW, Daugherty PS. Evolutionary optimization of fluorescent proteins for intracellular FRET. Nat. Biotechnol. 2005;3:355–360. doi: 10.1038/nbt1066. - DOI - PubMed
    1. Edelhoch H, Brand L, Wilchek M. Fluorescence studies with tryptophyl peptides. Biochemistry. 1967;6:547–559. doi: 10.1021/bi00854a024. - DOI - PubMed

Publication types

MeSH terms