. 2022 Aug 13;13(1):4757.
doi: 10.1038/s41467-022-32532-5.

Anionic nanoplastic exposure induces endothelial leakiness

Affiliations

Anionic nanoplastic exposure induces endothelial leakiness

Wei Wei et al. Nat Commun. .

Abstract

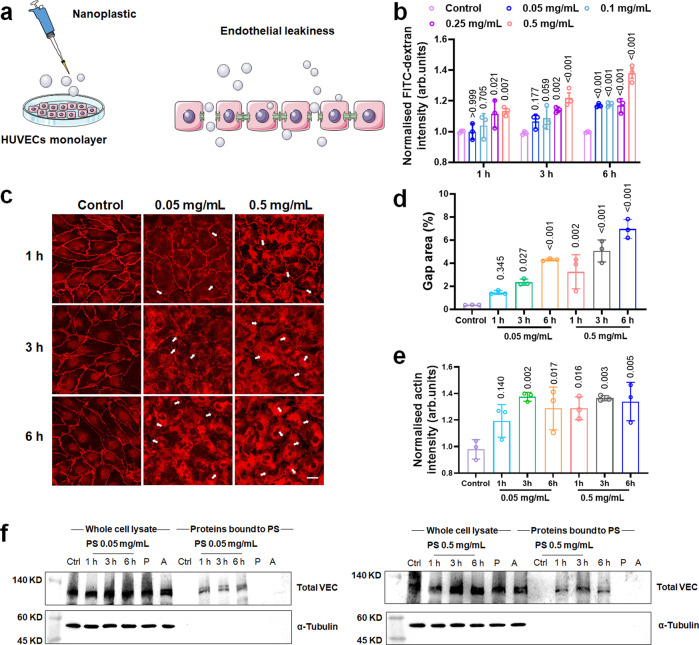
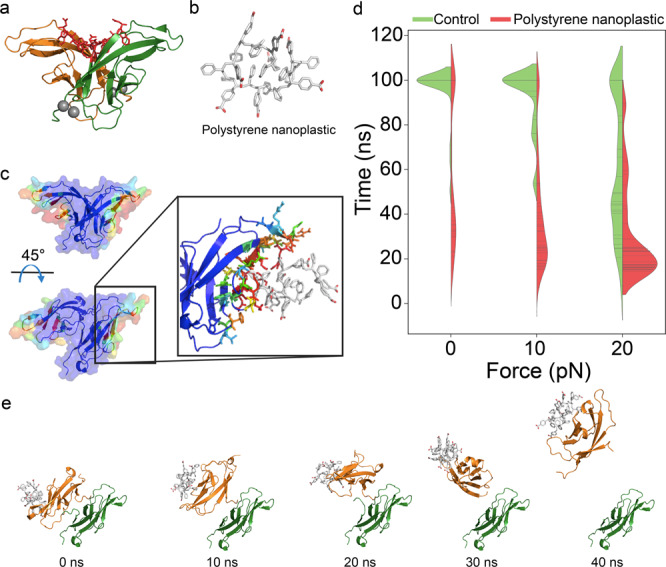
The global-scale production of plastics has been instrumental in advancing modern society, while the rising accumulation of plastics in landfills, oceans, and anything in between has become a major stressor on environmental sustainability, climate, and, potentially, human health. While mechanical and chemical forces of man and nature can eventually break down or recycle plastics, our understanding of the biological fingerprints of plastics, especially of nanoplastics, remains poor. Here we report on a phenomenon associated with the nanoplastic forms of anionic polystyrene and poly(methyl methacrylate), where their introduction disrupted the vascular endothelial cadherin junctions in a dose-dependent manner, as revealed by confocal fluorescence microscopy, signaling pathways, molecular dynamics simulations, as well as ex vivo and in vivo assays with animal model systems. Collectively, our results implicated nanoplastics-induced vasculature permeability as primarily biophysical-biochemical in nature, uncorrelated with cytotoxic events such as reactive oxygen species production, autophagy, and apoptosis. This uncovered route of paracellular transport has opened up vast avenues for investigating the behaviour and biological effects of nanoplastics, which may offer crucial insights for guiding innovations towards a sustainable plastics industry and environmental remediation.


Conflict of interest statement

The authors declare no competing interests.

Figures

Fig. 1
Fig. 1. Characterisations of polystyrene nanoplastic and their cytotoxicity.
a, b TEM imaging of polystyrene (PS) nanoplastic in Milli-Q water and their corresponding size distribution (n = 341 nanoparticles examined). Scale bar: 50 nm. c Functional groups of PS nanoplastic were determined by X-ray photoelectron spectroscopy (XPS) analysis. The dominant peak at 284.83 eV arose from C–C bonding, and the other peaks at 286.34 eV and 289.28 eV were attributed to C–O, and O=C–O bonding, respectively. d Toxicities of HUVECs upon exposure to different concentrations of PS nanoplastic at 22 h. Dead cells stained with PI were revealed in the red fluorescence channel (n = 3 biological replicates). Scale bars: 200  μm. e Cell viability with PS nanoplastic at 0.05 and 0.5 mg/mL was measured by a CCK8 assay at different times (1, 3, and 6 h). H2O2 (200 μM) was used as positive control. Statistical analysis was performed through a one-way ANOVA followed by Tukey’s multiple comparison tests. P values comparing to control in each group were inserted in the panel. f Evaluation of cell association for different concentrations of PS nanoplastic at 1, 3, and 6 h. The green fluorescence from nanoplastic was measured by flow cytometry. Data are expressed as means ± SD (n = 3). Statistical analysis was performed through a two-way ANOVA followed by Tukey’s multiple comparison tests. The derived P values were inserted in the panel. g Western blot and semi-quantitative analysis of microtubule-associated protein light chain 3-II/I (LC3-II/I) expression level. HUVECs were exposed to PS nanoplastic (0.05 and 0.5 mg/mL) for different times (1, 3 and 6 h). Rapamycin (1 μM) with 6 h-treatment was used as positive control. Protein levels were standardised by comparison with β-actin. Data are expressed as means ± SD. Biologically independent samples were used (n = 3). Statistical analysis was performed through two-way ANOVA followed by Tukey’s multiple comparison tests. The derived P values were inserted in the panel. Source data are provided as a Source Data file.
Fig. 2
Fig. 2. Polystyrene nanoplastic-induced endothelial leakiness in HUVECs.
a Illustrated interaction between adherens junctions and polystyrene (PS) nanoplastic. The integrity of the HUVECs monolayer was disrupted by the PS nanoplastic due to their interaction with VE-cadherin. b Transwell assay indicated a dose- and time-dependence in the leakiness of endothelial cell barriers. Data are expressed as means ± SD (n = 3 biologically independent samples). Statistical analysis was performed through one-way ANOVA followed by Tukey’s multiple comparison tests. The derived P values compared to control in each group were inserted in the panel. c Confocal fluorescence microscopy observed endothelial leakiness in the presence of different concentrations of PS nanoplastic (0.05 and 0.5 mg/mL) upon 1, 3, and 6 h exposure (n = 3 biological replicates). VE-cadherins was stained with red color. The white arrows indicate PS-induced gaps between HUVECs. Scale bar: 20 μm. d Semi-quantitative analysis of gaps area was performed by ImageJ software according to the images from panel c. Data are expressed as means ± SD (n = 3 biologically independent experiments). Statistical analysis was performed through two-way ANOVA followed by Tukey’s multiple comparison tests. The derived P values comparing to control were inserted in the panel. e Actin intensity was analysed by ImageJ software corresponding to the images in Supplementary Fig. 7. Actin filaments were stained by phalloidin-iFluor 488. Data are expressed as means ± SD (n = 3 biologically independent experiments). Statistical analysis was performed through two-way ANOVA followed by Tukey’s multiple comparison tests. The derived P values comparing to control were inserted in the panel. f PS directly bound to adherens junctional homophilic VE-cadherins (VEC) in a dose-dependent manner. Post lysis (P), addition of PS at 0.05 and 0.5 mg/mL to a non-treated control did not pull down any detectable VE-cadherins. Protein A/G magnetic beads (A) were added to show that no detectable VE-cadherins were precipitated without the addition of PS (n = 3 biologically independent experiments). Source data are provided as a Source Data file. (Some art elements in panel a are from smart.servier.com.).
Fig. 3
Fig. 3. Characterisations of NH2-PS and PMMA nanoplastics and their NanoEL competence with HUVECs.
a TEM imaging of NH2-PS and PMMA nanoplastics in H2O (n = 3 independent samples). b Functional groups of NH2-PS and PMMA nanoplastics were determined by XPS analysis. The major peaks for NH2-PS at 402.06 and 400.02 eV were referable to C–N and N–H bonding, respectively. The dominant peak for PMMA at 284.74 eV arose from C–C or C=C bonding, and the peaks at 286.33 eV and 288.57 eV can be attributed to C–O, and O=C–OH bonding, respectively. c, d Cell viability of NH2-PS and PMMA nanoplastics at 0.05 and 0.5 mg/mL, measured by a CCK8 assay at different times (1, 3, and 6 h). H2O2 (200 μM) was used as positive control. Data are expressed as means ± SD (n = 3 biologically independent experiments). Statistical analysis was performed through one-way ANOVA followed by Tukey’s multiple comparison tests. The derived P values comparing to control were inserted in the panel. e, f Transwell assay indicated positive-charged NH2-PS nanoplastic was incompetent in inducing endothelial leakiness, while negatively charged PMMA nanoplastic triggered leakage of endothelial cell barriers. Data are expressed as means ± SD (n = 3 biologically independent experiments). Statistical analysis was performed through two-way ANOVA followed by Tukey’s multiple comparison tests. The derived P values comparing to control were inserted in the panel. g Confocal fluorescence microscopy revealed endothelial leakiness in the presence of PMMA nanoplastic (0.05 and 0.5 mg/mL) upon 1, 3, and 6 h treatments (n = 3 biologically independent experiments). The white arrows indicate gaps between HUVECs. While no endothelial leakiness was observed in NH2-PS nanoplastic treatment. Scale bar: 20 μm. Source data are provided as a Source Data file.
Fig. 4
Fig. 4. Polystyrene nanoplastic-induced endothelial leakiness is independent of ROS formation and endocytosis but is related to VE-cadherin signaling pathway and actin remodeling.
a Blocking endocytosis with inhibitors or ROS inhibition did not prevent leakiness of PS nanoplastic. However, Src kinase inhibitor PP1 and ROCK inhibitor Y-27632 affected the leakiness of PS nanoplastic. HUVECs were treated with Src kinase inhibitor PP1 (10 µM), rho-associated protein kinase (ROCK) inhibitor Y-27632 (10 µM), endocytosis inhibitors (5 mM methyl-β-cyclodextrin (MβCD) and 10 µM monodansylcadaverine (MDC)), or ROS inhibitor (5 mM N-Acetyl-L-cysteine (NAC)) for 1 h prior to b 0.05 mg/mL or c 0.5 mg/mL PS nanoplastic treatment. PP1 and Y-27632 significantly reduced the fold of FITC-dextran penetration compared to their respective counterparts without inhibitor treatments. MβCD, MDC, or NAC did not significantly decrease the fold of FITC-dextran penetration compared to their respective counterparts without inhibitor treatments. Data are expressed as means ± SD. Biologically independent samples were used (n = 3). Statistical analysis was performed through one-way ANOVA followed by Tukey’s multiple comparison tests. The derived P values were inserted in the panel. Western blot analysis of VE-cadherin and its phosphorylation levels: d 0.05 mg/mL or e 0.5 mg/mL PS nanoplastic treatment induced tyrosine phosphorylation of VE-cadherin at Y658 and Y731. However, PP1 effectively inhibited PS nanoplastic-induced phosphorylation of VE-cadherin at Y658 and Y731. f Semi-quantitative analysis revealed activation of VE-cadherin (VEC) signaling exposed to PS nanoplastic (0.05 or 0.5 mg/mL). Data are expressed as means ± SD (n = 3 biologically independent experiments). Statistical analysis was performed through two-way ANOVA followed by Tukey’s multiple comparison tests. The derived P values were inserted in the panel. Source data are provided as a Source Data file.
Fig. 5
Fig. 5. Discrete molecular dynamics (DMD) and steered DMD (sDMD) simulations of the binding frequency of polystyrene (PS) nanoplastic with a VE-cadherin dimer as well as cadherin dimer stability.
a Structure of the EC1 cadherin dimer. Red sticks and gray spheres indicate the domain-swapped region and calcium ions, respectively. b Structure of a carboxylated PS nanoplastic after 50 ns equilibrium DMD simulation. c Colour-coded binding frequency of the PS nanoplastic on the EC1 cadherin dimer surface. Blue and red colors represent low to high binding frequencies. The enlarged panel details nanoplastic binding with the EC1 dimer. d Violin plots of the dimer binding with the PS nanoplastic. e Representative dissociation trajectories of the dimer in the presence of the PS nanoplastic under 0 pN of pulling.
Fig. 6
Fig. 6. Polystyrene nanoplastic-induced endothelial leakiness ex vivo in rabbit and swine vessels (a–c) and in vivo in mice (d, e).
a Schematic of the ex vivo construct. b Concentration-dependent increase in Evans blue dye (EBD) penetration in rabbit vessels. Quantifications of EBD indicated that the 0.05 and 0.5 mg/mL polystyrene (PS) nanoplastic groups were significantly different from untreated control. 0.5 mg/mL PS nanoplastic induced more leakiness than the 0.05 mg/mL PS nanoplastic group. Data are expressed as means ± SD. Biologically independent samples were used (n = 3). Statistical analysis was performed through one-way ANOVA followed by Tukey’s multiple comparison tests. The derived P values comparing to control were inserted in the panel. c Concentration-dependent increase of EBD penetration in swine vessels. EBD penetration was more pronounced in the 5 mg/mL PS nanoplastic group than the 0.5 mg/mL PS nanoplastic group. Data are presented as means ± SD (n = 3 biologically independent samples), analysed via one-way ANOVA followed by Tukey’s multiple comparison tests. The derived P values comparing to control were inserted in the panel. d Male Swiss mice received intravenous injection of PS nanoplastic (1.5, 15, or 30 mg/kg)-containing 10 mM EBD solution. Control mice received once intravenous injection of 10 mM EBD. After 24 h, the mice were sacrificed to collect their organs for imaging. The fluorescence signal gradually increased from yellow to red with increased dose of the nanoplastic. The greater extent of EBD leakiness was, the stronger the fluorescence signal. e PS nanoplastic promoted leakiness of subcutaneous blood vessels in mice. PS nanoplastic (30 mg/kg) were injected into subcutaneous pockets on the back of the mice. EBD was injected via tail intravenous injection. Quantification of EBD showed more endothelial leakiness in the PS group compared with the untreated mice group. Data are expressed as means ± SD (n = 3 biologically independent animals), analysed via two-tailed Student’s t-test. The derived P values comparing to control were inserted in the panel. Source data are provided as a Source Data file. (Some art elements in panel a are from smart.servier.com.).

References

    1. Wang L, et al. Environmental fate, toxicity and risk management strategies of nanoplastics in the environment: Current status and future perspectives. J. Hazard. Mater. 2021;401:123415. doi: 10.1016/j.jhazmat.2020.123415. - DOI - PMC - PubMed
    1. PlasticsEurope. Plastics- the facts 2019. PlasticsEurope, (2019).
    1. Bhattacharya P, Lin S, Turner JP, Ke PC. Physical adsorption of charged plastic nanoparticles affects algal photosynthesis. J. Phys. Chem. C. 2010;114:16556–16561. doi: 10.1021/jp1054759. - DOI
    1. Prata JC. Airborne microplastics: Consequences to human health? Environ. Pollut. 2018;234:115–126. doi: 10.1016/j.envpol.2017.11.043. - DOI - PubMed
    1. Lim SL, et al. Targeted metabolomics reveals differential biological effects of nanoplastics and nanozno in human lung cells. Nanotoxicology. 2019;13:1117–1132. doi: 10.1080/17435390.2019.1640913. - DOI - PubMed

Publication types