Validation of the Reduced Unified Continuum Formulation Against In Vitro 4D-Flow MRI
- PMID: 35963921
- PMCID: PMC11402517
- DOI: 10.1007/s10439-022-03038-4
Validation of the Reduced Unified Continuum Formulation Against In Vitro 4D-Flow MRI
Abstract
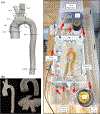
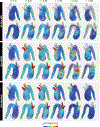
We previously introduced and verified the reduced unified continuum formulation for vascular fluid-structure interaction (FSI) against Womersley's deformable wall theory. Our present work seeks to investigate its performance in a patient-specific aortic setting in which assumptions of idealized geometries and velocity profiles are invalid. Specifically, we leveraged 2D magnetic resonance imaging (MRI) and 4D-flow MRI to extract high-resolution anatomical and hemodynamic information from an in vitro flow circuit embedding a compliant 3D-printed aortic phantom. To accurately reflect experimental conditions, we numerically implemented viscoelastic external tissue support, vascular tissue prestressing, and skew boundary conditions enabling in-plane vascular motion at each inlet and outlet. Validation of our formulation is achieved through close quantitative agreement in pressures, lumen area changes, pulse wave velocity, and early systolic velocities, as well as qualitative agreement in late systolic flow structures. Our validated suite of FSI techniques offers a computationally efficient approach for numerical simulation of vascular hemodynamics. This study is among the first to validate a cardiovascular FSI formulation against an in vitro flow circuit involving a compliant vascular phantom of complex patient-specific anatomy.
Keywords: Compliant 3D printing; Fluid–structure interaction; In vitro validation; Magnetic resonance imaging; Pulse wave velocity.
© 2022. The Author(s) under exclusive licence to Biomedical Engineering Society.
Conflict of interest statement
CONFLICT OF INTEREST
No benefits in any form have been or will be received from a commercial party related directly or indirectly to the subject of this manuscript.
Figures


Similar articles
-
Idealized aortic annuloplasty FSI digital twin of 3D-printed phantoms with 4D-flow MRI comparison.Comput Biol Med. 2025 Jun;192(Pt B):110398. doi: 10.1016/j.compbiomed.2025.110398. Epub 2025 May 18. Comput Biol Med. 2025. PMID: 40388869
-
A novel MRI-based data fusion methodology for efficient, personalised, compliant simulations of aortic haemodynamics.J Biomech. 2021 Dec 2;129:110793. doi: 10.1016/j.jbiomech.2021.110793. Epub 2021 Oct 9. J Biomech. 2021. PMID: 34715606 Free PMC article.
-
Patient-specific compliant simulation framework informed by 4DMRI-extracted pulse wave Velocity: Application post-TEVAR.J Biomech. 2024 Oct;175:112266. doi: 10.1016/j.jbiomech.2024.112266. Epub 2024 Aug 22. J Biomech. 2024. PMID: 39232449
-
A comprehensive MRI-based computational model of blood flow in compliant aorta using radial basis function interpolation.Biomed Eng Online. 2024 Jul 23;23(1):69. doi: 10.1186/s12938-024-01251-x. Biomed Eng Online. 2024. PMID: 39039565 Free PMC article.
-
Fluid-Structure Interaction Within Models of Patient-Specific Arteries: Computational Simulations and Experimental Validations.IEEE Rev Biomed Eng. 2024;17:280-296. doi: 10.1109/RBME.2022.3215678. Epub 2024 Jan 12. IEEE Rev Biomed Eng. 2024. PMID: 36260570 Review.
Cited by
-
A hemodynamic analysis of energy loss in abdominal aortic aneurysm using three-dimension idealized model.Front Physiol. 2024 Jan 19;15:1330848. doi: 10.3389/fphys.2024.1330848. eCollection 2024. Front Physiol. 2024. PMID: 38312315 Free PMC article.
-
Validation of ultrasound velocimetry and computational fluid dynamics for flow assessment in femoral artery stenotic disease.J Med Imaging (Bellingham). 2024 May;11(3):037001. doi: 10.1117/1.JMI.11.3.037001. Epub 2024 May 16. J Med Imaging (Bellingham). 2024. PMID: 38765874 Free PMC article.
-
Non-invasive Estimation of Pressure Drop Across Aortic Coarctations: Validation of 0D and 3D Computational Models with In Vivo Measurements.Ann Biomed Eng. 2024 May;52(5):1335-1346. doi: 10.1007/s10439-024-03457-5. Epub 2024 Feb 10. Ann Biomed Eng. 2024. PMID: 38341399
-
Hemodynamic effects of entry and exit tear size in aortic dissection evaluated with in vitro magnetic resonance imaging and fluid-structure interaction simulation.Sci Rep. 2023 Dec 18;13(1):22557. doi: 10.1038/s41598-023-49942-0. Sci Rep. 2023. PMID: 38110526 Free PMC article.
-
A hybrid mock circulatory loop integrated with a LED-PIV system for the investigation of AAA compliant phantoms.Front Bioeng Biotechnol. 2024 Oct 10;12:1452278. doi: 10.3389/fbioe.2024.1452278. eCollection 2024. Front Bioeng Biotechnol. 2024. PMID: 39450327 Free PMC article.
References
-
- Alastruey J, Numerical modelling of pulse wave propagation in the cardiovascular system: development, validation and clinical applications. PhD thesis, Imperial College London, 2006.
-
- Annio G, Torii R, Ducci A, Muthurangu V, Tsang V, and Burriesci G, Experimental validation of enhanced magnetic resonance imaging (EMRI) using particle image velocimetry (PIV). Ann. Biomed. Eng. 49:3481–3493, 2021. - PubMed
-
- Bazilevs Y, Hsu M-C, Zhang Y, Wang W, Kvamsdal T, Hentschel S, and Isaksen J, Computational vascular fluid-structure interaction: methodology and application to cerebral aneurysms. Biomech. Model. Mechanobiol. 9(4):481–498, 2010. - PubMed
MeSH terms
Grants and funding
- R01 HL123689/HL/NHLBI NIH HHS/United States
- Stanford Graduate Fellowship in Science and Engineering/Stanford University
- R01EB01830204/NH/NIH HHS/United States
- 1R01HL121754/NH/NIH HHS/United States
- 12172160/National Natural Science Foundation of China
- R01 LM013120/LM/NLM NIH HHS/United States
- 1R01HL123689/NH/NIH HHS/United States
- Graduate Research Fellowship/National Science Foundation
- R01 HL121754/HL/NHLBI NIH HHS/United States
- R01 EB029362/EB/NIBIB NIH HHS/United States
- 2020B1212030001/Guangdong-Hong Kong-Macao Joint Laboratory for Data-Driven Fluid Mechanics and Engineering Applications
LinkOut - more resources
Full Text Sources
Medical

