. 2022 Aug 13;12(1):13800.
doi: 10.1038/s41598-022-17970-x.

Mapping and understanding of correlated electroencephalogram (EEG) responses to the newsvendor problem

Affiliations

Mapping and understanding of correlated electroencephalogram (EEG) responses to the newsvendor problem

Nghi Cong Dung Truong et al. Sci Rep. .

Abstract

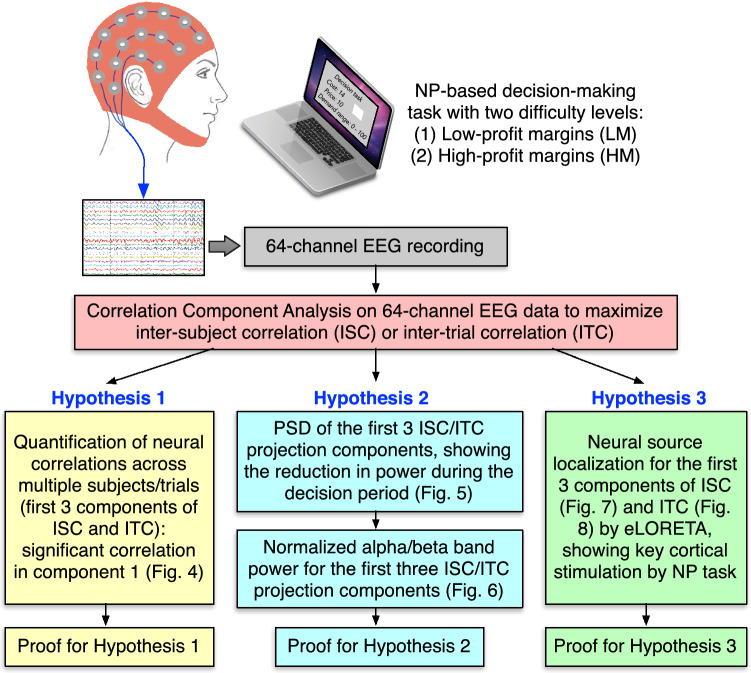
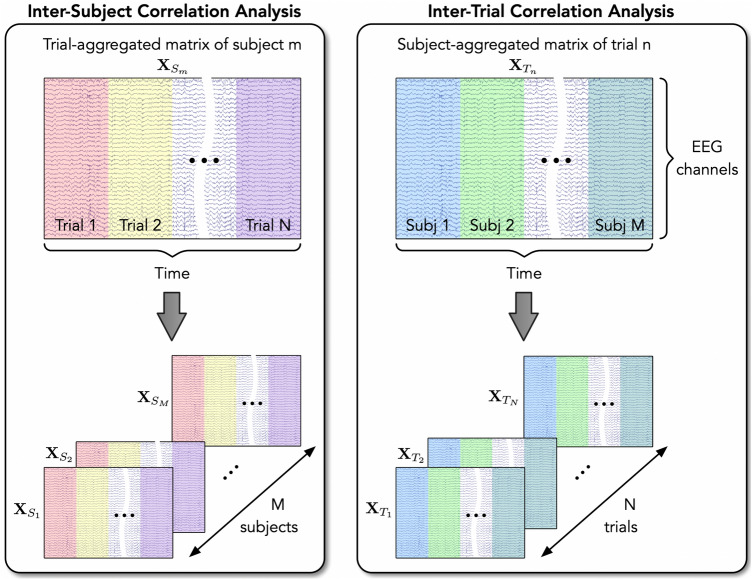
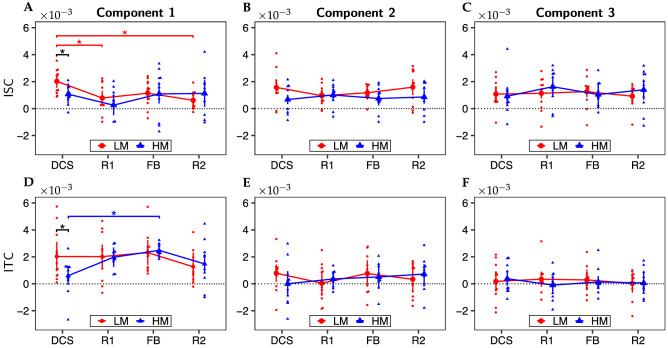
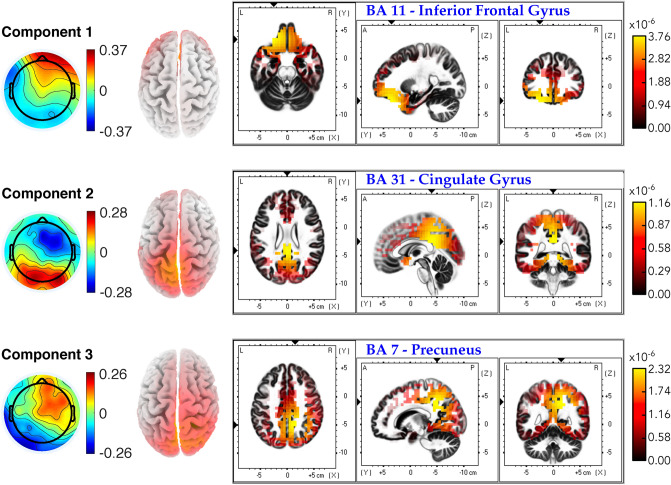
Decision-making is one of the most critical activities of human beings. To better understand the underlying neurocognitive mechanism while making decisions under an economic context, we designed a decision-making paradigm based on the newsvendor problem (NP) with two scenarios: low-profit margins as the more challenging scenario and high-profit margins as the less difficult one. The EEG signals were acquired from healthy humans while subjects were performing the task. We adopted the Correlated Component Analysis (CorrCA) method to identify linear combinations of EEG channels that maximize the correlation across subjects ([Formula: see text]) or trials ([Formula: see text]). The inter-subject or inter-trial correlation values (ISC or ITC) of the first three components were estimated to investigate the modulation of the task difficulty on subjects' EEG signals and respective correlations. We also calculated the alpha- and beta-band power of the projection components obtained by the CorrCA to assess the brain responses across multiple task periods. Finally, the CorrCA forward models, which represent the scalp projections of the brain activities by the maximally correlated components, were further translated into source distributions of underlying cortical activity using the exact Low Resolution Electromagnetic Tomography Algorithm (eLORETA). Our results revealed strong and significant correlations in EEG signals among multiple subjects and trials during the more difficult decision-making task than the easier one. We also observed that the NP decision-making and feedback tasks desynchronized the normalized alpha and beta powers of the CorrCA components, reflecting the engagement state of subjects. Source localization results furthermore suggested several sources of neural activities during the NP decision-making process, including the dorsolateral prefrontal cortex, anterior PFC, orbitofrontal cortex, posterior cingulate cortex, and somatosensory association cortex.


Conflict of interest statement

Kay-Yut Chen has a potential research conflict of interest due to a financial interest with companies Hewlett-Packard Enterprise, Boostr, and DecisionNext. A management plan has been created to preserve objectivity in research in accordance with UTA policy. All other authors had neither competing financial interests nor other potential conflicts of interest.

Figures

Figure 1
Figure 1
Flowchart outlining the hypotheses, procedural steps, and intended results for the study of 64-channel EEG data in response to the NP-based decision-making task.
Figure 2
Figure 2
Experimental protocol. (A) Diagram of the NP-based experimental protocol. The whole experiment consisted of 30 s of rest (baseline) and 40 consecutive trials. Each trial included a maximum of 20 s of decision, 5 s of the first rest, 10 s of feedback, and 5 s of the second rest. EEG data were recorded throughout the whole experiment. (B, C) Computer screens of decision and feedback phases shown to subjects during the NP-based task.
Figure 3
Figure 3
Illustration of the EEG data generation for the ISC and ITC analyses.
Figure 4
Figure 4
Results of the first three CorrCA components for (AC) ISC and (EF) ITC in response to LM (red; n=12) and HM (blue; n=11) decision-making tasks during four experimental periods, namely, decision (DCS), first rest (R1), feedback (FB), and second rest (R2). Significant differences between a period pair or between LM and HM tasks are marked as ‘*’ for p<0.05 after FDR correction.
Figure 5
Figure 5
Averaged power spectral density (PSD) of 4 task periods (DCS (red), R1 (blue), FB (pink), and R2 (green)) for the first three ISC/ITC projection components calculated from all subjects of both LM and HM groups (n=23). Specifically, (A) depicts the PSDs of three ISC projection components, and (B) shows those of three ITC projection components. The shade of each curve indicated the standard error of the mean of each group.
Figure 6
Figure 6
Normalized alpha- and beta-band power of the first three CorrCA projection components for ISC and ITC under four task periods (DCS, R1, FB, and R2) pooled from HM and LM. Specifically, (A) shows normalized alpha-band power of three ISC projection components; (B) normalized beta-band power of three ISC projection components; (C) normalized alpha-band power of three ITC projection components; (D) normalized beta-band power of three ITC projection components. Statistical results obtained by Tukey multiple comparison tests are mark as ‘***’ for pTukey<0.001, ‘**’ for pTukey<0.01, and ‘*’ for pTukey<0.05.
Figure 7
Figure 7
Neural source localization results for the first three ISC components. The scalp projections are shown in the leftmost column for respective components. The second column presents the estimated source distributions (top view). The remaining plots exhibit three orthogonal slices corresponding to the primary sources of the localization results. Full views of 3D source distributions for each component were depicted in Figure SC.1 of Supplementary Material C.
Figure 8
Figure 8
Neural source localization results for the first three ITC components. The scalp projections are shown in the leftmost column for respective components. The second column presents the estimated source distributions (top view). The remaining plots exhibit three orthogonal slices corresponding to the primary sources of the localization results. Full views of 3D source distributions for each component were depicted in Figure SC.2 of Supplementary Material C.

References

    1. Wyart V, de Gardelle V, Scholl J, Summerfield C. Rhythmic fluctuations in evidence accumulation during decision making in the human brain. Neuron. 2012;76:847–858. doi: 10.1016/j.neuron.2012.09.015. - DOI - PMC - PubMed
    1. Larsen T, O’Doherty JP. Uncovering the spatio-temporal dynamics of value-based decision-making in the human brain: A combined fMRI-EEG study. Philos. Trans. R. Soc. B: Biol. Sci. 2014;369:20130473. doi: 10.1098/rstb.2013.0473. - DOI - PMC - PubMed
    1. Kyathanahally SP, Franco-Watkins A, Zhang X, Calhoun VD, Deshpande G. A realistic framework for investigating decision making in the brain with high spatiotemporal resolution using simultaneous EEG/fMRI and joint ICA. IEEE J. Biomed. Health Inform. 2016;21:814–825. doi: 10.1109/JBHI.2016.2590434. - DOI - PubMed
    1. Pisauro MA, Fouragnan E, Retzler C, Philiastides MG. Neural correlates of evidence accumulation during value-based decisions revealed via simultaneous EEG-fMRI. Nat. Commun. 2017;8:15808. doi: 10.1038/ncomms15808. - DOI - PMC - PubMed
    1. Hu Y, et al. Inter-brain synchrony and cooperation context in interactive decision making. Biol. Psychol. 2018;133:54–62. doi: 10.1016/j.biopsycho.2017.12.005. - DOI - PubMed

Publication types