Review
. 2022 Aug 13;26(1):247.
doi: 10.1186/s13054-022-04115-9.

Bedside assessment of left atrial pressure in critical care: a multifaceted gem

Affiliations
Review

Bedside assessment of left atrial pressure in critical care: a multifaceted gem

Emma Maria Bowcock et al. Crit Care. .

Abstract

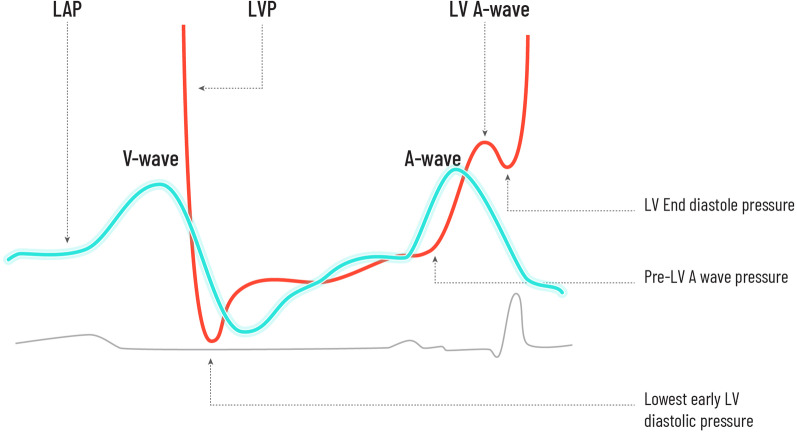
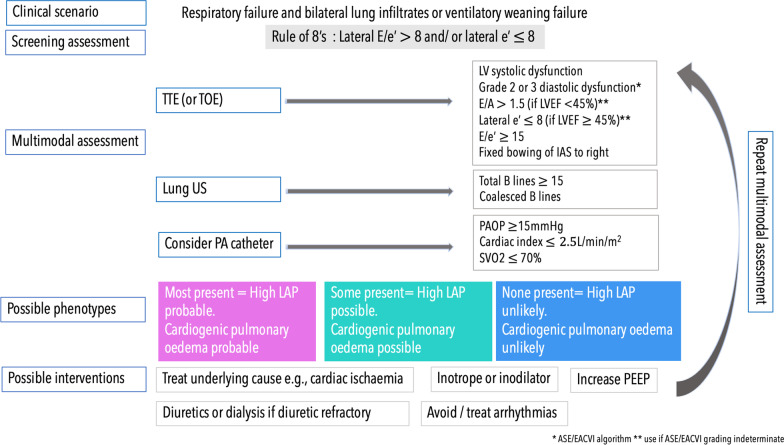
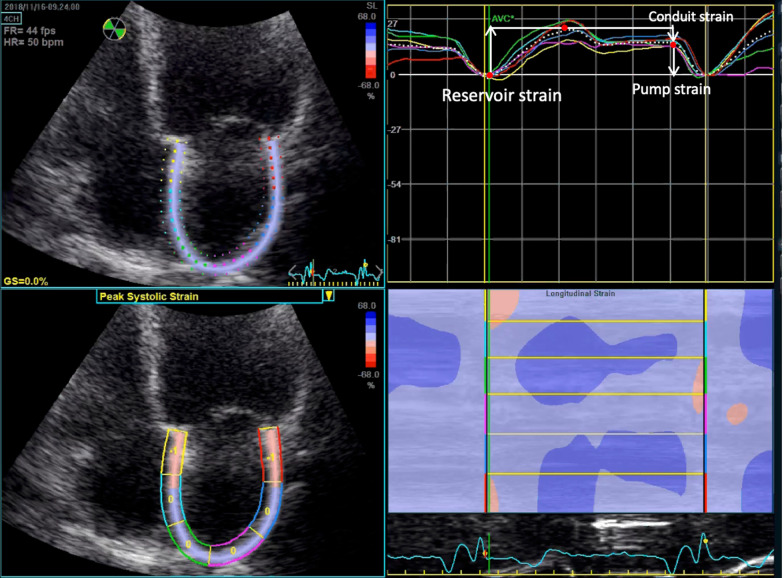
Evaluating left atrial pressure (LAP) solely from the left ventricular preload perspective is a restrained approach. Accurate assessment of LAP is particularly relevant when pulmonary congestion and/or right heart dysfunction are present since it is the pressure most closely related to pulmonary venous pressure and thus pulmonary haemodynamic load. Amalgamation of LAP measurement into assessment of the 'transpulmonary circuit' may have a particular role in differentiating cardiac failure phenotypes in critical care. Most of the literature in this area involves cardiology patients, and gaps of knowledge in application to the bedside of the critically ill patient remain significant. Explored in this review is an overview of left atrial physiology, invasive and non-invasive methods of LAP measurement and their potential clinical application.

Keywords: Cardiac phenotypes; Left atrial physiology; Left atrial pressure; Left atrial strain; Left ventricular end-diastolic pressure; Right ventricular–pulmonary circuit; Transpulmonary circuit.


Conflict of interest statement

The authors declare that they have no competing interests.

Figures

Fig. 1
Fig. 1
Relationship between the left atrial and left ventricular pressures
Fig. 2
Fig. 2
Relationship between pulmonary vein (PV) pressure, LAP and mitral inflow Doppler waves throughout the cardiac cycle. PV Doppler D wave mirrors the mitral E wave and occurs at the time of the Y descent. PV A wave is concomitant to the mitral Doppler A wave and to left atrial contraction. The corresponding reservoir, conduit and pump functions of the left atrium are shown. MV mitral valve
Fig. 3
Fig. 3
PAOP trace showing the ‘mid A point’ and large ‘V’ wave (patients with mitral regurgitation or reduced LA compliance). An integrated digitised mean over the entire cardiac cycle would include the ‘V’ wave and give a higher PAOP value than a PAOP measurement taken at the ‘mid A point’. PAOP pulmonary artery occlusion pressure
Fig. 4
Fig. 4
ePLAR = TRV/E/e′. Post-capillary pulmonary hypertension (PHT) is characterised by a lower ePLAR given E/e′ will be higher in these groups. Pre-capillary PHT with lower E/e′ has a higher ePLAR ratio. (A cut off value of < 0.28 m/s for post-capillary PH yielded 83% sensitivity and specificity, AUC 0.87) [12]. TRVmax tricuspid regurgitation maximum velocity, m/sec. PAP pulmonary artery pressure, mmHg
Fig. 5
Fig. 5
ASE/EACVI algorithms for estimating LAP in those with  reduced left ventricular ejection fraction (EF) of < 50% (or normal EF with the presence of structural disease). Left panel, demonstrates where E/A ratio and E velocity, or E/A alone can differentiate normal versus elevated LAP in those with grade 1 and grade 3 diastolic dysfunction, respectively. Right panel, demonstrates a patient where 3 further criteria are required to decide if there is raised LAP: E/e′, TR Velocity and LA volume index (LAVI) showing a patient with grade 2 diastolic dysfunction and raised LAP
Fig. 6
Fig. 6
Proposed multimodal algorithm for a patient presenting with acute hypoxic respiratory failure or failing to wean from mechanical ventilation. Methods for assessment of LAP and its upstream consequence of cardiogenic pulmonary oedema as well as targeted treatment options suggested. * [24], **[29]
Fig. 7
Fig. 7
LA strain using non-foreshortened A4C LA views. White dashed strain curve showing average values of 6 segments. Ventricular end-diastole is recommended as the time reference to define the zero-baseline for strain curves. As depicted by the white arrows: LA reservoir strain = difference of the strain value at mitral valve opening minus ventricular end-diastole. LA conduit strain = difference of the strain value at the onset of atrial contraction minus mitral valve opening. LA pump strain = difference of the strain value at ventricular end-diastole minus onset of atrial contraction [44]

Similar articles

Cited by

References

    1. Thomas L, Marwick TH, Popescu BA, Donal E, Badano LP. Left atrial structure and function, and left ventricular diastolic dysfunction: JACC state-of-the-art review. J Am Coll Cardiol. 2019;73(15):1961–1977. doi: 10.1016/j.jacc.2019.01.059. - DOI - PubMed
    1. Marra AM, Sherman AE, Salzano A, Guazzi M, Saggar R, Squire IB, et al. Right side of the heart pulmonary circulation unit involvement in left-sided heart failure. Chest. 2022;161(2):535–551. doi: 10.1016/j.chest.2021.09.023. - DOI - PubMed
    1. Orde S, Slama M, Hilton A, Yastrebov K, McLean A. Pearls and pitfalls in comprehensive critical care echocardiography. Crit Care. 2017;21(1):1–10. doi: 10.1186/s13054-017-1866-z. - DOI - PMC - PubMed
    1. Sanfilippo F, Corredor C, Arcadipane A, Landesberg G, Vieillard-Baron A, Cecconi M, et al. Tissue Doppler assessment of diastolic function and relationship with mortality in critically ill septic patients: a systematic review and meta-analysis. Br J Anaesth. 2017;119(4):583–594. doi: 10.1093/bja/aex254. - DOI - PubMed
    1. Medeiros K, O’Connor MJ, Baicu CF, Fitzgibbons TP, Shaw P, Tighe DA, et al. Systolic and diastolic mechanics in stress cardiomyopathy. Circulation. 2014;129(16):1659–1667. doi: 10.1161/CIRCULATIONAHA.113.002781. - DOI - PubMed