. 2022 Nov:25:101511.
doi: 10.1016/j.tranon.2022.101511. Epub 2022 Aug 11.

Comprehensive characterization of immune landscape of Indian and Western triple negative breast cancers

Affiliations

Comprehensive characterization of immune landscape of Indian and Western triple negative breast cancers

Aruna Korlimarla et al. Transl Oncol. 2022 Nov.

Erratum in

Abstract

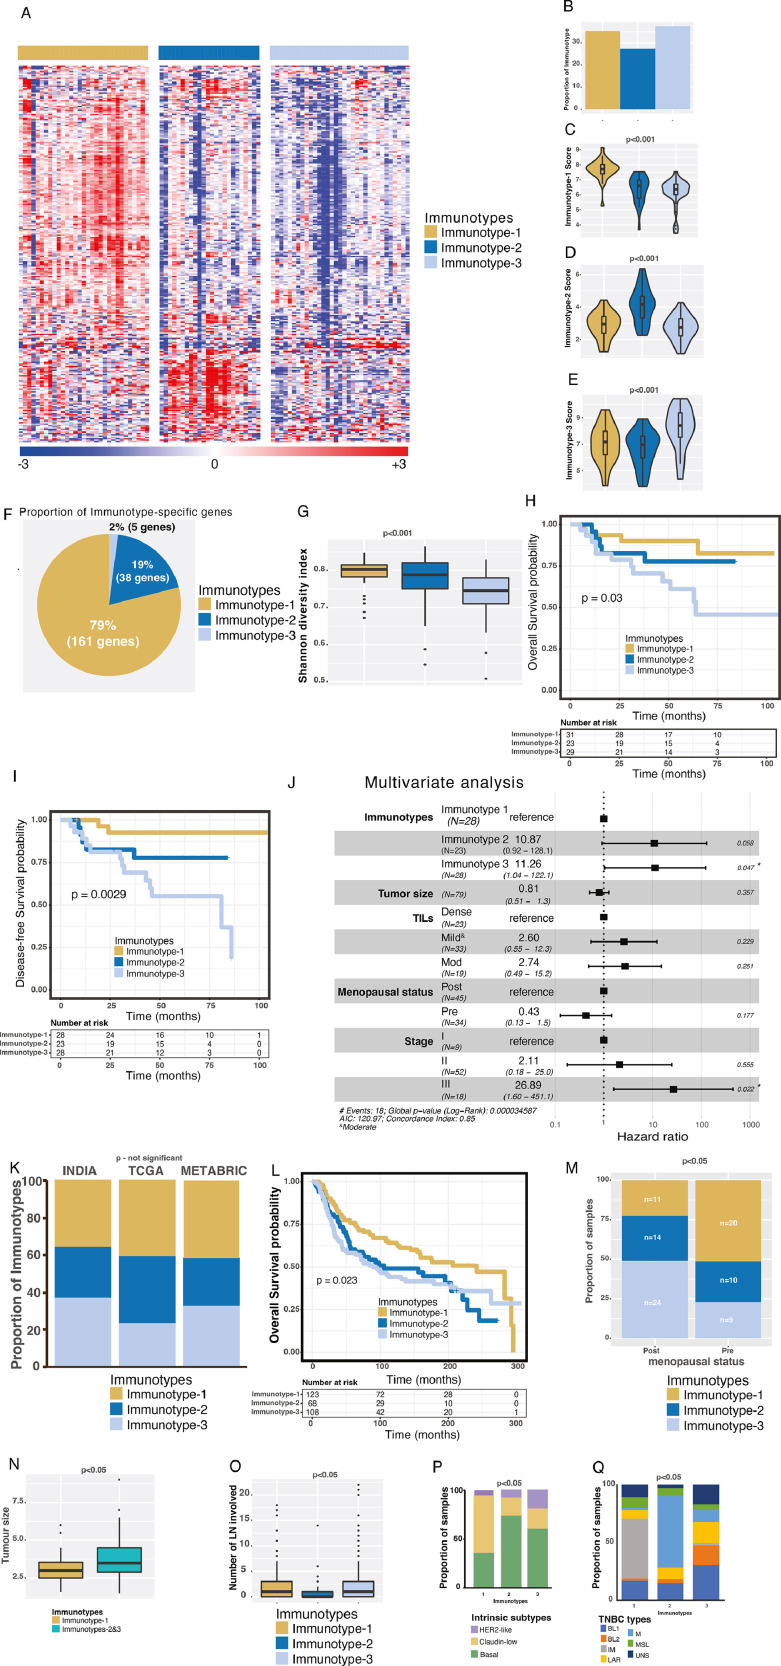
Purpose: Triple-negative breast cancer (TNBC) is a heterogeneous disease with a significant challenge to effectively manage in the clinic worldwide. Immunotherapy may be beneficial to TNBC patients if responders can be effectively identified. Here we sought to elucidate the immune landscape of TNBCs by stratifying patients into immune-specific subtypes (immunotypes) to decipher the molecular and cellular presentations and signaling events of this heterogeneous disease and associating them with their clinical outcomes and potential treatment options.

Experimental design: We profiled 730 immune genes in 88 retrospective Indian TNBC samples using the NanoString platform, established immunotypes using non-negative matrix factorization-based machine learning approach, and validated them using Western TNBCs (n=422; public datasets). Immunotype-specific gene signatures were associated with clinicopathological features, immune cell types, biological pathways, acute/chronic inflammatory responses, and immunogenic cell death processes. Responses to different immunotherapies associated with TNBC immunotypes were assessed using cross-cancer comparison to melanoma (n=504). Tumor-infiltrating lymphocytes (TILs) and pan-macrophage spatial marker expression were evaluated.

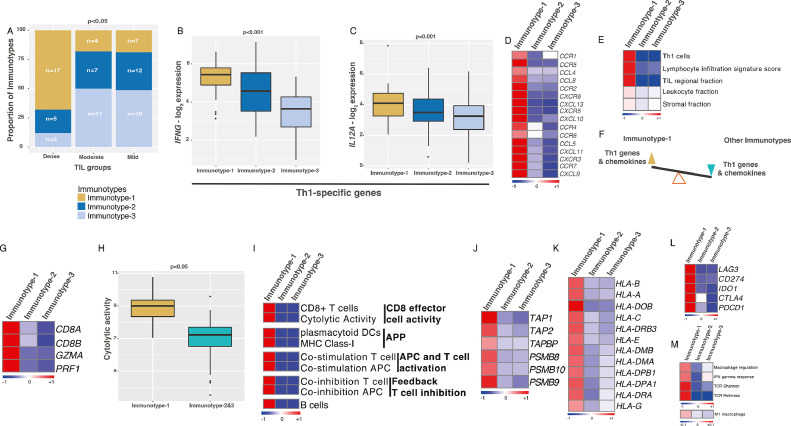
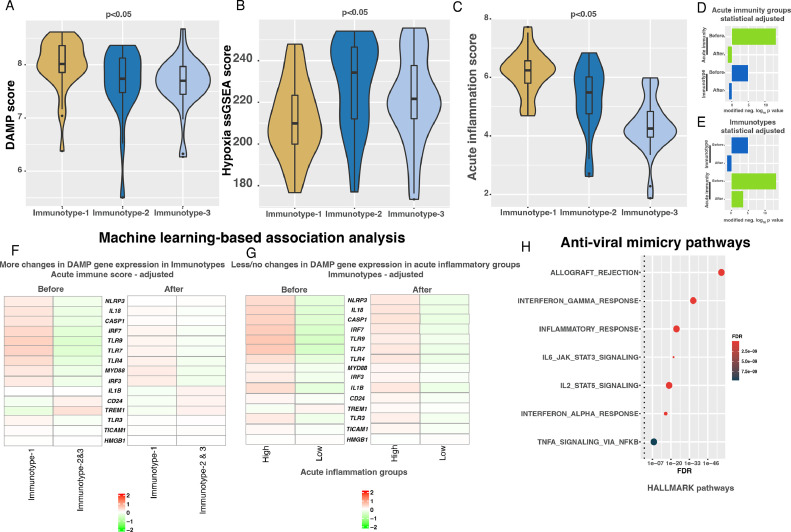
Results: We identified three robust transcriptome-based immunotypes in both Indian and Western TNBCs in similar proportions. Immunotype-1 tumors, mainly representing well-known claudin-low and immunomodulatory subgroups, harbored dense TIL infiltrates and T-helper-1 (Th1) response profiles associated with smaller tumors, pre-menopausal status, and a better prognosis. They displayed a cascade of events, including acute inflammation, damage-associated molecular patterns, T-cell receptor-related and chemokine-specific signaling, antigen presentation, and viral-mimicry pathways. On the other hand, immunotype-2 was enriched for Th2/Th17 responses, CD4+ regulatory cells, basal-like/mesenchymal immunotypes, and an intermediate prognosis. In contrast to the two T-cell enriched immunotypes, immunotype-3 patients expressed innate immune genes/proteins, including those representing myeloid infiltrations (validated by spatial immunohistochemistry), and had poor survival. Remarkably, a cross-cancer comparison analysis revealed the association of immunotype-1 with responses to anti-PD-L1 and MAGEA3 immunotherapies.

Conclusion: Overall, the TNBC immunotypes identified in TNBCs reveal different prognoses, immune infiltrations, signaling, acute/chronic inflammation leading to immunogenic cell death of cancer cells, and potentially distinct responses to immunotherapies. The overlap in immune characteristics in Indian and Western TNBCs suggests similar efficiency of immunotherapy in both populations if strategies to select patients according to immunotypes can be further optimized and implemented.

Keywords: Global oncology; Immune cells; Immune subtypes; Immunotherapy; India; Triple-negative breast cancer.


Conflict of interest statement

Declaration of Competing Interest AS has the following patents - Patient classification and prognostic method (GEP-NET) – Priority Patent – EP18425009.0, Patent – “Molecular predictors of therapeutic response to specific anti-cancer agents” (patent number US9506926B2). AS serves as a Scientific Advisor for Diagnostring Laboratories and Enedra Therapeutics and served as an Advisor for 4baseCare.

Figures

Fig. 1
Fig. 1
Identification and clinical characterization of immune immunotypes using the Indian TNBC samples and comparison with Western TNBC cohorts. A. Heatmap of immunotypes from Indian TNBC (n=88) identified by NMF clustering method. Immunotypes are shown on the top bar. The scales are shown at the bottom. B. Proportion of immunotypes from 88 Indian TNBCs. C-E. Immunotype-specific scores. F. Proportion of immunotype-specific genes out of 204 genes. G. Shannon diversity index of three immune immunotypes. H-I. Kaplan-Meier curves representing H) OS (n=83) and I) DFS (n=79) from the Indian TNBC cohort. J. Multivariate analysis of DFS and other clinical parameters. K. Proportion of three immune immunotypes in different cohorts of samples from India (n=88) and Western populations – TCGA (n=123) and METABRIC (n=299). L. Kaplan-Meier curve representing OS from the METABRIC TNBC cohort (n=299). M. Proportion of pre- and post-menopausal samples represented in three immune immunotypes from the Indian TNBC cohort (n=81). N. Tumor size differences in immune immunotypes from the Indian TNBC cohort (n=86). O. Number of LNs involved in different immune immunotypes from the METABRIC cohort (n=299). P-Q. Proportion of P) intrinsic (n=284; 2 luminal-A and 10 normal-like samples were excluded), and Q) Vanderbilt immunotypes represented in immune immunotypes from the METABRIC cohort (n=268; see supplementary information). Kruskal-Wallis statistical test was performed for most of the analysis, except for survival analysis and proportion analysis, where the log-rank test was used for survival analysis and chi-squared test was used for the proportions. p-value of <0.05 was considered significant.
Fig. 2
Fig. 2
Immune and clinical characteristics specific to Immunotype-1. A. Proportion of dense, moderate, and mild TILS represented in three immunotypes from the Indian TNBC cohort (n=84). Chi-squared test was used for p-value calculation. B-C. Gene expression of Th1 response genes – (B) IFNG and (C) IL12A in immunotypes from the Indian TNBC cohort (n=88). D. Heatmap showing chemokine average expression per immunotype. E. Heatmap validation of specific immune characteristics (as mean values per subtype) in immunotypes from TCGA data (n=123). F. Schematic representing balance in Th1 response and chemokine gene expression in immunotypes. G-L. Heatmaps and boxplot showing changes in mean (G) CD8 T-cell-specific genes, (H) cytolytic activity, (I) T and B cell types and activities based on ssGSEA analysis, (J) antigen presenting and processing genes, (K) MHC-I &II HLA genes, (L) T-cell exhaustion genes per subtype from the Indian TNBC cohort (n=88). M. Heatmap showing macrophages, IFNG response, TCR diversity and intratumoral heterogeneity (as mean values per subtype) from TCGA data (n=123). All the figures used the Indian TNBC cohort (n=88), except figures (E) and (M), where TCGA data was used. Kruskal-Wallis statistical test was performed for p-value significance for those in boxplots.
Fig. 3
Fig. 3
Machine-learning based association analysis of acute inflammation, immunotypes and DAMP gene expression in the Indian cohort. A-C. Boxplots showing differential changes in DAMP, hypoxia and acute inflammation scores from the Indian TNBC cohort (n=88). Kruskal-Wallis statistical test was performed for p-value significance. D-E. Barplots showing significant (p<0.01; linear regression) association of 15 DAMP genes with D) acute inflammation (high vs. low) and E) immunotypes (Immunotype-1 vs. others) in principal component (PC1) as assessed by PPCCA method using the Indian TNBC cohort (n=88). F. Heatmap showing change in 15 DAMP pathway genes (median expression across samples from each immunotype) in immunotypes before and after statistically adjusting acute inflammation using the PPCCA method using the Indian TNBC cohort (n=88). G. Heatmap showing change in 15 DAMP pathway genes (median expression across samples from each immunotype) in acute inflammation low and high groups before and after statistically adjusting immunotypes using the PPCCA method using the Indian TNBC cohort (n=88). H. Dotplot showing enrichment of anti-viral-mimicry pathways in Immunotype-1 from hallmarks gene sets from the Molecular Signature DataBase (MSigDB) database using Immunotype-1-specific genes. False discovery rate (FDR) was calculated from p-values from hypergeometric test using hypeR R package (see methods).
Fig. 4
Fig. 4
Association of gene enrichment and therapy response to immune TNBC immunotypes. A-B. Barplot showing gene enrichment of (A) BIOCARTA and (B) Reactome pathways using Enrichr tool (see Methods) in Immunotype-1. C. Schematic showing TCR and downstream signalling that effects immune cell types based on data curated from the Indian TNBC gene expression, pathway analysis in (A-B) and literature. D. Multiomics enrichment analysis validation specific pathways from (C) using TCGA TNBC samples (n=18). Kruskal-Wallis statistical test was performed for p-value significance. E. Boxplot showing differential T-cell-inflammed gene expression profile (GEP) in immunotypes in the Indian cohort (n=88). F. Kaplan-Meier curve and median survival data showing differential OS in melanoma samples (pre-treatment; Mariathasan et al. ; n=348) with high and low enrichment of Immunotype-1 genes and their association with immunotherapy response. Log-rank test was performed for p-value significance. G. Barplot showing the association of immune immunotypes with clinical RECIST response to immunotherapy in melanoma (Mariathasan et al. ; n=298). * - represents a significant (p<0.05; Kruskal-Wallis test) enrichment in samples with high Immunotype-1 score compared to those with low score. H. Boxplot showing differential MAGEA3 therapy response signature in immunotypes in the Indian cohort (n=88). I. Proportion of melanoma samples (n=56; GSE35640) showing immune TNBC immunotypes with differential MAGEA3 therapy response, as a cross-cancer comparison analysis. Kruskal-Wallis statistical test was performed for p-value significance for (E) and (H). Chi-squared test was performed for p-value calculations for (G) and (I).
Fig. 5
Fig. 5
Immune characteristics specific to Immunotype-2. A-D. Gene expression of Th2 and Th17 response genes – (A) IL4, (B) IL5, (C) IL17B and (D) IL17A in immune immunotypes using the Indian TNBC cohort (n=88). E. Schematic representing balance in Th2 and Th17 response and chemokine gene expression in immunotypes. F. Boxplot showing changes in CD4+ T regulatory cells in immune immunotypes as assessed by ssGSEA analysis using the Indian TNBC cohort (n=88). G. Boxplot showing changes in tumor purity in immune immunotypes from the TCGA data (n=101). H-I. Barplot showing enrichment of (A) KEGG and (B) Reactome pathways using Enrichr tool (see Methods) in immunotype-2. J. A table showing BIOCARTA enrichment analysis in Immunotype-2. Kruskal-Wallis statistical test was performed for p-value significance for A-G).
Fig. 6
Fig. 6
Immune characteristics and validation of macrophage markers in Immunotype-3. A. Heatmap showing Immunotype-3 specific genes associated with macrophages and neutrophils. B. Boxplot showing changes in macrophages in immune immunotypes as assessed by ssGSEA analysis using the Indian TNBC cohort (n=88). C-D. IHC and quantitation (n=39) of pan-macrophage marker – CD68 in immune immunotype samples using the Indian cohort. E. Boxplot showing differential changes in chronic inflammation scores in immune immunotypes using the Indian cohort (n=88). F. Kaplan-Meier curve and median survival data showing differential OS in samples with high and low enrichment of immune TNBC Immunotype-3 genes in melanoma samples (pre-treatment; Mariathasan et al. ; n=348). Kruskal-Wallis statistical test was performed for p-value significance for A), D) and E). Log-rank test was performed for p-value significance for F).
Fig. 7
Fig. 7
Summary of TNBC immunotypes and their characteristics. A. Molecular characteristics of immunotypes. B. Clinical characteristics of immunotypes.

Similar articles

Cited by

References

    1. Sung H, Ferlay J, Siegel RL, Laversanne M, Soerjomataram I, Jemal A, Bray F. Global cancer statistics 2020: GLOBOCAN estimates of incidence and mortality worldwide for 36 cancers in 185 countries. CA Cancer J. Clin. 2021;71(3):209–249. - PubMed
    1. Boyle P. Triple-negative breast cancer: epidemiological considerations and recommendations. Ann. Oncol. 2012;23(Suppl 6) vi7-12. - PubMed
    1. Bianchini G, De Angelis C, Licata L, Gianni L. Treatment landscape of triple-negative breast cancer - expanded options, evolving needs. Nat. Rev. Clin. Oncol. 2021 - PubMed
    1. Lehmann BD, Bauer JA, Chen X, Sanders ME, Chakravarthy AB, Shyr Y, Pietenpol JA. Identification of human triple-negative breast cancer subtypes and preclinical models for selection of targeted therapies. J. Clin. Invest. 2011;121(7):2750–2767. - PMC - PubMed
    1. Burstein MD, Tsimelzon A, Poage GM, Covington KR, Contreras A, Fuqua SA, Savage MI, Osborne CK, Hilsenbeck SG, Chang JC, et al. Comprehensive genomic analysis identifies novel subtypes and targets of triple-negative breast cancer. Clin. Cancer Res. 2015;21(7):1688–1698. - PMC - PubMed