. 2022 Sep:55:102406.
doi: 10.1016/j.redox.2022.102406. Epub 2022 Jul 30.

Increased NOS coupling by the metabolite tetrahydrobiopterin (BH4) reduces preeclampsia/IUGR consequences

Affiliations

Increased NOS coupling by the metabolite tetrahydrobiopterin (BH4) reduces preeclampsia/IUGR consequences

Laurent Chatre et al. Redox Biol. 2022 Sep.

Abstract

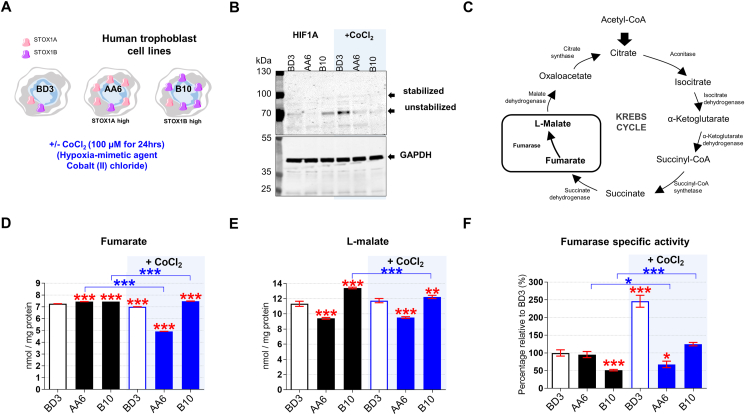
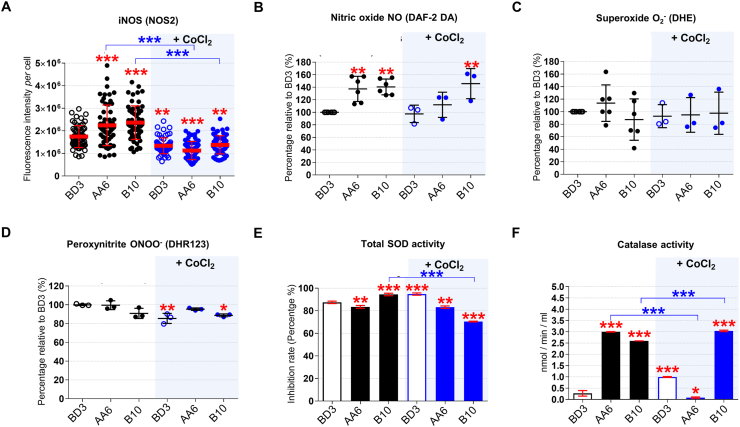
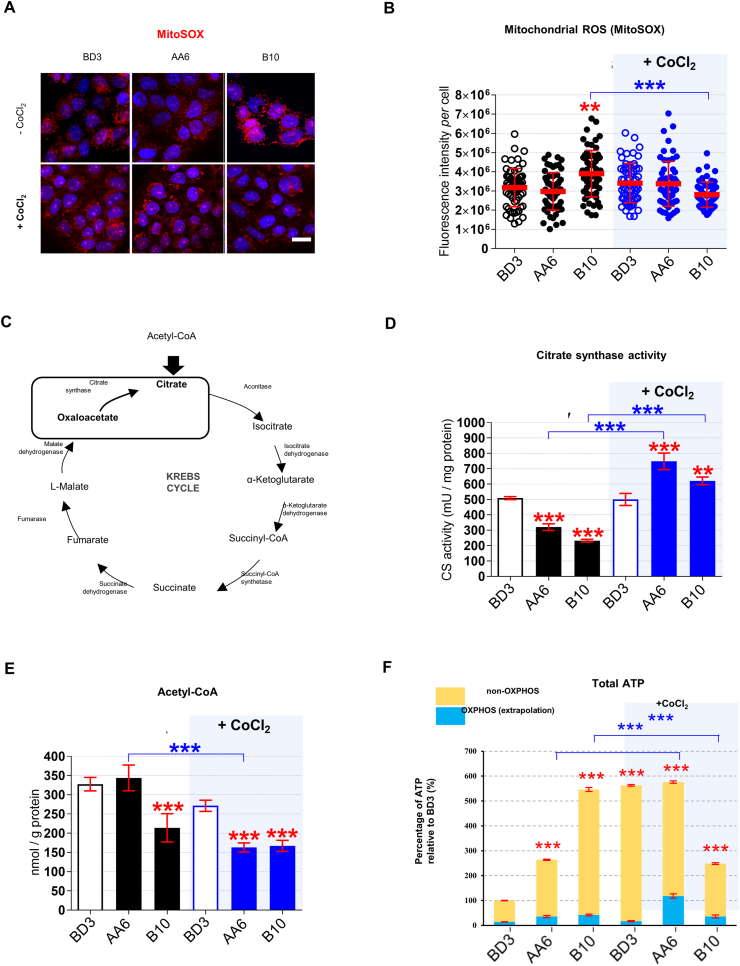
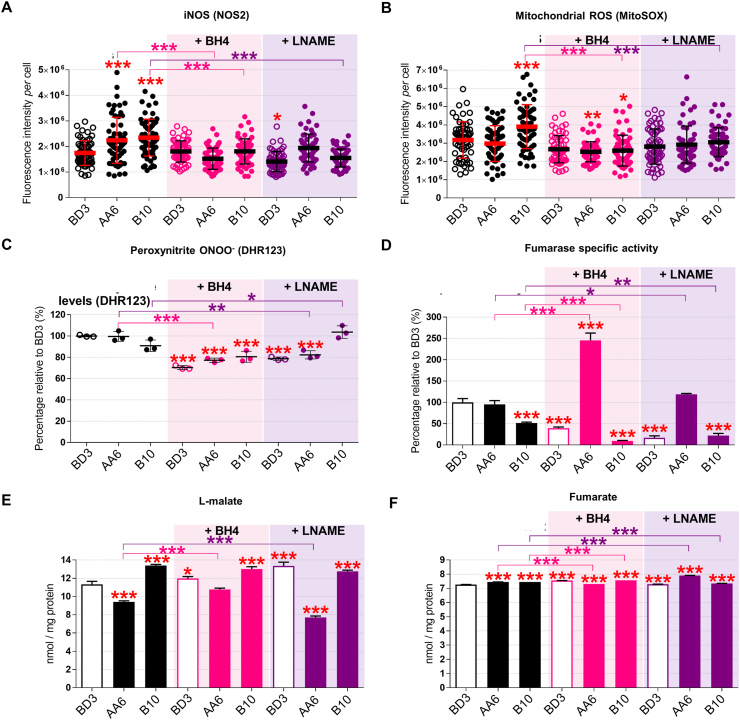
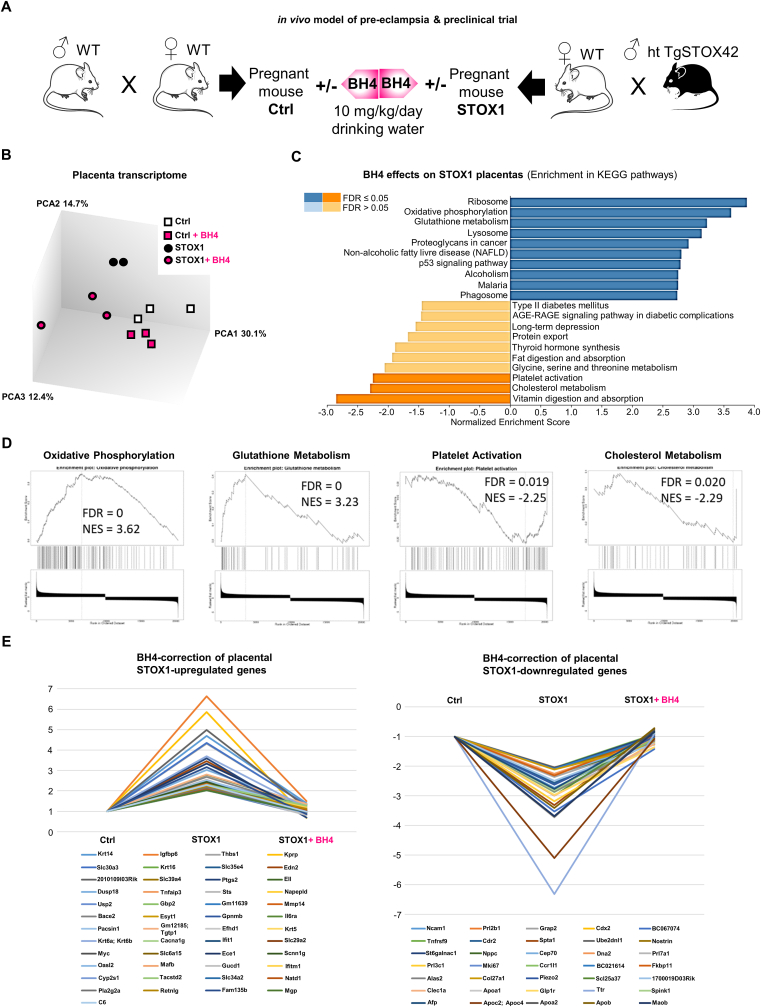
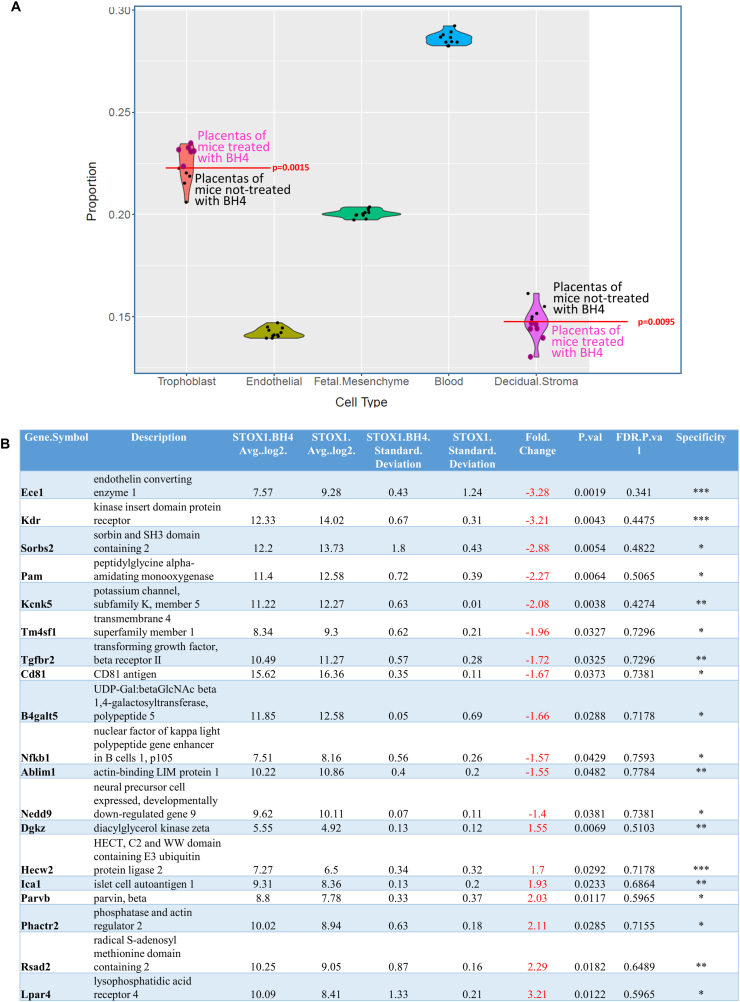
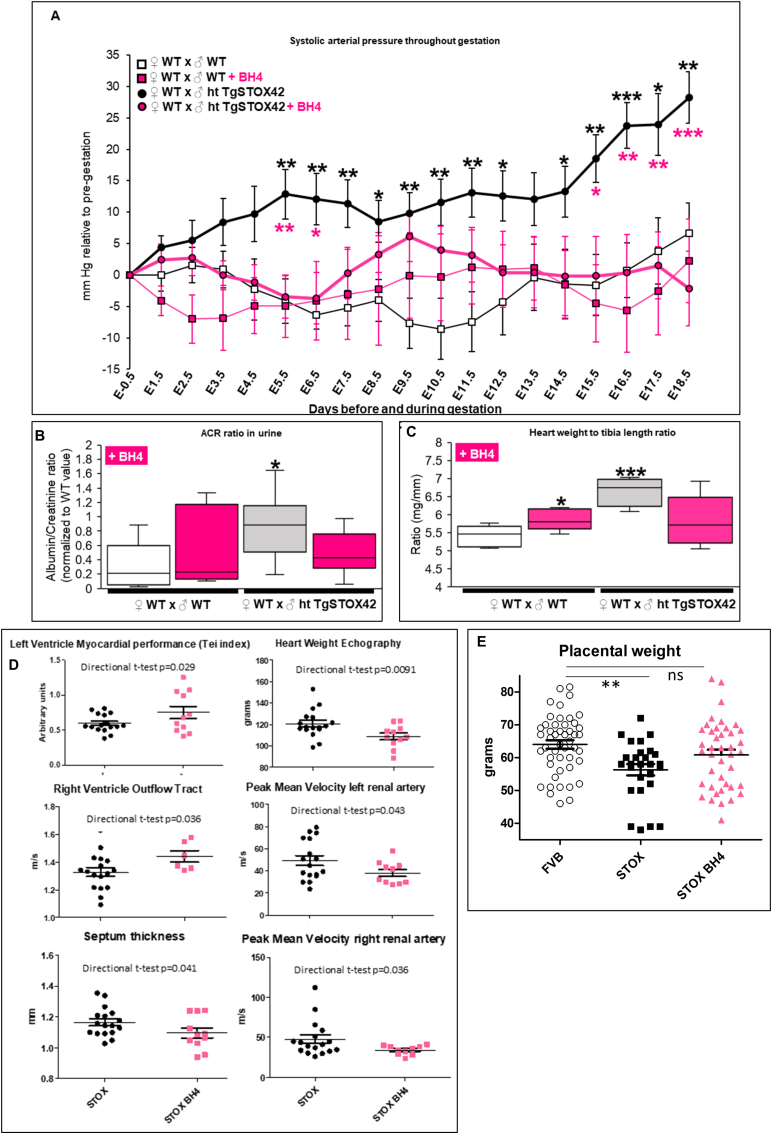
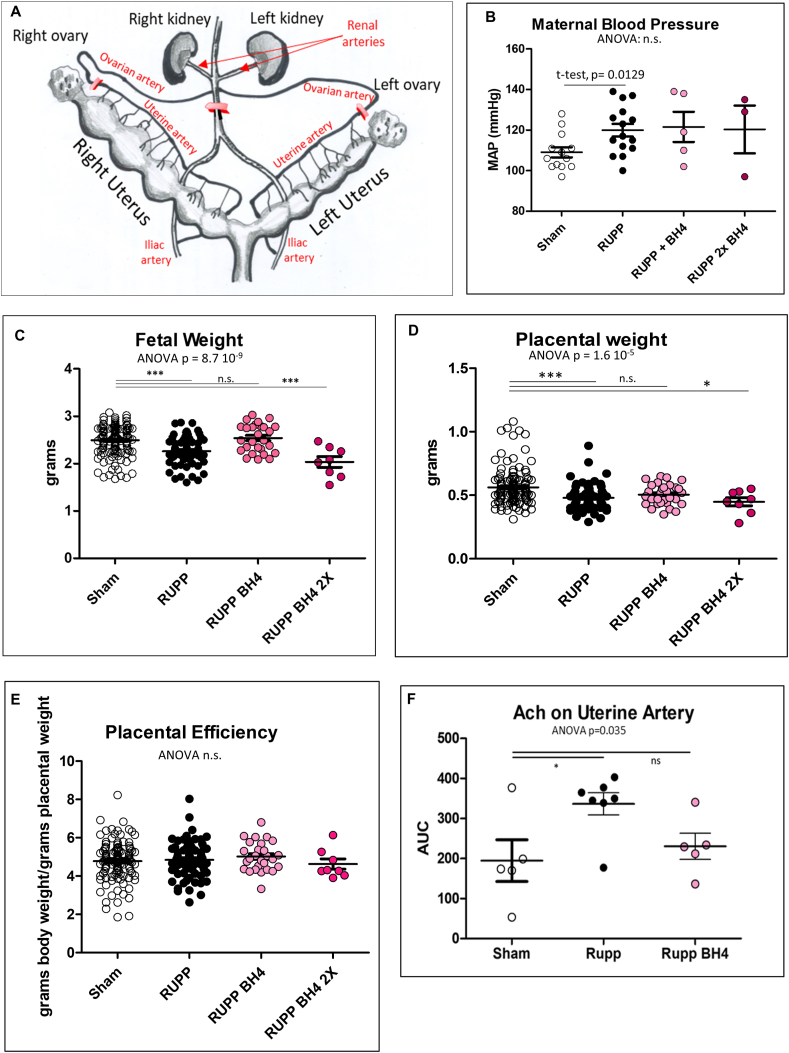
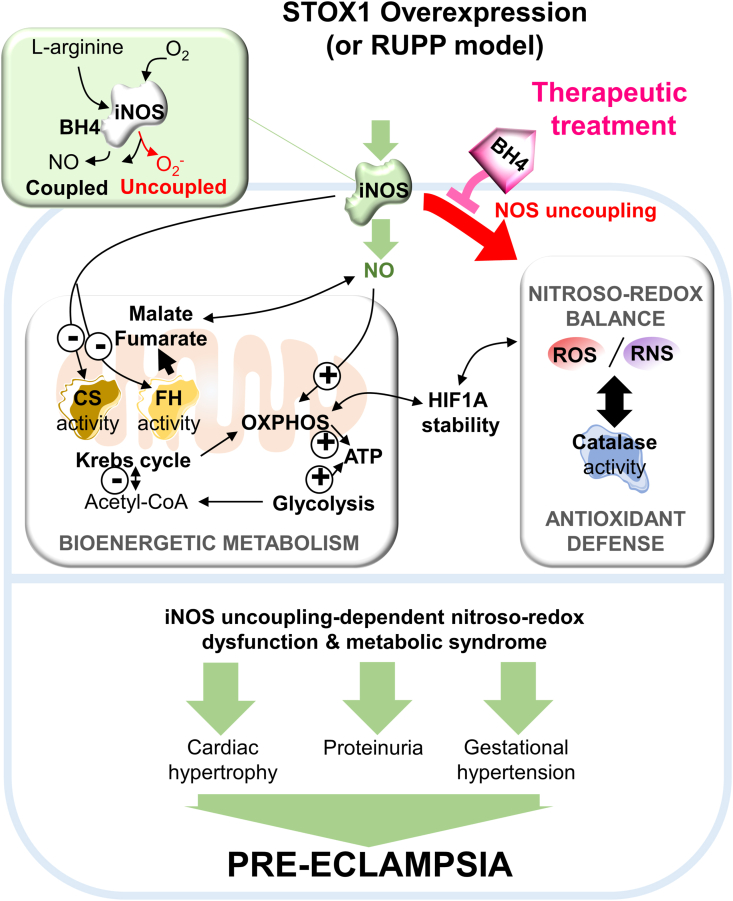
Preeclampsia (PE) is a high-prevalence pregnancy disease characterized by placental insufficiency, gestational hypertension, and proteinuria. Overexpression of the A isoform of the STOX1 transcription factor (STOX1A) recapitulates PE in mice, and STOX1A overexpressing trophoblasts recapitulate PE patients hallmarks in terms of gene expression and pathophysiology. STOX1 overexpression induces nitroso-redox imbalance and mitochondrial hyper-activation. Here, by a thorough analysis on cell models, we show that STOX1 overexpression in trophoblasts alters inducible nitric oxide synthase (iNOS), nitric oxide (NO) content, the nitroso-redox balance, the antioxidant defense, and mitochondrial function. This is accompanied by specific alterations of the Krebs cycle leading to reduced l-malate content. By increasing NOS coupling using the metabolite tetrahydrobiopterin (BH4) we restore this multi-step pathway in vitro. Moving in vivo on two different rodent models (STOX1 mice and RUPP rats, alike early onset and late onset preeclampsia, respectively), we show by transcriptomics that BH4 directly reverts STOX1-deregulated gene expression including glutathione metabolism, oxidative phosphorylation, cholesterol metabolism, inflammation, lipoprotein metabolism and platelet activation, successfully treating placental hypotrophy, gestational hypertension, proteinuria and heart hypertrophy. In the RUPP rats we show that the major fetal issue of preeclampsia, Intra Uterine Growth Restriction (IUGR), is efficiently corrected. Our work posits on solid bases BH4 as a novel potential therapy for preeclampsia.

Keywords: Malate; Mitochondria; Nitroso-redox balance; Preeclampsia; STOX1; Tetrahydrobiopterin; iNOS.


Conflict of interest statement

The authors declare that they have no known competing financial interests or personal relationships that could have appeared to influence the work reported in this paper.

Figures

Fig. 1
Fig. 1
Hypoxia and STOX1 overexpression affect the fumarate-dependentl-malate pathway. (A) Characteristics of control, STOX1A and STOX1B over-expressing human trophoblast cell lines, and experimental plan in the presence and in the absence of the hypoxia-mimetic agent CoCl2. (B) Immunoblot of the hypoxia marker HIF1A and the internal reference GAPDH from whole-cell extracts. The immunoblot is representative of 3 independent experiments. (C) Schematic representation of the Krebs cycle where the reaction catalyzed by the enzyme fumarase from fumarate (substrate) to l-malate (product) is framed. Levels of the (D) fumarate and (E)l-malate metabolites expressed in nmol/mg of protein. (F) Fumarase specific activity (fumarase activity/fumarase protein content) expressed as percent of untreated control BD3 cell line. Dosages (fumarate, malate) and enzyme activity (fumarase), n = 3 independent experiments, mean ± SD. *p ≤ 0.05 **p ≤ 0.01 ***p ≤ 0.001 based on one-way ANOVA versus the untreated control (red stars) or the corresponding untreated condition (blue stars). (For interpretation of the references to color in this figure legend, the reader is referred to the Web version of this article.)
Fig. 2
Fig. 2
NO metabolism and antioxidant defense upon STOX1 overexpression and hypoxia. (A) Quantification of inducible NOS (iNOS; NOS2) fluorescence intensity per cell (images in Fig. S2A). Assessment of (B) Nitric oxide (NO) using the DAF-2 DA probe, (C) the ROS anion superoxide (O2) using the DHE probe, and (D) the RNS peroxynitrite (ONOO) using the DHR123 probe, expressed as percentage of the untreated control BD3 cell line. (E) Total SOD activity (measured as inhibition of the activity of SOD, percentage). (F) Catalase activity expressed in nmol/min/ml. Immunofluorescence, n = 60 cells from three independent experiments, mean ± SD. Dosages (NO, O2, peroxynitrite), n = 3–6. Enzyme activities (SOD, catalase), n = 6 for untreated BD3/AA6/B10 in NO and O2 assays, n = 3 independent experiments for all other experiments, mean ± SD, *p ≤ 0.05 **p ≤ 0.01 ***p ≤ 0.001 based on one-way ANOVA versus the untreated control (red stars) or the corresponding untreated condition (blue stars). (For interpretation of the references to color in this figure legend, the reader is referred to the Web version of this article.)
Fig. 3
Fig. 3
Mitochondrial ROS and mitochondrial bioenergetic upon STOX1 overexpression and hypoxia. (A) 3D reconstructions of cells stained with MitoSOX (red) to detect mitochondrial ROS (superoxide anion, O2), counterstained with Hoechst (blue). Scale bar 10 μm, and (B) Quantification of MitoSOX fluorescence intensity per cell. (C) Schematic representation of Krebs cycle including the reaction catalyzed by citrate synthase from oxaloacetate (substrate) to citrate (product). (D) Citrate synthase activity expressed in mU/mg of protein. (E) Acetyl-CoA expressed in nmol/g protein. (F)Total ATP expressed as percentage of the untreated control BD3 cell line with non-OXPHOS and OXPHOS fractions. Immunofluorescence, n = 60 cells from three independent experiments, mean ± SD. Dosage (ATP, Acetyl-CoA), enzyme activity (citrate synthase), n = 3 independent experiments, mean ± SD, *p ≤ 0.05 **p ≤ 0.01 ***p ≤ 0.001; based on one-way ANOVA versus the untreated control (red stars) or the corresponding untreated condition (blue stars). (For interpretation of the references to color in this figure legend, the reader is referred to the Web version of this article.)
Fig. 4
Fig. 4
The BH4 metabolite counteracts STOX1 effects through iNOS regulation and rescue ofl-malate levels. (A) Quantification of iNOS/NOS2 fluorescence intensity per cell. (B) Quantification of mitochondrial ROS fluorescence intensity per cell. (C) Percentage of peroxynitrite RNS relative to the untreated control BD3 cell line. (D) Fumarase specific activity (ratio of fumarase activity/fumarase protein content) expressed as percent of untreated control BD3 cell line. Levels of l-malate (E) and fumarate (F) expressed in nmol/mg of protein. Data of untreated cells are from the corresponding panels in Fig. 2A (iNOS), Fig. 3B (mitochondrial ROS), Fig. 2D (RNS), Fig. 1F (fumarase specific activity), Fig. 1D (fumarate), Fig. 1E (l-malate). Immunofluorescence, n = 60 cells from three independent experiments, mean ± SD. Dosages (peroxynitrite, fumarate, malate) and enzyme activity (fumarase), n = 3 independent experiments, mean ± SD. *p ≤ 0.05 **p ≤ 0.01 ***p ≤ 0.001 based on one-way ANOVA versus the untreated control (red stars) or the corresponding untreated condition (pink or purple stars). (For interpretation of the references to color in this figure legend, the reader is referred to the Web version of this article.)
Fig. 5
Fig. 5
In vivo STOX1 model of preeclampsia and BH4 effect on placenta transcriptomics. (A)in vivo model of preeclampsia and preclinical trial using BH4 supplementation in healthy and preeclamptic pregnant mice. (B) Principal Component Analysis of gene expression in control and STOX1-overexpressing placentas at 16.5 days post-coïtum, with or without BH4 treatment. (C) Enrichment of gene expression of KEGG pathways in STOX1 placentas with or without BH4 treatment. (D) Enrichment of specific pathways related to placental function in this comparison. (E) BH4 rescues the alteration of gene expression induced by STOX1 overexpression in the placenta (threshold chosen: genes with more than two fold changes, and corrected to <30% of the value in control samples).
Fig. 6
Fig. 6
Cell proportions in the placenta are altered by BH4 treatment, and major endothelial genes are deregulated. (A) Using deconvolution, we were able to dissociate the different major cell types present in the mouse placenta. The proportion of cells was altered by BH4 for trophoblasts and for decidual stromal cells, while the other cell types did not differ quantitatively. (B) In the endothelial cells, several genes were deregulated. The column ‘Specificity’ refers to the endothelial specificity, with *** for genes expressed exclusively in the endothelium, while ** and * refers to genes that are expressed in other tissues, albeit predominantly in the endothelial cells.
Fig. 7
Fig. 7
in vivo evidence of BH4 treatment efficiency in preeclampsia in the STOX1 model. (A) Systolic arterial pressure throughout gestation expressed in mm Hg relative to pre-gestation. Black stars compare the mice carrying transgenic animals untreated versus untreated mice carrying WT embryos. Pink stars show a restoration of the blood pressure under BH4 treatment in mice carrying STOX1 overexpressing fetuses. (B) Albumin/creatinine ratio normalized to WT value at E17.5 (late-gestation). (C) Heart weight (mg) to tibia length (mm) ratio. For systolic arterial pressure, data are from n = 9 for WTxWT, n = 7 for WTxWT + BH4, n = 16 for WTxhtTgSTOX42 and n = 12 for WTxhtTgSTOX42 +BH4. For the ACR ratio, data are from n = 7 for WTxWT, n = 5 for WTxWT + BH4, n = 10 for WTxhtTgSTOX42, and n = 9 for WTxhtTgSTOX42 +BH4 mice. For heart weight to tibia length ratio, data are from n = 6 for WTxWT, n = 6 for WTxWT + BH4, n = 4 for WTxhtTgSTOX42, and n = 6 for WTxhtTgSTOX42+BH4 mice; (D) Echographic parameters of the mice comparing STOX1 mice and STOX1 mice treated with BH4. (E) Placental weight in mice carrying transgenic fetuses treated or not by BH4. Mean ± SD. *p ≤ 0.05 **p ≤ 0.01 ***p ≤ 0.001 based on one-way ANOVA, followed by post hoc Dunnett tests using the untreated gestations as a control. (For interpretation of the references to color in this figure legend, the reader is referred to the Web version of this article.)
Fig. 8
Fig. 8
In vivo evidence of BH4 treatment benefit on IUGR in the RUPP rat model. (A) Structure of the uterine vascularization of the rat uterus. In red are the silver clips that restrict blood flow to 100 μM in the ovarian arteries and to 230 μM in the abdominal aorta. (B, C, D) Mean arterial pressure (MAP), fetal and placental weights analyzed in the RUPP rats. Placental efficiency (D) is calculated by dividing the body weight by the placental weight for every feto-placental unit. (E) Isolated uterine artery function was evaluated using cumulative doses of Acetylcholine (Ach) via wire myography. The area under the curve (AUC from the curve obtained as relaxation against doses of Ach) was considered. (For interpretation of the references to color in this figure legend, the reader is referred to the Web version of this article.)
Fig. 9
Fig. 9
Model for STOX1 effects and BH4 therapeutic opportunity to treat preeclampsia. Increased STOX1 expression induces iNOS accumulation and iNOS uncoupling, NO overproduction and subsequently altered pathways: namely nitroso-redox balance and antioxidant defense, bioenergetic metabolism, the Krebs cycle including citrate synthase activity, fumarase activity and the related l-malate, mitochondrial OXPHOS, in the context of altered stability of the hypoxia effector HIF1A. These alterations are potentially related to preeclampsia symptoms. Supplementation of the NOS cofactor BH4 restores iNOS levels and modulates the other altered patways, opening a new therapeutical opportunity to treat preeclampsia symptoms.

Similar articles

Cited by

References

    1. Phipps E.A., Thadhani R., Benzing T., Karumanchi S.A. Pre-eclampsia: pathogenesis, novel diagnostics and therapies. Nat. Rev. Nephrol. 2019;15:275–289. - PMC - PubMed
    1. Chen C.W., Jaffe I.Z., Karumanchi S.A. Pre-eclampsia and cardiovascular disease. Cardiovasc. Res. 2014;101:579–586. - PMC - PubMed
    1. Basit S., Wohlfahrt J., Boyd H.A. Pre-eclampsia and risk of dementia later in life: nationwide cohort study. BMJ. 2018;363:k4109. - PMC - PubMed
    1. Gupta S., Agarwal A., Sharma R.K. The role of placental oxidative stress and lipid peroxidation in preeclampsia. Obstet. Gynecol. Surv. 2005;60:807–816. - PubMed
    1. Myatt L., Cui X. Oxidative stress in the placenta. Histochem. Cell Biol. 2004;122:369–382. - PubMed

LinkOut - more resources