. 2022 Sep:83:104192.
doi: 10.1016/j.ebiom.2022.104192. Epub 2022 Aug 11.

Exercise training enhances muscle mitochondrial metabolism in diet-resistant obesity

Affiliations

Exercise training enhances muscle mitochondrial metabolism in diet-resistant obesity

Chantal A Pileggi et al. EBioMedicine. 2022 Sep.

Abstract

Background: Current paradigms for predicting weight loss in response to energy restriction have general validity but a subset of individuals fail to respond adequately despite documented diet adherence. Patients in the bottom 20% for rate of weight loss following a hypocaloric diet (diet-resistant) have been found to have less type I muscle fibres and lower skeletal muscle mitochondrial function, leading to the hypothesis that physical exercise may be an effective treatment when diet alone is inadequate. In this study, we aimed to assess the efficacy of exercise training on mitochondrial function in women with obesity with a documented history of minimal diet-induced weight loss.

Methods: From over 5000 patient records, 228 files were reviewed to identify baseline characteristics of weight loss response from women with obesity who were previously classified in the top or bottom 20% quintiles based on rate of weight loss in the first 6 weeks during which a 900 kcal/day meal replacement was consumed. A subset of 20 women with obesity were identified based on diet-resistance (n=10) and diet sensitivity (n=10) to undergo a 6-week supervised, progressive, combined aerobic and resistance exercise intervention.

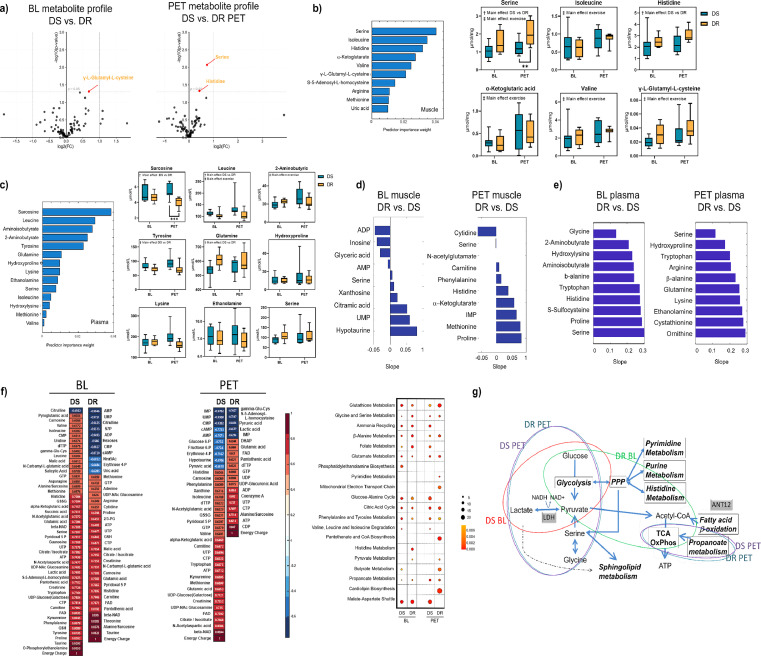
Findings: Diet-sensitive women had lower baseline adiposity, higher fasting insulin and triglycerides, and a greater number of ATP-III criteria for metabolic syndrome. Conversely in diet-resistant women, the exercise intervention improved body composition, skeletal muscle mitochondrial content and metabolism, with minimal effects in diet-sensitive women. In-depth analyses of muscle metabolomes revealed distinct group- and intervention- differences, including lower serine-associated sphingolipid synthesis in diet-resistant women following exercise training.

Interpretation: Exercise preferentially enhances skeletal muscle metabolism and improves body composition in women with a history of minimal diet-induced weight loss. These clinical and metabolic mechanism insights move the field towards better personalised approaches for the treatment of distinct obesity phenotypes.

Funding: Canadian Institutes of Health Research (CIHR-INMD and FDN-143278; CAN-163902; CIHR PJT-148634).

Keywords: Exercise; Metabolomics; Mitochondria; Mitochondrial supercomplexes; Muscle physiology; Obesity; Serine; Sphingolipids; Uncoupling; Weight loss.


Conflict of interest statement

Declaration of interests The authors declare no conflicts of interest.

Figures

Figure 1
Figure 1
Diet-sensitive women with enhanced weight loss capacity have lower body fat (%), but are more at risk of cardiometabolic diseases associated with obesity. (a) Summary of screening patient records for eligibility. Patient records from the Ottawa Hospital Weight Management Clinic were assessed for adherence (as previously described), and screened for missing data. Records from patients with obesity in the top 20% for weight loss success (diet-sensitive, DS) were reviewed and compared to well-matched women in the bottom 20% of rate of weight loss (diet-resistant, DR). (b-d) Body composition and blood biochemistry of 228 matched DS and DR women with obesity (n=114). (b) DR women have greater body fat (%) as assessed by bioelectrical impendence analysis (BIA). (c) DR women had a smaller waist circumference, and (d) lower fasting insulin compared to DS women with obesity. (e-f) DR women with obesity lost less fat mass in 12 weeks while on a 900 kcal/day hypocaloric diet. (e) Fat mass across 12-weeks; (f) Rate of fat mass loss. (g-l) Body composition analysed by DEXA of 40 well-matched DR and DS women with obesity, (n=20). (g) Body fat (%) was higher in DR women with obesity. (h) Fat mass was similar between groups, whereas (i) lean mass was lower in DR women. Regional analyses showed no difference between groups in android fat (j), but revealed greater gynoid fat in DR women (k). The regional differences in fat mass resulted in a higher ratio of android:gynoid fat in DS obesity (l). Comparisons between groups were as determined using a two-tailed Student's t-test. *P<0.05, **P<0.01, *** P<0.001. Values are means±SD.
Figure 2
Figure 2
Exercise training preferentially improves body composition in diet-resistant women with low resting metabolism and muscle strength. (a) Schematic summary of the time points for sample collection, testing procedures, and intervention. Briefly, 10 diet-sensitive (DS) and 10 age-, weight-, and BMI-matched diet-resistant (DR) women with obesity were recruited to undergo a 6-week supervised exercise training intervention. Baseline (BL), post-exercise training (PET). (b) Exercise training did not induce weight loss or alter fat-free mass in either group, but selectively lowered body fat (%) and fat mass in DR women, (n=10, two-tailed Student's t-test *P<0.05). See also Table 1. (c) DR women had lower resting energy expenditure at BL compared to DS women with obesity, but not PET, (n=10). (d) DS and DR did not differ in energy expenditure during exercise when assessed using a graded submaximal exercise; However, DR women had a higher respiratory exchange ratio (RER) at greater workloads (40W), and higher heart rates (HR) throughout the exercise test. Exercise training lowered RER and HR in both groups, (n=10). (e) Isometric strength during knee extension was lower in DR women regardless of exercise training. Exercise training improved strength in both groups, (n=10 DS, n=9 DR). (f) Exercise training increased skeletal muscle protein concentration per mg tissue in DR women only, (n=9–10). (g) DR muscle exhibited fewer type I fibres than DS muscle, regardless of exercise training, (n=8 DS, n=7 DR). All values are presented as means ± SD. Unless otherwise stated, a two-way ANOVA for repeated-measures with Holm-Sidak post hoc test was used. † Main effect of DS vs. DR (P<0.05), ‡ Main effect of exercise (P<0.05). *P<0.05, **P<0.01 ***P<0.001.
Figure 3
Figure 3
Exercise training preferentially improves mitochondrial content and function in diet-resistant women with obesity. (a) Citrate synthase activity (CS) tended to be lower in vastus lateralis from DR women compared to DS at BL (P=0.066). CS activity increased in DR muscle only at PET. Succinate dehydrogenase activity was lower in DR muscle regardless of exercise training, (n=10). (b) PGC1α protein expression increased in both DS and DR muscle following exercise training, (n=9 DS, n=8 DR). (c) High-resolution respiratory flux per mg of saponin-permeabilised vastus lateralis muscle. Exercise training enhanced complex I (CI) oxidative phosphorylation (OXPHOS) and CI+II OXPHOS, and improved FCCP-induced maximal respiration in DR muscle. However, oligomycin-induced leak respiration was lower in DR muscle, regardless of exercise training. (n=9 DS, n=7 DR). (d) Seahorse analysis on biopsy-derived primary myotubes demonstrated that basal and maximal oxygen consumption was enhanced with exercise training in DR women, (n=9). (e) Mitochondrial length increased with exercise training in primary myoblasts isolated from DR women. Representative images are shown beside the graph; scale bars, 20 µm, (n=8). (f) Fluorometric quantification of H2O2 emission demonstrated that oligomycin-induced H2O2 was higher at BL in DR vastus lateralis when corrected for mitochondrial content using citrate synthase (CS) activity. Exercise training decreased H2O2 emission in DR muscle, (n=7). (g) Immunoblot analyses revealed protein expression of the adenine nucleotide translocase was lower in DR vastus lateralis compared to DS regardless of exercise training. In contrast, protein expression of UCP3 did not differ, (n=9 DS, n=8 DR). (h) Skeletal muscle biopsies were solubilized with 1.5% vol/wt digitonin prior to separation via BN-PAGE. Vastus lateralis from DR women had lower expression of CIII-containing SC and CII monomer regardless of exercise training. Exercise training enhanced CIII and CIV supercomplex formation, as well as CII and CV monomer expression in both groups. (i) When normalising SCs to CII, no differences were observed in CIII or CIV supercomplex formation (n=9 DS, n=8 DR). All values are presented as means ± SD. A two-way ANOVA for repeated-measures with Holm-Sidak post hoc test was used. † Main effect of DS vs. DR (P<0.05), ‡ Main effect of exercise (P<0.05). *P<0.05, **P<0.01 ***P<0.001.
Figure 4
Figure 4
Exercise training improves the skeletal muscle metabolite network in diet-resistant women with obesity. (a-f) Metabolomic analyses of vastus lateralis and plasma samples from DR and DS women with obesity at BL and PET. (a) Volcano plots of metabolite profiles from vastus lateralis at BL and PET. Significant features (P<0.05, Student's t-test) highlighted. Serine was higher in DR muscle following exercise training (with FDR correction), (n=9 DS, n=8 DR). (b) Selection of the most significantly different features between DR and DS at BL and PET from metabolomics measurements in vastus lateralis. Shown are all features with ReliefF weight measure over 0 (significant contributors to a classification model), (n=9 DS, n=8 DR). (c) Selection of the most significantly different features between DR and DS plasma at BL and PET. Shown are all features with ReliefF weight measure over 0 (significant contributors to a classification model). Sarcosine was lower in DR plasma after exercise training. *P<0.05 with FDR correction, (n=10). (d) Selection of metabolites with the largest change in their distance correlation network in skeletal muscle (n=9 DS, n=8 DR). See also Figure S5 and S6. (e) Selection of metabolites with the largest change in their distance correlation network in plasma (n=9 DS, n=8 DR). See also Figure S5 and S7. (f) Selection of skeletal muscle metabolites with the largest change in their distance correlation network with adenylate energy charge [(ATP+0.5*ADP)/(ATP+ADP+AMP)], with pathway enrichment analysis based on these metabolites. Shown are metabolite partners with distance correlation > 0.7; P<0.02, (n=9 DS, n=8 DR). (g) Proposed pathway differences in skeletal muscle energy metabolism related to the adenylate correlation network.
Figure 5
Figure 5
Exercise training differentially alters the serine-sphingolipid muscle metabolite networks in diet-sensitive and diet-resistant women with obesity. (a-e) Enriched metabolite networks reveal differing profiles in vastus lateralis from DR and DS individuals at BL and PET. (a) The correlation network for plasma serine. Shown are partners with distance correlation > 0.7; P<0.02, (n=10). (b) Selection of the most significantly different sphingolipid features in vastus lateralis. Shown are features with ReliefF weight measure over 0.03 (major contributors to a classification model), (n=5). (C) Immunoblot analyses revealed relative protein expression of SPTLC1 did not differ between DR and DS, whereas expression of SPTLC2 was lower in DR skeletal muscle following exercise training. (*P<0.05, Two-way ANOVA for repeated-measures with Holm-Sidak post hoc test, n=9). (d) Heatmap clustering of relative sphingolipid level changes compared to the total sample mean in the DS and DR groups before and after exercise. Data were log-transformed and z-scored. (e) Sphingolipid metabolic pathway indicating network correlations are distinct in DR and DS groups at baseline. Direction of arrows indicates direction of correlation; arrow colours indicate correlations between sphingolipid species at the beginning (serine) or end (O-phosphorylethanolamine (PE)) of the sphingolipid metabolic pathway in either the DR or DS groups. The number of species with significant correlations in each subclass (absolute correlation level over 0.6 with P<0.05) are indicated. Data in bar graphs represent mean ± SEM. (*P< 0.05, t‐test with Welch's correction, n=5). See also Figure S4.

Similar articles

Cited by

References

    1. Flegal KM, Kit BK, Orpana H, Graubard BI. Association of all-cause mortality with overweight and obesity using standard body mass index categories: a systematic review and meta-analysis. JAMA. 2013;309(1):71–82. - PMC - PubMed
    1. Heymsfield SB, Wadden TA. Mechanisms, pathophysiology, and management of obesity. N Engl J Med. 2017;376(3):254–266. - PubMed
    1. Lemstra M, Bird Y, Nwankwo C, Rogers M, Moraros J. Weight loss intervention adherence and factors promoting adherence: a meta-analysis. Patient Prefer Adher. 2016;10:1547–1559. - PMC - PubMed
    1. Dent R, McPherson R, Harper M-E. Factors affecting weight loss variability in obesity. Metabolism. 2020;113 - PubMed
    1. Stinson EJ, Piaggi P, Votruba SB, et al. Is dietary nonadherence unique to obesity and weight loss? Results from a randomized clinical trial. Obesity (Silver Spring) 2020;28(11):2020–2027. - PMC - PubMed