. 2022 Aug 14;12(1):127.
doi: 10.1186/s13578-022-00864-w.

Osteoclast-derived extracellular vesicles are implicated in sensory neurons sprouting through the activation of epidermal growth factor signaling

Affiliations

Osteoclast-derived extracellular vesicles are implicated in sensory neurons sprouting through the activation of epidermal growth factor signaling

Estrela Neto et al. Cell Biosci. .

Abstract

Background: Different pathologies, affecting the skeletal system, were reported to display altered bone and/or cartilage innervation profiles leading to the deregulation of the tissue homeostasis. The patterning of peripheral innervation is achieved through the tissue-specific expression of attractive or repulsive axonal guidance cues in specific space and time frames. During the last decade, emerging findings attributed to the extracellular vesicles (EV) trading a central role in peripheral tissue innervation. However, to date, the contribution of EV in controlling bone innervation is totally unknown.

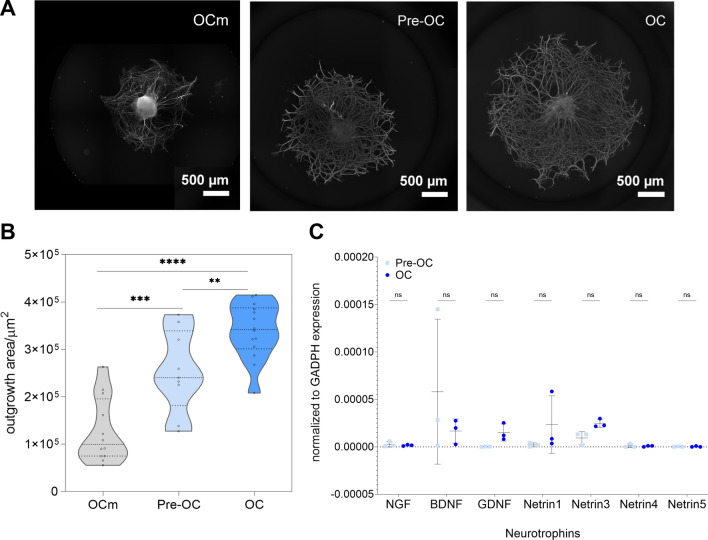
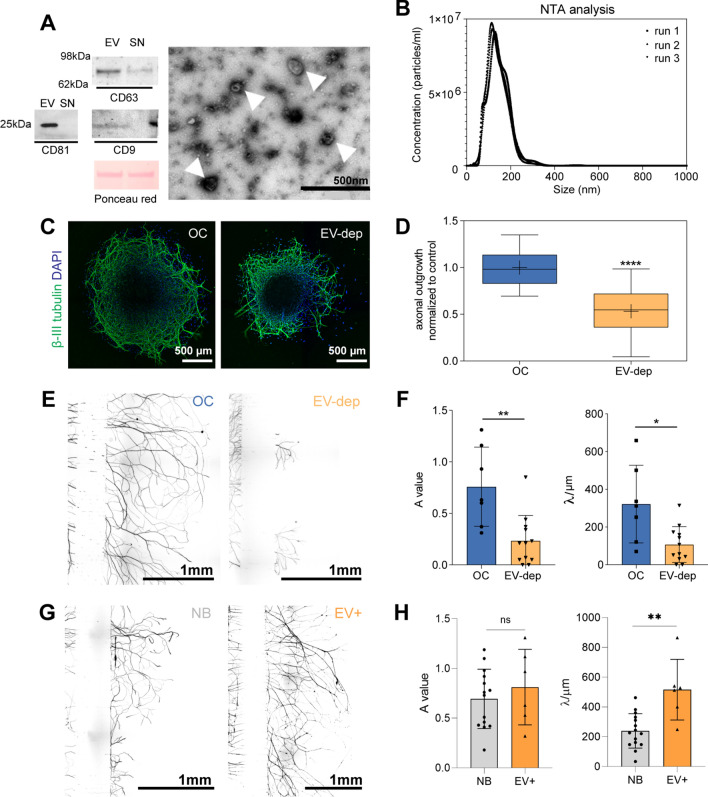
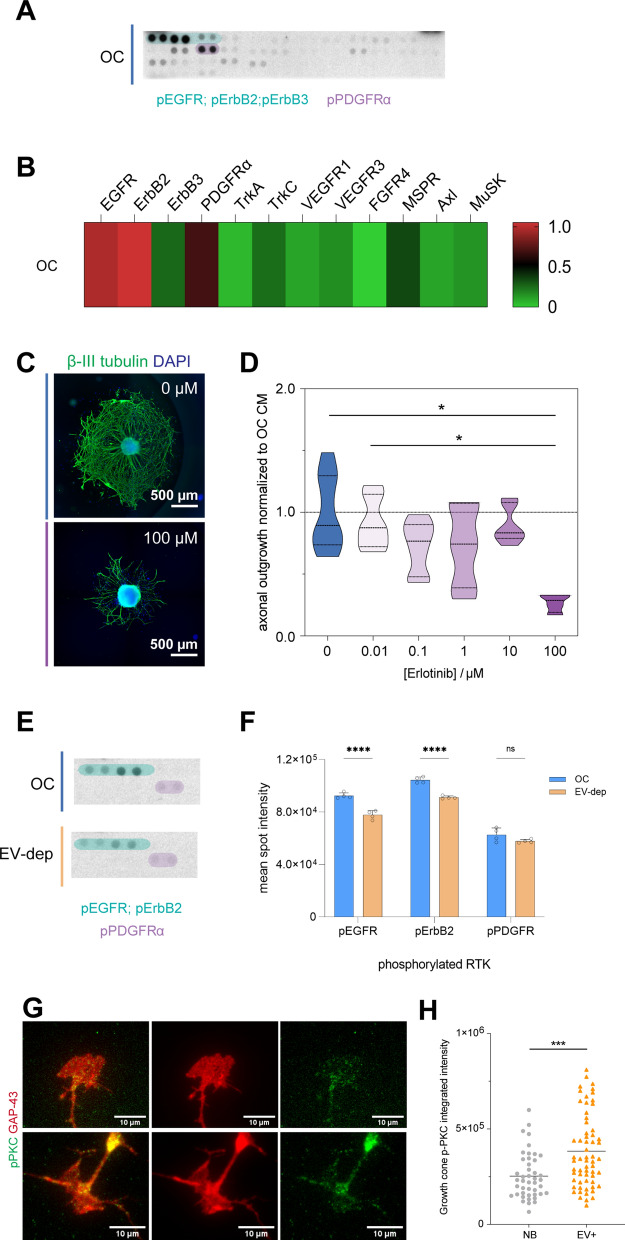
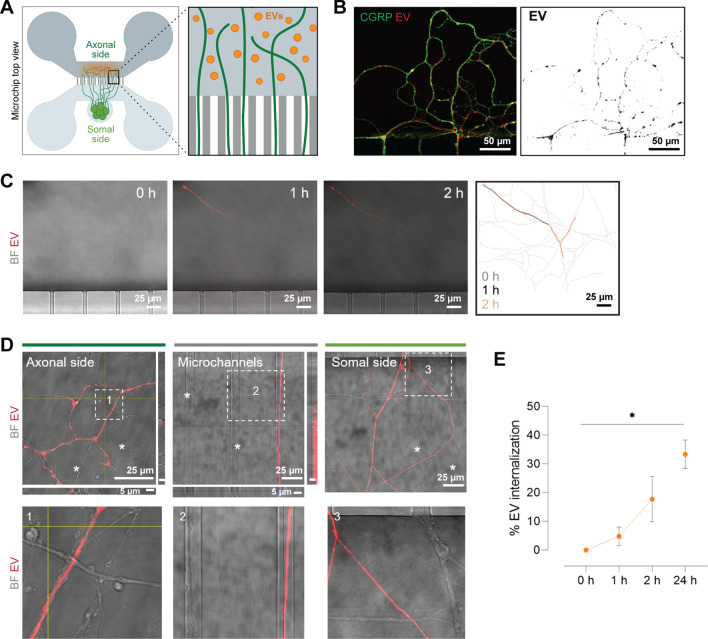
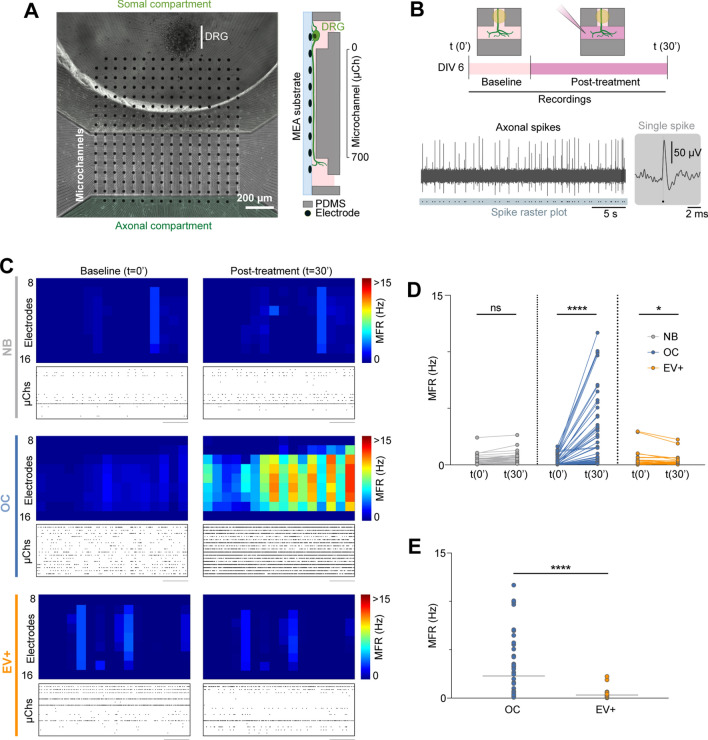
Results: Here we show that sensory neurons outgrowth induced by the bone resorbing cells-osteoclasts-is promoted by osteoclast-derived EV. The EV induced axonal growth is achieved by targeting epidermal growth factor receptor (EGFR)/ErbB2 signaling/protein kinase C phosphorylation in sensory neurons. In addition, our data also indicate that osteoclasts promote sensory neurons electrophysiological activity reflecting a possible pathway in nerve sensitization in the bone microenvironment, however this effect is EV independent.

Conclusions: Overall, these results identify a new mechanism of sensory bone innervation regulation and shed the light on the role of osteoclast-derived EV in shaping/guiding bone sensory innervation. These findings provide opportunities for exploitation of osteoclast-derived EV based strategies to prevent and/or mitigate pathological uncontrolled bone innervation.

Keywords: Bone pain; Epidermal growth factor receptor (EGFR/ErbB2) signaling; Extracellular vesicles; Neuronal electrophysiology; Osteoclast secretome; Sensory neurons sprouting.


Conflict of interest statement

The authors have no relevant financial or non-financial interests to disclose.

Figures

Fig. 1
Fig. 1
Sensory neurons axonal outgrowth is promoted by osteoclasts secretome. A Representative images of dorsal root ganglia (DRG) outgrowth after treatment (stained for βIII-tubulin, scale bar 500 µm). Fresh osteoclast medium [OCm: alpha-MEM supplemented with 10% fetal bovine serum (FBS), receptor activator of nuclear factor kappa-Β ligand (RANKL) and macrophage colony-stimulating factor (M-CSF)], pre-osteoclast conditioned media (Pre-OC), and mature osteoclast conditioned media (OC) were used to stimulate embryonic DRG culture. B Automatic axonal outgrowth area quantification. Data represented as a violin plot; **p ≤ 0.01; ***p ≤ 0.001 and ****p ≤ 0.0001. C. Gene expression analysis of neurotrophic factors expressed by pre-osteoclasts (Pre-OC) and mature osteoclasts (OC), normalized for the expression of glyceraldehyde 3-phosphate dehydrogenase (GAPDH) housekeeping gene. Nerve growth factor (NGF), brain-derived neurotrophic factor (BDNF), glial cell line-derived neurotrophic factor (GDNF), and netrins 1, 3, 4 and 5. Data represented as scatter dot plot mean ± SD
Fig. 2
Fig. 2
Dorsal root ganglia (DRG) axonal network growth is dependent on the osteoclasts extracellular vesicles (EV). A Characterization of osteoclast-derived EV by Western blot using CD81, CD63 and CD9 membrane markers [EV enriched fraction (EV) vs. EV-depleted supernatant (SN)]. Ponceau red staining showing the total amount of protein loaded. Transmission electron microscopy of osteoclast-derived EV (white arrows) by negative staining. Scale bar 500 nm. B Nanoparticle tracking analysis (NTA; NanoSight NS300) of the osteoclast-derived EV enriched fraction showing the concentration vs. size distribution (diluted in filtered PBS 1:500). Lines representing 3 runs. C Representative images of DRG treated with osteoclast secretome (OC) and EV-depleted osteoclast secretome (EV-dep). Staining for βIII tubulin, scale bar 500 µm. D Quantification of axonal sprouting area of DRG. Data represented as box and whiskers (median, whiskers represent minimum to maximum range), ****p ≤ 0.0001. E Representative images of DRG cultures in microfluidic devices. Nerve terminals exposed to complete osteoclasts secretome (OC) and EV-depleted osteoclasts secretome (EV-dep). Axons stained against βIII-tubulin; scale bar: 1 mm. F Quantification of the axonal growth using AxoFluidic algorithm. The data were given by the spatial dependence decay function f(x)=A·exp(-x/λ) of the axons that can effectively cross the microchannels, where the constant A represents the entering in the axonal compartment, and λ the scale of spatial decay, as a measure to represent the length of the neurites. G Representative images of DRG cultures in the microfluidic platforms. Nerve terminals exposed to neurobasal control (NB) and osteoclast-derived EV (EV+). Axons stained against βIII-tubulin; scale bar: 1 mm. H Quantification of the axonal growth using AxoFluidic algorithm. The constant A represents the enter in the axonal compartment, and λ the scale of spatial decay, as a measure to represent the length of the neurites. Results are presented as bar ± SD, ns—non-significative; *p ≤ 0.05; **p ≤ 0.01 and ***p ≤ 0.001. Each dot represents a microfluidic device analyzed from at least three independent experiments
Fig. 3
Fig. 3
Epidermal-growth factor receptor (EGFR) activation. A Screening of receptor tyrosine kinases (RTK) phosphorylation levels in DRG cultures exposed to osteoclast secretome. Images of the X-ray films. For the analysis, 100 µg of protein lysate from 3 independent experiments (n = 3), was pooled. Elliptical shapes highlighting the spots corresponding to epidermal-growth factor receptors (EGFR, ErbB2 and ErbB3, light green) and platelet-derived growth factor receptor-alpha (PDGFα, light purple). B Heatmap representing the relative spot intensity for the activated receptors calculated from the pixel density, showing the primary activation of two different families: EGFR family and PDGF. C Pharmacological inhibition of EGFR and ErbB2 with increasing doses of Erlotininb. Representative images of DRG treated with different concentrations of Erlotinib for 72 h (βIII tubulin in green and nuclei in blue, scale bar 500 µm). D Quantification of axonal outgrowth of sensory neurons blocked with EGFR inhibitor—Erlotinib at different concentrations added to osteoclast conditioned medium. Data represented as violon plot *p ≤ 0.05. E Levels of receptor tyrosine kinases (RTK) phosphorylation in DRG cultures exposed to osteoclast secretome (OC, blue) and EV-depleted secretome (EV-dep, light orange). Images of the X-ray films. Elliptical shapes highlighting the spots corresponding to epidermal-growth factor receptors (EGFR, ErbB2 and ErbB3, light green) and platelet-derived growth factor receptor-alpha (PDGFα, light purple). F Graph representing the mean spot intensity of the activated receptors EGFR, ErbB2 and PDGFα for the DRG exposed to osteoclast secretome (OC, blue) and EV-depleted secretome (EV-dep, light orange). Data represented as bars with individual values (n = 4), mean ± SD, ns—non-significative; ****p ≤ 0.0001. G Representative images of sensory neurons growth cones exposed to neurobasal (NB; upper row) vs. EV enriched fraction (EV+; lower row), stained against growth-associated protein (GAP-43, red) and phosphorylated PKCα (green); scale bar: 10 µm. H Quantification of the integrated intensity of phosphorylated PKCα at the growth cones exposed to NB (grey) vs. EV+ (orange). Intensity of phosphorylated PKCα normalized for the growth cone area calculated through GAP-43 staining. Results are presented as scatter dot plot; ***p ≤ 0.01
Fig. 4
Fig. 4
Internalization profile of osteoclast-derived EV by dorsal root ganglia (DRG) neurons in compartmentalized microfluidic chips. A Schematic representation of the experimental setup: microfluidic device with DRG culture on the somal side growing towards the axonal side. EV labelled with PKH26 lipophilic dye (red) added to the axonal side in close contact with nerve terminals. B Representative images of sensory neurons stained against calcitonin gene-related peptide (CGRP, green) with internalized EV (red) in the axonal compartment in the microfluidic devices; scale bar: 50 µm. C Representative images of EV labelled internalization by sensory neurons. Live imaging was performed under controlled temperature and CO2 over 0, 1 and 2 h showing the sensory neurons in brightfield (grey) and internalized EV (red); scale bar: 25 µm. Superimposed tracing of total neurites (grey) and neurites with internalized EV (black 1 h, orange 2 h), attained with Simple Neurite Tracer plugin, Fiji software, are shown in the far right. D Representative images of EV labelled internalization by sensory neurons after 24 h incubation. Images from axonal side, microchannels and somal side of the microfluidic device. Brightfield images showing the sensory neurons extensions and EV in red. White asterisks indicate sensory neurons without internalized EV. Orthogonal projections depicting the selective internalization of the EV (red); scale bar: 25 µm top view and 1 µm orthogonal view. Lower row shows zoom in of the indicated squares 1, 2 and 3. E Quantification of the EV internalization throughout time. Data represented as percentage of total neurites (mean ± SD), *p ≤ 0.05
Fig. 5
Fig. 5
Electrophysiology studies on DRG neurons in microfluidic devices stimulated with osteoclasts secretome vs. osteoclast-derived EV. A Phase-contrast microscopy image mosaic of an organotypic dorsal root ganglia (DRG) culture at 6 days in vitro (DIV). The whole microelectrode array (MEA) (1.5 × 1.5 mm) active area is shown by a combination of 9 mosaic images (10× objective) from different parts of the culture. A PDMS device composed of 16 microchannels (10 μm width; 700 μm length) is aligned to encompass 7 microelectrodes. Details of axonal morphology can be seen in the somal compartment, microchannels and axonal compartment (scale bar 200 μm). A schematized version of a microchannel is shown on the right. B Electrophysiological trace of 30 s of baseline activity from an electrode (within a microchannel) at 6 DIV and corresponding spike raster plot. Inset shows a single spike. C Representative activity maps (microchannel area only, electrode rows 9–15) of baseline and post-treatment (time 30 min) activity for each condition (NB—neurobasal; OC—osteoclasts secretome; EV+—osteoclast-derived EV). Each pixel corresponds to an electrode and the mean firing rate (MFR) is color-coded. Representative raster plots of 60 s of activity are shown below each activity map. Each row corresponds to the spike raster plot from the central electrode of a single microchannel. D Before-after plot of every active microchannel after treatment. ns = not significant, *0.01 < p < 0.05, **0.001 < p < 0.01, ***p < 0.001, ****p < 0.0001. E Scatter dot plots of the active microchannels’ MFR at 30 min post-treatment (OC—osteoclasts secretome; EV+—osteoclast-derived EV). Data from 35 to 61 microchannels from 3 to 5 independent μEFs

Similar articles

Cited by

References

    1. Leitão L, Neto E, Conceição F, et al. Osteoblasts are inherently programmed to repel sensory innervation. Bone Res. 2020;8:20. doi: 10.1038/s41413-020-0096-1. - DOI - PMC - PubMed
    1. Dickson BJ. Molecular mechanisms of axon guidance. Science. 2002;298:1959–1964. doi: 10.1126/science.1072165. - DOI - PubMed
    1. Stoeckli ET. Understanding axon guidance: are we nearly there yet? Development. 2018 doi: 10.1242/dev.151415. - DOI - PubMed
    1. Brazill JM, Beeve AT, Craft CS, et al. Nerves in bone: evolving concepts in pain and anabolism. J Bone Miner Res. 2019;34:1393–1406. doi: 10.1002/jbmr.3822. - DOI - PMC - PubMed
    1. Fukuda T, Takeda S, Xu R, et al. Sema3A regulates bone-mass accrual through sensory innervations. Nature. 2013;497:490–493. doi: 10.1038/nature12115. - DOI - PubMed